Online Graph Maker

Chosen by brands large and small
Customer Satisfaction 98%+
Used by 34.3 million users
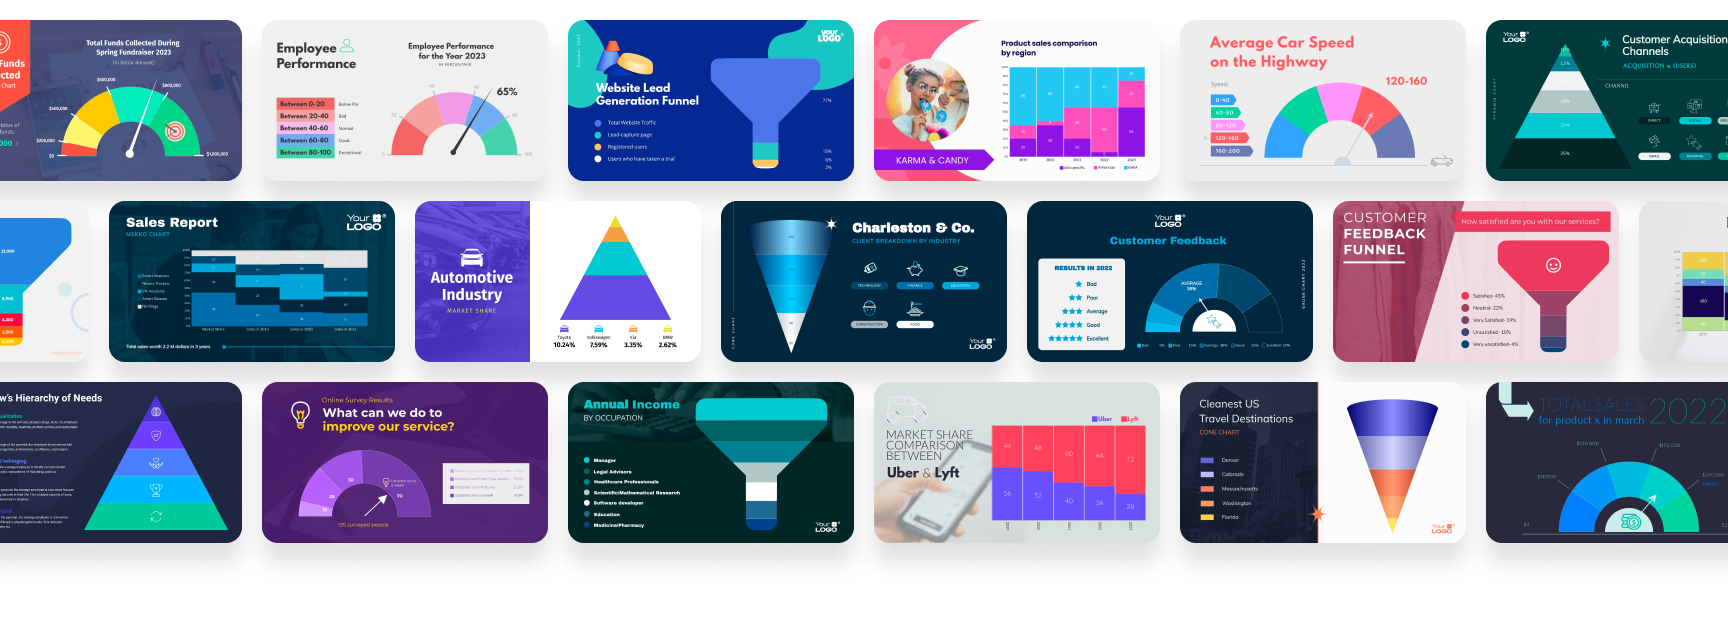
Create all types of graphs without the fuss
Make bar graphs, pie charts, flowcharts, diagrams, line graphs, histograms and everything in between with Visme’s graph maker. Import data in seconds and easily switch between different types of graphs to find the best presentation of your data.

More Great Features of
the Chart & Graph Maker
HOW IT WORKS
How to graph data with Visme’s Graph Maker
Turn your raw data into stunning and engaging data visualization charts or graphics with Visme. Elevate your key findings in projects, presentations or videos easily without design skills, complicated integration, coding or bulky and boring data visualization designs.
- Choose from our extensive library of 16 types of professionally designed graphs and charts templates created to display your most simple or complex data and findings.
- Customize the graph of your choice. Add your branding, animation so that it’s dynamic, and add or import data from apps such as Google Docs, Google Analytics, or Microsoft Excel, if needed.
- Download your graph as a high-resolution PNG or JPG image, PDF file, PPT file, HTML code, generate a shareable link, or embed code.
Populate charts and graphs with data
Upload static data or connect to Google sheets for live data
Upload your data as an Excel or CSV file to populate charts or pull live data from Google Sheets to update your charts automatically. Take advantage of the graph maker’s list of integrations to create graphs based on survey data, website data and more.

Seamlessly switch between chart types to find the best visualization
After you insert your data into the graph maker, you can easily find the best type of chart or graph that works for your data. You can switch between chart types both before and after uploading your data. Simply click through our list of graph types to find your best option.

Bar Graphs
Line Graphs
Pie Charts
Scatter Plots
Other Charts
Chart templates for all your data needs

Share graphs online
Share your chart or graph online by generating a publicly shareable link, embed to your website with an embed code from Visme or share your diagram link on social media.

Share graphs privately
Generate your chart or graph as an encrypted non-indexable URL. You can even make it password protected, or share only with your team members or subject matter experts.

Download graphs
Download your graph as a PDF document or high resolution image, or create your entire infographic in Visme. Download as HTML5 with full interactivity or as a PowerPoint file.
Easy. Versatile. Powerful.
Maximum flexibility. Everything you need from an online graph maker.
Convert your data to meaningful charts and graphs
Who can benefit by using our graph maker?
Data Analysts
- Turn complex data for detailed insights for decision-making
- Design graphs to easily communicate trends and patterns
- Compare and analyze data points to make strategic findings
Educators
- Design fun and engaging graphs for students and trainees
- Customize graphs with colors that match the topic's themes
- Use charts to track student details and retention rates
Researchers
- Create graphs to track marketing activities and campaigns
- Present stylish graphs in reports to make data more attractive
- Design charts for marketing content, such as blogs and social media
Marketing Teams
- Create graphs for quarterly reports, business plans, and presentations
- Present financial data and performance metrics clearly to stakeholders
- Use graphs for quick data interpretation and strategic decision-making
Business Professionals
- Design graphs to quickly present findings to investors or stakeholders
- Use graphs to compare experimental results and draw conclusions
- Create interactive charts without the need for a designer
Consultants
- Illustrate client data insights with colorful charts and graphs
- Add beautifully designed graphs in proposals and presentations
- Showcase past client success rates and results in graphs
Frequently Asked Questions (FAQs)
Creating a graph with Visme’s graph maker is 100% free. Just sign up for a free account, choose a graph template or start from scratch using our powerful graph editor, which gives you full granular control over your graph settings, including data, colors, fonts, legends and more. If you want to use premium graph templates and features, you can upgrade to a Standard or Business plan.
Absolutely! You can import graph data from Microsoft Excel by uploading a .XLSX or .CSV file. After that, you can also edit the data inside Visme’s graph maker to tweak it as you see fit.
Yes! It’s easy to add live data by connecting your graph to a Google Sheet. Simply head over to the Import Data tab in the graph editor, select Google Sheets and paste the URL of the Sheet you’d like to connect. Once you publish your project, your graph data will automatically sync with the changes you make in your Google Sheet. This means your published graph will be updated live on each visit so you no longer have to open and edit it manually.
Yes. Visme lets you download your graph in multiple formats, including JPG, PNG, PDF and HTML5. Use it as is, print it or add it to other projects like reports and presentations. You can also share your graph online with a link or embed it using a snippet of code.
What our users say about us?
“You can do everything within Visme, you don’t have to use multiple tools to get something completed and delivered. Everything is just in one place, and it’s all-encompassing.”
“I personally had experience with similar applications before Visme and found their tools weren’t as user-friendly as Visme, and their tools didn’t handle data very well. They didn’t provide the solution I really wanted.”