Free Map Maker for Interactive Maps

- Easy-to-use map generator with friendly user interface.
- Color code states, provinces and regions for easy comprehension.
- Add your own data values to make your own custom map.
Chosen by brands large and small
Our map generator is used by over 34,300,000 marketers, communicators, executives and educators from over 133 countries that include:
EASY TO EDIT
Map Templates
It’s never been easier to represent geographical information than it is with Visme’s map generator. Simply choose one of our stunningly pre-designed templates to start with and customize it to fit your topic, brand or area.

Features of the Map Generator
Beautiful map templates
Starting from scratch can seem overwhelming, so we’ve created starting points with several basic map templates. Grab one for your region and fully customize it until it fits your brand and your topic. Everything in our templates can be edited to fit your vision.

Build your map
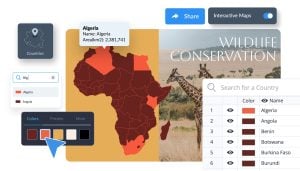
You have full range in our free map builder to create the perfect graphic for your project. Choose any region in the world and customize it to fit your topic. Color code different areas, add legends so your viewers know what everything means and get ready to share!

Customize every aspect of your map to cover your geographic area
Use the map maker to customize your map by placing the legend on either side, above or below. Toggle the data “hover” option to on or off. “On” means that the data will pop up in a little bubble when someone hovers over a section. Visualize your data by creating a custom color range, corresponding to the values in your data set, and choose your start and end color right within our map generator.

More Great Features of the Map Generator
-
Beautiful map templates to jumpstart your creativity
-
Input your brand fonts and colors to create branded company content
-
Millions of stock photos and icons to choose from
-
Easy drag-and-drop design tools, made with the non-designer in mind
-
Choose any geographical area in the world and color code it
-
Download as an image file or embed on a webpage
Share Your Map
Once you’ve built the perfect map representing your geographical region and you’ve color coded to make your point, Visme’s free map generator allows you to easily share your creation with your audience. Download as an image file or embed an interactive map onto your website.

LEARN ABOUT MAPS
What is a Map?
A map is a visual representation of a piece of land, and this can be used in many ways with Visme’s custom map maker. Choose any region on Earth, or multiple regions, and add them to your own map infographic.
Visme allows you to create an interactive map that you can embed on a webpage for your audience to hover over each region and learn specific data and information respective to each area on your map.

Use the map maker to visualize geographical areas.
Create professional-looking, color-coded maps in minutes. Inside the map maker, choose from the World Map, the seven continents or one specific country. Maps can be used as a graphic or as a data visualization. Choose the hover effect to display data according to each area.
EVERYTHING YOU NEED + MORE
More Than a Map Maker
Not only does Visme’s map creator allow you to seamlessly and easily create maps to visualize geographical areas for your audience, but its functionality also allows you to create an interactive experience. By adding data, like population and other regional statistics, your viewers can hover over an embedded or live map to view the results for each area.
DATA VISUALIZATION TOOLS
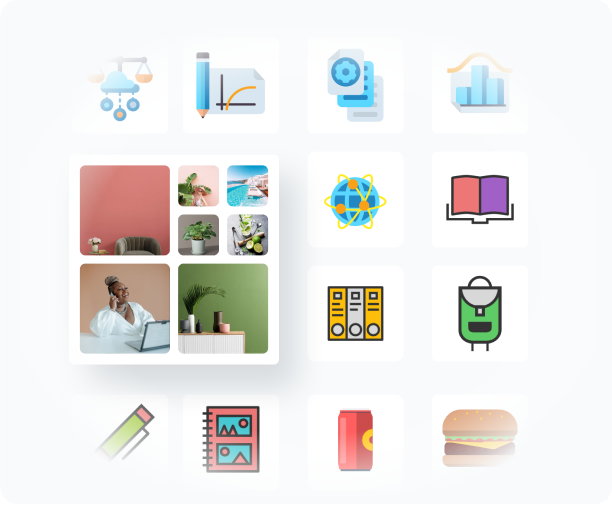
Photos & Graphics
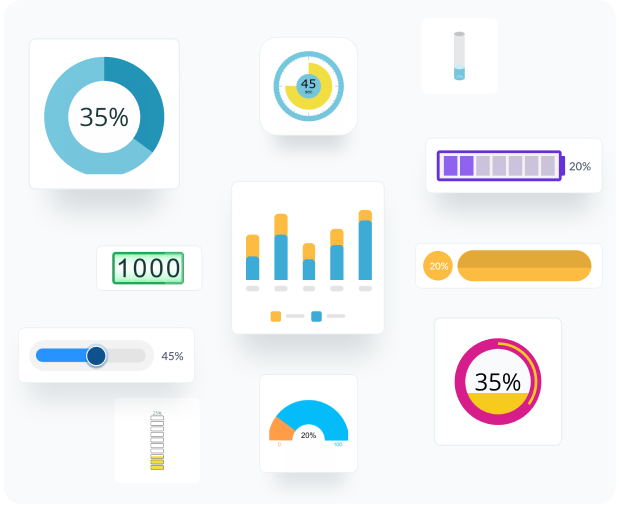
Easily visualize geographical data with maps, charts, graphs and other data widgets. All data tools are easily customizable with Visme.
BEAUTIFY YOUR CONTENT
30+ Data Widgets
Choose from over a million stock photos, icons, illustrations, characters, lines, shapes and more to create a completely customized and interactive map.
MAKE IT ENGAGING
Interactivity
Create animated and interactive maps that your audience can easily understand and engage with. Visme's map generator makes it easy.
HOW IT WORKS
How to Make Maps in 5 Steps
Show off different regions around the world with color coded countries, states, provinces and more. Visme’s free map maker allows you to quickly and easily represent geographical areas within a project, market research report or infographic.
Paste your data into the map generator and watch as your map comes to life. Create an interactive map that allows your audience to hover over each region to learn more information.
- Create a new project inside the Visme design dashboard and choose a map template or blank canvas to get started.
- Click on the Data button in the left-hand panel then click the world map icon below the graphs.
- Choose either the entire world map, a continent or a country to create your map.
- If adding data, choose the position of the legend. It can be placed on either side of the map, below or above.
- Download the map as is, or insert your map in the design you are working on.
QUICK TIPS
How to Use the Map Generator
Before you start using the map maker, have all your data values ready in a spreadsheet on your computer to easily copy and paste.
If you’re creating a map to showcase data, use the map generator to enter or paste your data in the columns. You can skip this step if you’re simply adding a map or region to a design.
Be sure to create a title for each column so that your map is properly labeled when you share it online.
Don’t forget to color code – this is one of the best features in the map generator. Use your Brand Kit to incorporate brand colors.
Select how the data is presented in your map by choosing whether it’ll display with or without hover bubbles. Leaving hover bubbles on helps you to create an interactive map your audience will love.
Choose the position of the legend so it fits well with the rest of the project you are working on.
Insert your map into any kind of design, including a social media graphic, infographic, presentation, flyer or even business card.
If using more than one map in your design, be sure to use similar colors to keep a unified style.
Who can benefit by using our map generator?
Travel Bloggers
- Design beautiful travel routes and highlight top destinations
- Use maps to add an element of storytelling in marketing materials
- Create stunning guides that provide valuable travel information
Event Planners
- Design event locations, sponsorship areas, and venue layouts
- Create a print out of the event map to guide attendees
- Map out key areas to show off event sponsors
Geography Teachers
- Design beautiful geographical locations for lesson plans
- Create interactive maps to keep students engaged and learning
- Use maps to turn complex data into simple information
Real Estate Agents
- Design property and neighborhood layouts for prospects
- Add property map layouts in marketing materials
- Craft maps to guide open house attendees during events
Marketing Teams
- Highlight regional sales performance and distribution networks
- Design maps to visualize location-based marketing strategies
- Present major marketing regions for new product launches or campaigns
Tour Operators
- Design stylish and on-brand travel itineraries and fun attractions
- Map out different travel routes for new and interested clients
- Showcase important landmarks travelers will see during tours
Questions About the Map Generator
How much does it cost to create a map with the map generator?
Creating a map with Visme is free. You can also download as JPG, PNG, PDF or HTML5 or share privately with Visme premium plans.
Are all the fonts available in the settings of the map generator?
No, but the font used is very easy to read and will fit well with any font pairing.
Does the map generator let me color-code any section of the map?
Absolutely. Any section of the map can be color coded. Either as a graphic highlighting specific areas or as a data visualization.
Can I choose any country in the world to make a map?
You bet. The Map Maker has all the countries of the world available. You can create a map of just one country and color code the states or counties.
Do I need to use the labeling from the map maker or can I make a map without labels?
Since the map maker will let you customize everything, you can choose to not include any labels. This will permit you to label it however you want inside your project with other graphics and icons.
How do I create an interactive map with the map maker?
If you share a live link to your map or embed it on a webpage, users are automatically able to hover over the different regions to access the data, creating an interactive experience. With one of Visme's integrations, you can also embed an interactive Google Maps to provide even more in-depth geographical information about a specific location.
How do I create a custom map?
Visme makes it easy to create a completely custom map. Open the map generator and select any region in the world that you want to visualize. Insert data and embed onto your website for an interactive experience.
Are Visme’s maps printable?
Absolutely! You can print off any design in Visme. Save as a high-resolution JPG, PNG or PDF and print it off using your at-home printer. You can also send it to a local printer for a larger, laminated version.
What kind of maps can I generate?
You can generate national, regional, and global maps for any country or region. Color-code each area, add legends, and turn on hover data to display values or categories.
What information should I provide for map generation?
For map generation, provide the region you want to show and the data for each area, such as values or categories. Add a legend and a color range so the map is easy to read.
What our users say about us?
“After trying tools like Canva and Adobe Spark, we picked Visme. Nothing else matched the flexibility, capabilities or ease of use.”
“Visme is Easy, clean and creative. Great way to show data to engage my teams.”
“Visme is a really powerful tool for the price. The great thing is that a non-designer can use it as well. You don't need a professional designer to create really nice graphics. It's an easy-to-use tool with good UX.”