Powerful data visualization
made simple
A single platform to make your data shine
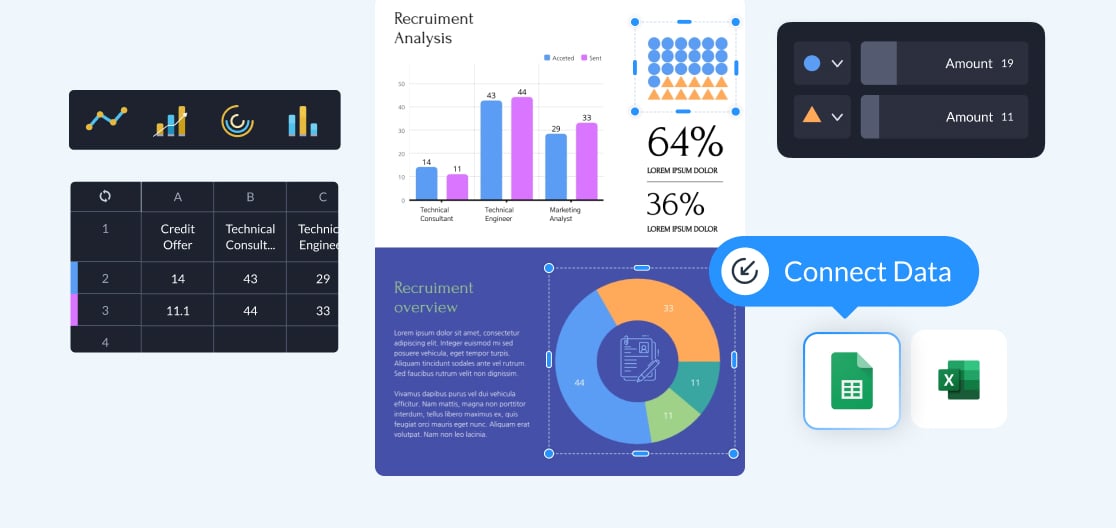
Connect to live data
Pull data from Google Sheets, Excel Online, and more.
Protect your brand
Use the Brand Wizard to pull your colors, fonts, and logos from your site onto your designs.
Work together easily
Collaborate in real-time, assign tasks easily, and get automatic notifications on replies.
Download in a variety of formats
Download as a PDF, video, GIF, SCORM, or more.
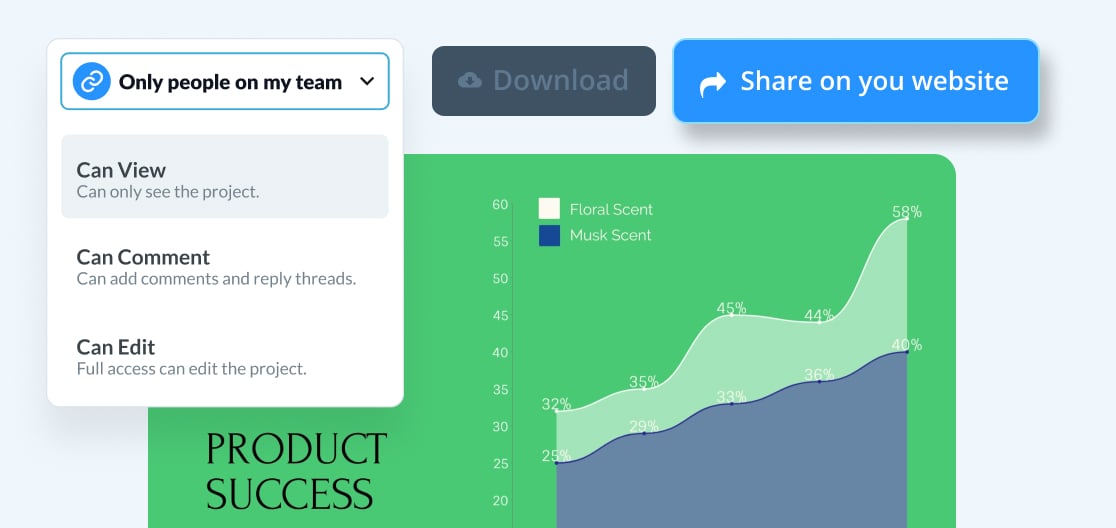
Share publicly or privately
Export, and share with ease. Add password protection to secure your data.
Analyze your results, fast
Discover unique views, average time, and more in Visme Analytics.
Achieve all of this and
more with Visme
Create interactive data
visualizations
Pull through live data and allow your audience to engage with it in a new way.
Embed data visualizations
onto your site
Build trust with every visitor or password-protect for exclusive access.
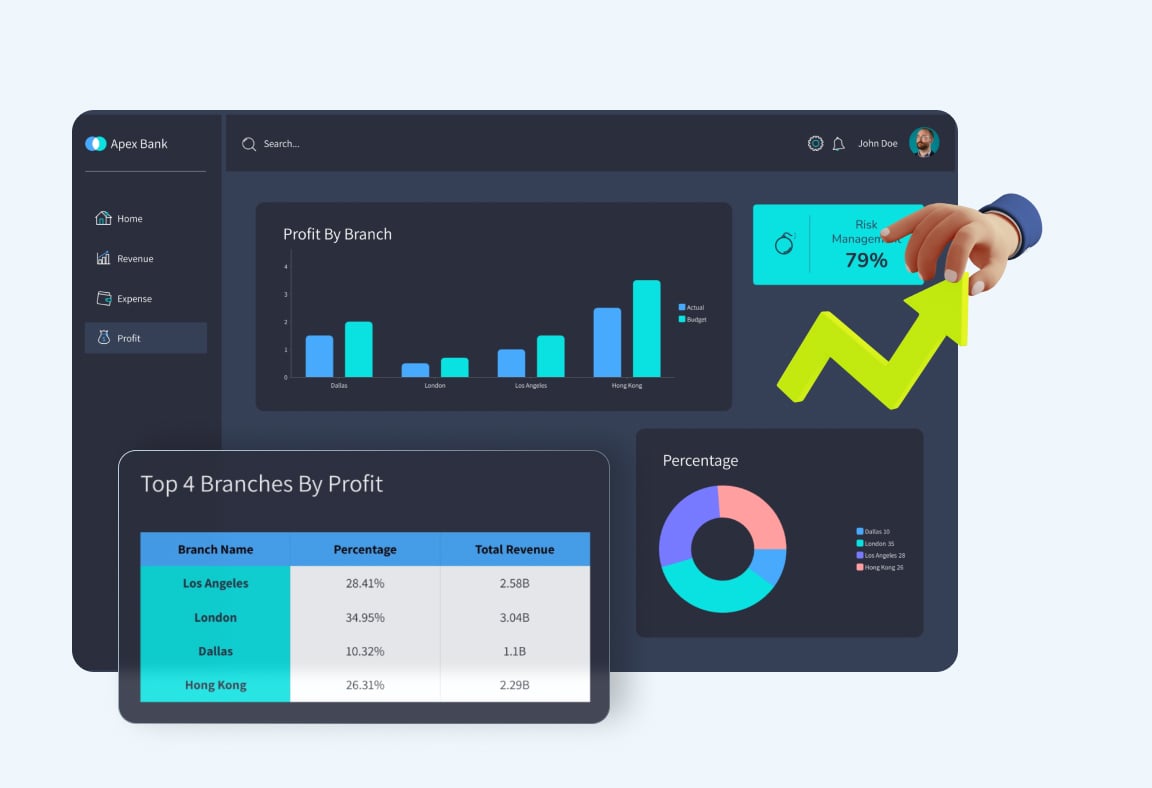
Make a dashboard
in seconds
Pull through data visualizations in other projects to create a captivating dashboard.
Create internal reports that are
more digestible
Make your whitepapers, e-books, and reports more data-rich and visually appealing.
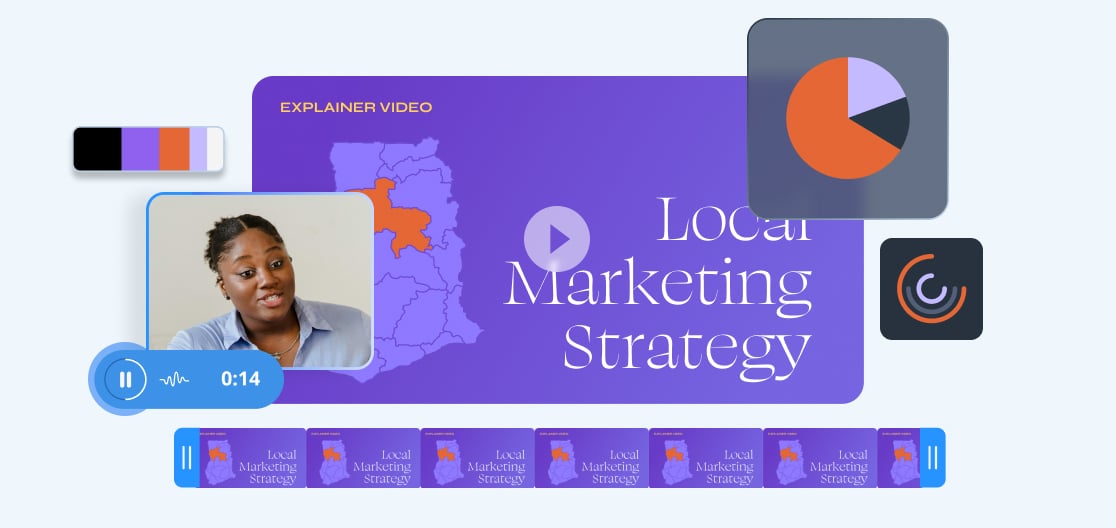
Make more memorable
explainer videos
Use high-quality data visualizations to explain complex concepts and keep viewers engaged.
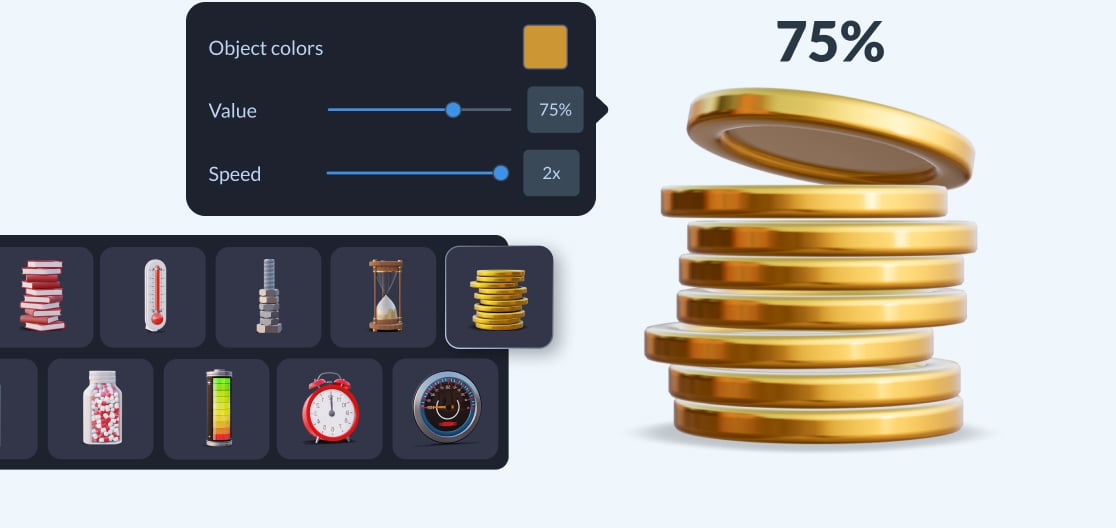
Stock library
Access free photos, videos, 3D assets, and more.
AI tools
Get help and inspiration while you create.
Template library
Access thousands of templates to kickstart your design.
Scaled Updates
Update key visuals and text from a single place with Dynamic Fields.
Cloud Storage
Your business data is always protected and you can access Visme from any device at any time.
Frequently Asked Questions (FAQs)
Data visualizations can be used any time you need to communicate complex information in a visual, engaging way. You can create them to grab your audiences’ attention in explainer videos, for example, or to bring your team together in internal reports.
Good data visualization presents data in a way that is most easy to understand and often tells a story while doing so. Data visualization platforms like Visme help you structure information in the clearest and most compelling way without effort. You can create design-first charts, infographics, maps, and more.
Data visualization software is a term for tools that transform raw data into visual formats such as charts, graphs, and maps. You can pick the right tool for data visualization by assessing how easy it is to create at scale without losing quality (Hint: With templates, live data sync, and brand controls, Visme is great for this).
Data visualization tools are software that turn raw data into charts, graphs, maps, and dashboards. They help people spot patterns and share insights faster than reading numbers in a table.
Top AI tools for data visualization include Tableau, Power BI, Google Looker Studio, and Visme. These platforms use AI to analyze data, surface trends, and build charts or dashboards faster. Tableau and Power BI focus on advanced analytics and business intelligence, Google Looker Studio is common for marketing and performance reporting, and Visme suits visual reports, presentations, infographics, and interactive dashboards.