Free Bar Graph Maker for Beautiful Bar Graphs

- Customize the data labels of your different bars.
- Create bar charts and other chart types in minutes.
- Save your bar chart as a content block to add to an existing project.

Chosen by brands large and small
Our bar graph maker is used by over 34,300,000 marketers, communicators, executives and educators from over 133 countries that include:
EASY TO EDIT
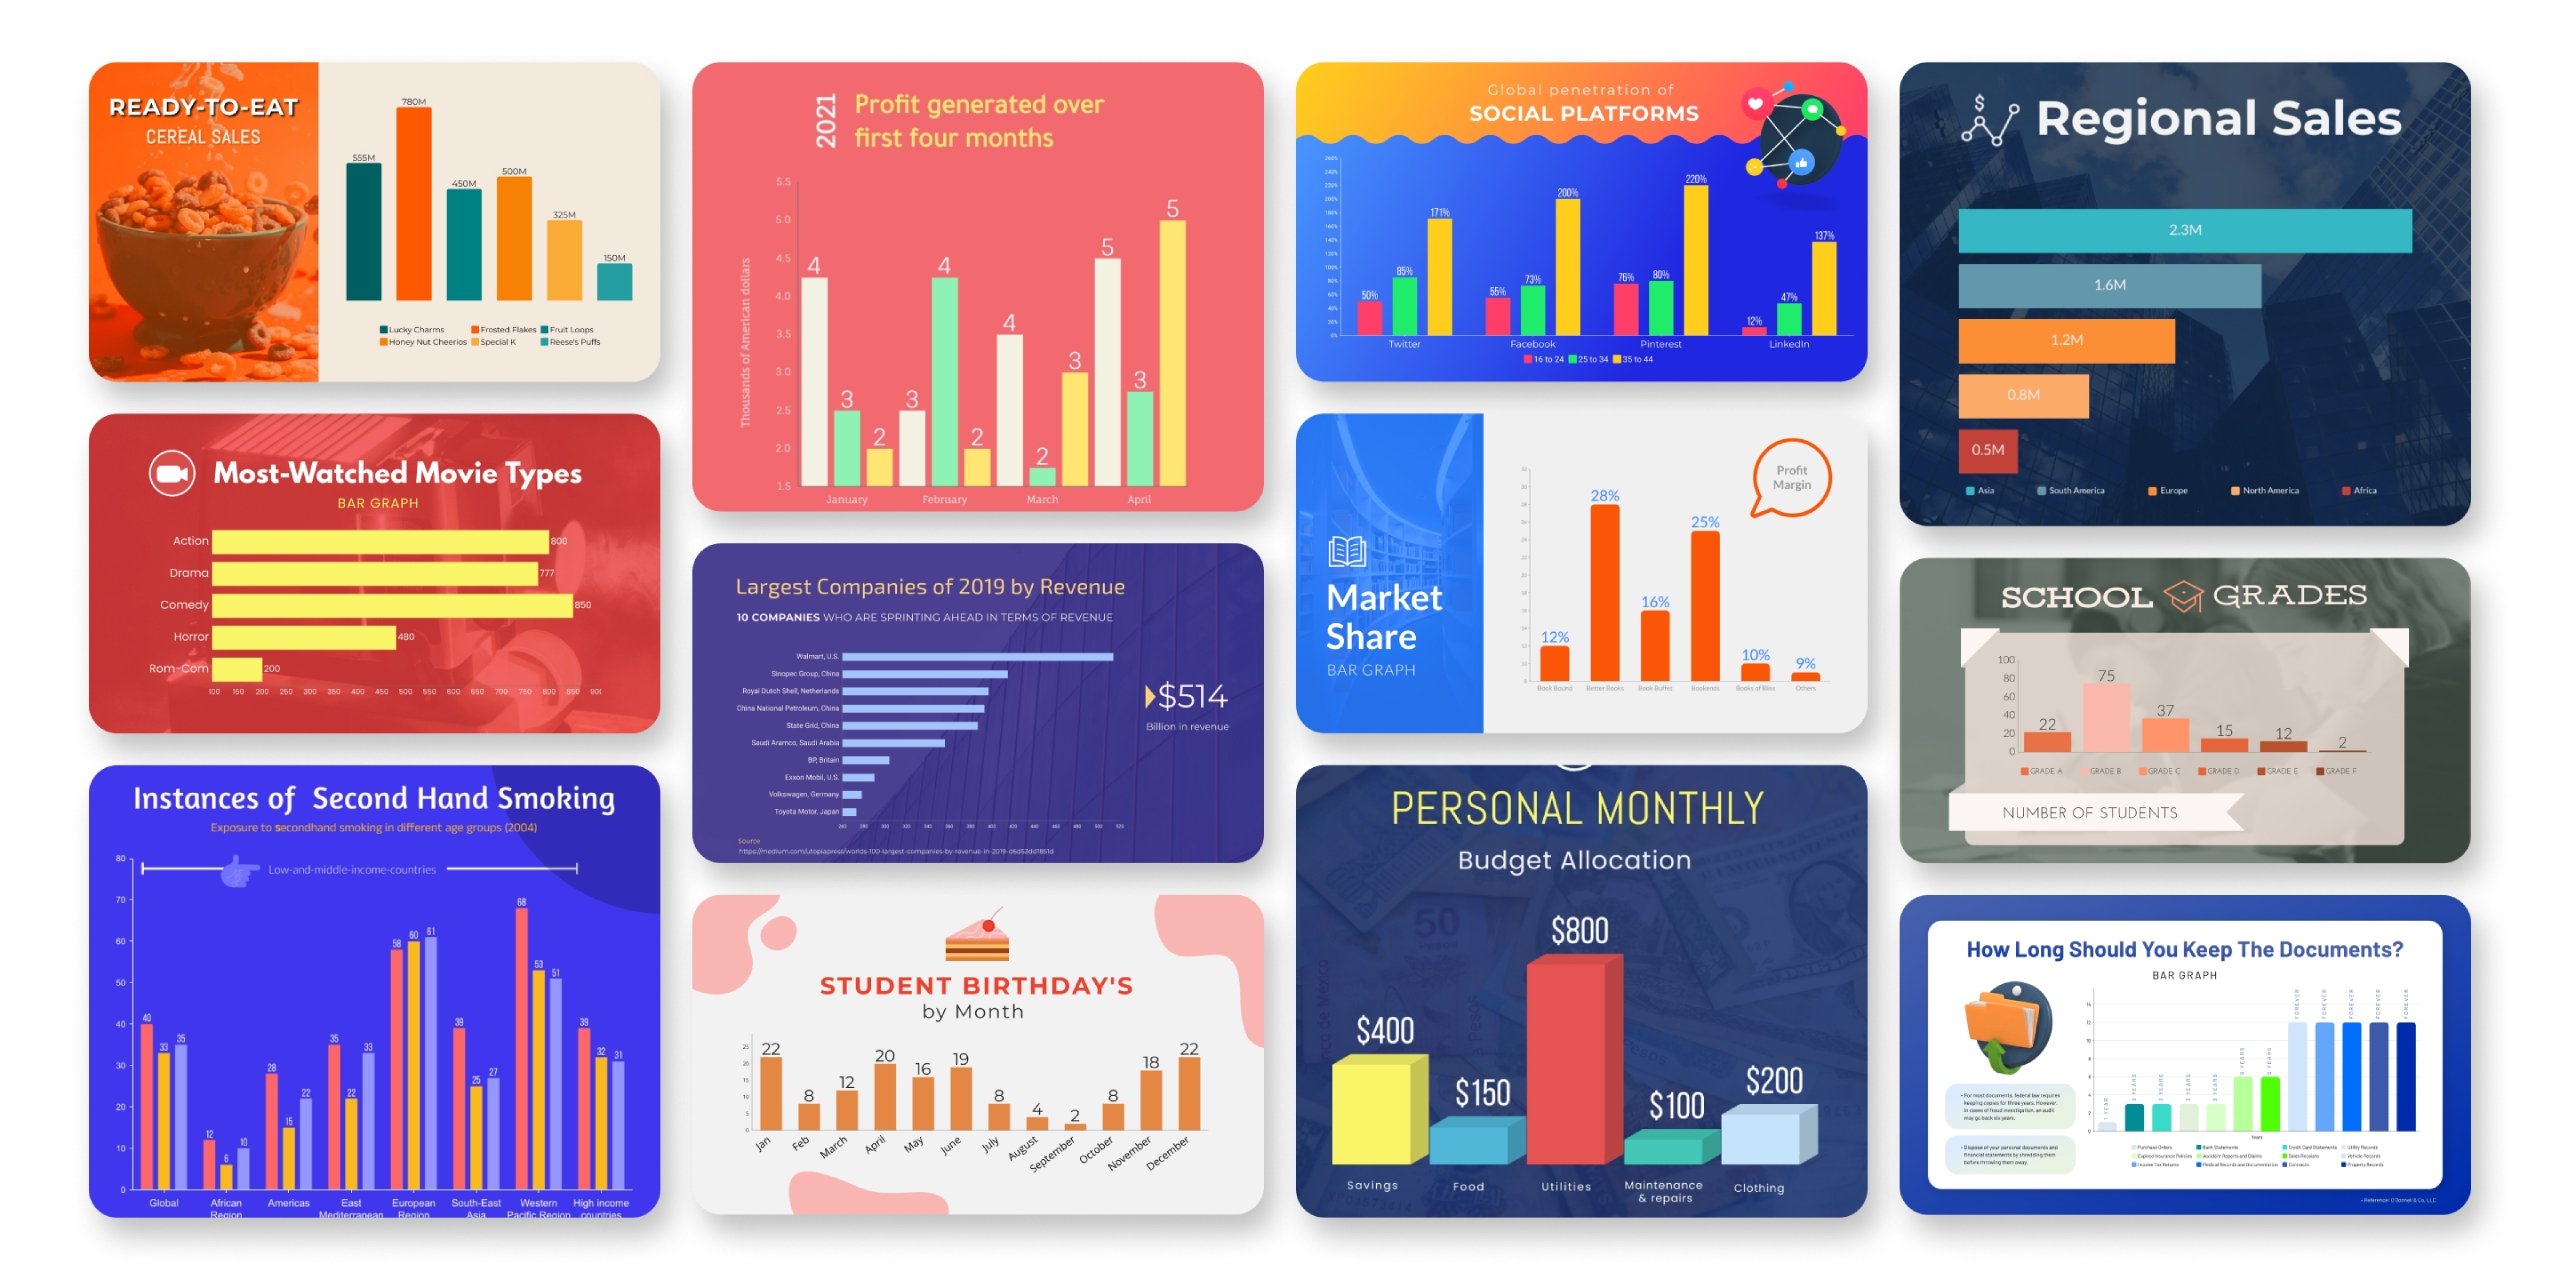
Bar Graph Templates
Don’t worry about creating your own bar chart online. Instead, choose from one of our pre-designed templates and simply plug your data in. Visme’s bar graph builder takes the stress out of data visualization, giving you the freedom to customize your template as much or as little as you choose.
Features of the Bar Graph Maker
Beautiful bar graph templates
Find beautifully designed bar chart templates with real life data to help jumpstart your design. Simply edit the bar chart to add in your own data, color code to match your brand or your topic, update axis titles and legends, and download.

Build your bar chart
Create online bar charts with Visme’s easy-to-use online Graph Engine. Create a double bar graph, a stacked bar graph or a classic bar graph by inputting your data and customizing your chart design.

Customize every aspect of your bar graph to match your brand
You can easily customize the colors, fonts and backgrounds with Visme's bar chart builder. Choose how the values are shown and where the legend will be placed. Decide if your graph will have hover-over labels and animation. You can even upload background images and apply color overlays to your final design.

More Great Features of the Bar Graph Maker
-
Fully customizable premade bar chart templates to choose from
-
Millions of stock photos and icons to spice up your design
-
Add in your own branded fonts and colors to make it your own
-
Easy drag-and-drop design tools, made with the non-designer in mind
-
Create a vertical or horizontal bar graph, or a single or stacked bar graph
-
Download as an image file or add to an existing project
Share Your Bar Graph
Once you make a bar graph inside Visme, it's easy to share it no matter where your audience is. Insert the finished bar chart into any piece of content, like a presentation, infographic or report. You can easily download as an image file to share on social media or embed a live and interactive chart onto your website or blog.

LEARN ABOUT BAR GRAPHS
What is a Bar Graph?
A bar graph or bar chart is a type of data visualization that showcases the amount of different variables in a data set by letting us visualize the height or length of each bar. The more a variable has, the higher or longer its bar.
Bar charts are one of the most versatile types of data visualizations, and can work for a number of different types of data. Showcase percentages, large numbers, small numbers and more.

Use the bar graph maker to visualize categories of data.
Pick one of the horizontal or vertical bar graphs, either flat or 3D. Enter your x-axis and y-axis data manually or import into the bar chart maker via an Excel sheet or Google spreadsheet. You can create single, double or stacked bar charts. Categorize and color code your data using up to 50 columns. Make a graph that's easy to understand in minutes.
EVERYTHING YOU NEED + MORE
More Than a Bar Chart Maker
Visme’s bar graph designer makes it easier than ever to create a bar graph online that helps to visually demonstrate your data and statistics. Our brains love visuals, so why not use a chart to share information instead of just the numbers?
VISUALIZE YOUR DATA
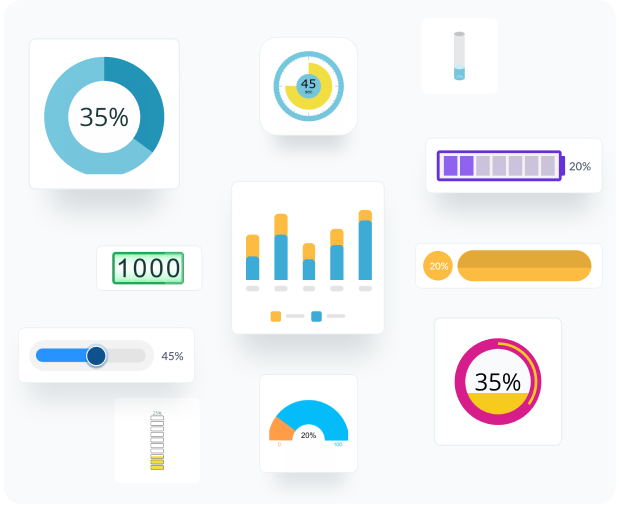
Charts & Graphs
Choose from different chart types and create pie charts, bar charts, donut charts, doughnut charts, pyramid charts, Mekko charts, radar charts and much more.
MAKE IT ENGAGING
Interactivity
All of Visme’s charts give you the option to add hover-over legends that give your audience more information and make your charts engaging.
BEAUTIFY YOUR CONTENT
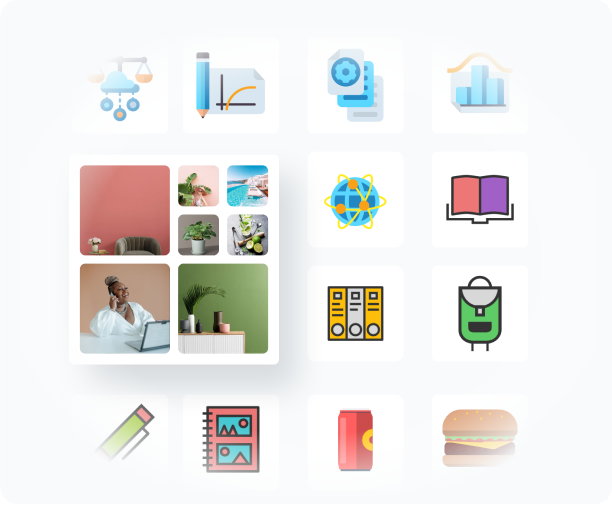
Images & Graphics
Choose from over a million stock photos, icons, illustrations, characters, lines, shapes and more to decorate your bar graph and make it engaging.
HOW IT WORKS
How to Make Bar Graphs in 5 Steps
The Visme bar graph maker allows you to create beautifully animated and static bar charts, bar plots and other graph types in minutes. It provides you with both vertical and horizontal bar graphs in flat and 3D designs. Quickly and easily customize any aspect of your chart. Use one of our bar chart templates or import live data and color code the bars.
Watch our quick tutorial video and follow our five-step process below to create your own bar chart within minutes. Click the blue button below to get started.
- Log in to Visme and open a new project in the dashboard. Choose an infographic, presentation or blank canvas.
- To use the bar chart maker, click on the data icon in the menu on the left then click the icon of two charts.
- Choose the bar chart option and add your data to the bar chart maker, either by hand or by importing an Excel or Google sheet.
- Customize colors, fonts, backgrounds and more inside the Settings tab of the Graph Engine.
- Easily share your professional graph design by downloading, embedding or adding to another project.
QUICK TIPS
How to Use the Bar Graph Maker
When getting started with the bar chart creator, first decide on the vision for your graph.
Before you create your chart with the bar graph designer, have all your data values ready to input.
Find the type of graph that best fits your vision. There are flat style options as well as 3D bar graphs. You can also choose from vertical or horizontal graphs or even a stacked bar chart.
The online bar chart maker already has some premade templates to help you create your own. If these don’t help, you can start from scratch.
Update the fonts in your customized bar chart to fit your brand style guide. If not creating the graph for your brand, choose the fonts to fit the design you are working on.
Color code the bars to fit your style guide. You can also customize the colors of the axis lines and the background.
Customize the animation setting to add extra emphasis to your data. There are four animation options to choose from.
Download your bar graph in an image or PDF file. Embed onto your website or blog to keep the animation and interactivity. Add into other projects to show off your data.
Questions About the Bar Graph Maker
How much does it cost to create a bar graph with the bar graph maker?
Creating a bar graph with Visme is completely free. If you want to download as a high-resolution PDF or interactive HTML, you can upgrade to a Standard plan.
How do you create a bar graph?
It's so easy to make a bar graph with a graph maker like Visme. Simply paste your data into the chart engine or upload an Excel or Google Sheets spreadsheet and watch your bar graph populate on screen.
What are the types of bar graphs?
There are several types of bar graphs, all of which can be created inside Visme. You can make both vertical and horizontal bar graphs. You can also choose from a flat design or a 3D style. You can even create stacked bar graphs or double bar graphs.
What are the different categories of graphs?
There are so many different chart and graph categories. Create line graphs, pie charts, scatter plots, histograms, pictograms, maps, radar charts, gauges, area charts and more.
How much data can I add into a bar graph?
You can add up to 40 units of data on the x axis and 50 on the y axis. You can also import live data from Google Sheets.
What is the best bar graph maker?
While there are a variety of chart makers available to you, we think Visme is the best bar graph maker. This is because you can animate charts, color code easily, create a variety of chart types, import your brand colors and so much more. Find tutorials on how to create different charts in our video library.
What are the uses of bar graphs?
Bar graphs are used to compare categories, track changes over time, visualize survey results, display performance metrics, and simplify data so trends and differences are easy to understand.
What is the difference between a bar chart and a histogram?
A bar chart compares distinct categories, while a histogram shows how numerical data is distributed across ranges or intervals. Bar charts use separated bars; histograms use touching bars because the data is continuous.