Bubble Chart Templates
Dive into data visualization with Visme's Bubble Chart Maker. Bubble charts help you display three dimensions of data on a two-dimensional plot, making complex datasets comprehensible and engaging. Perfect for comparing clusters of data, such as market trends, demographic information, or social research findings. Simply pick a template, input your data, and let your insights bubble up to the surface.

Bubble Charts 22

Injury Impact Bubble Chart
Visualize the injury impact on a set of athletes using this bubble chart template.

Employee Turnover Bubble Chart
Measure employee turnover in your organization with this bubble chart template.

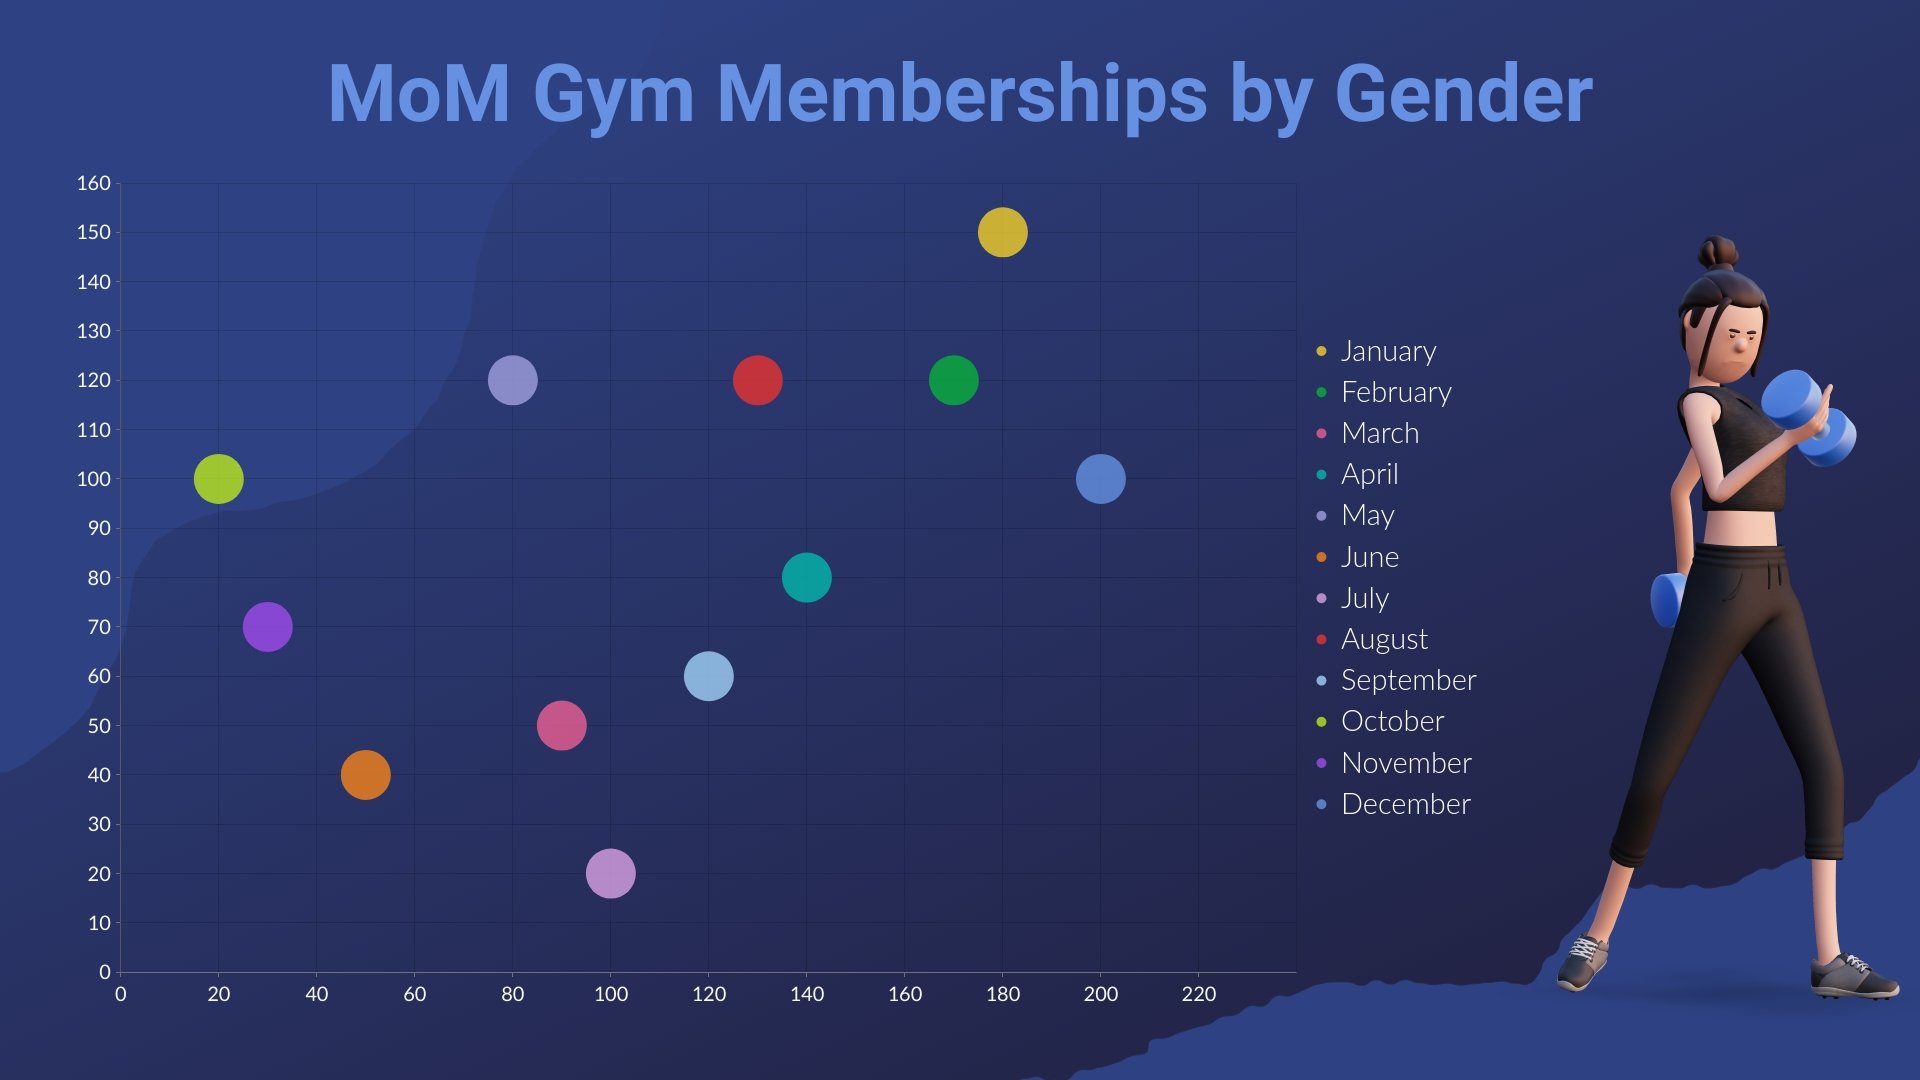
Customer Demographic Bubble Chart
Visualize and compare your customer demographics between males and females using this bubble chart template.

Educational Bubble Chart
Visually display educational data in this interactive bubble chart template.

Ad Performance Bubble Chart
Visually depict three variables of ad performance using this bubble chart template.

Ecommerce Revenue Bubble Chart
Visualize ecommerce revenue for your company using this bubble chart template.

Monthly Sales Prospect Bubble Chart
Compare different aspects of your monthly sales prospects using this bubble chart template.

EdTech Startup Funding Bubble Chart
Plot EdTech startup funding data with three variables using this bubble chart template.
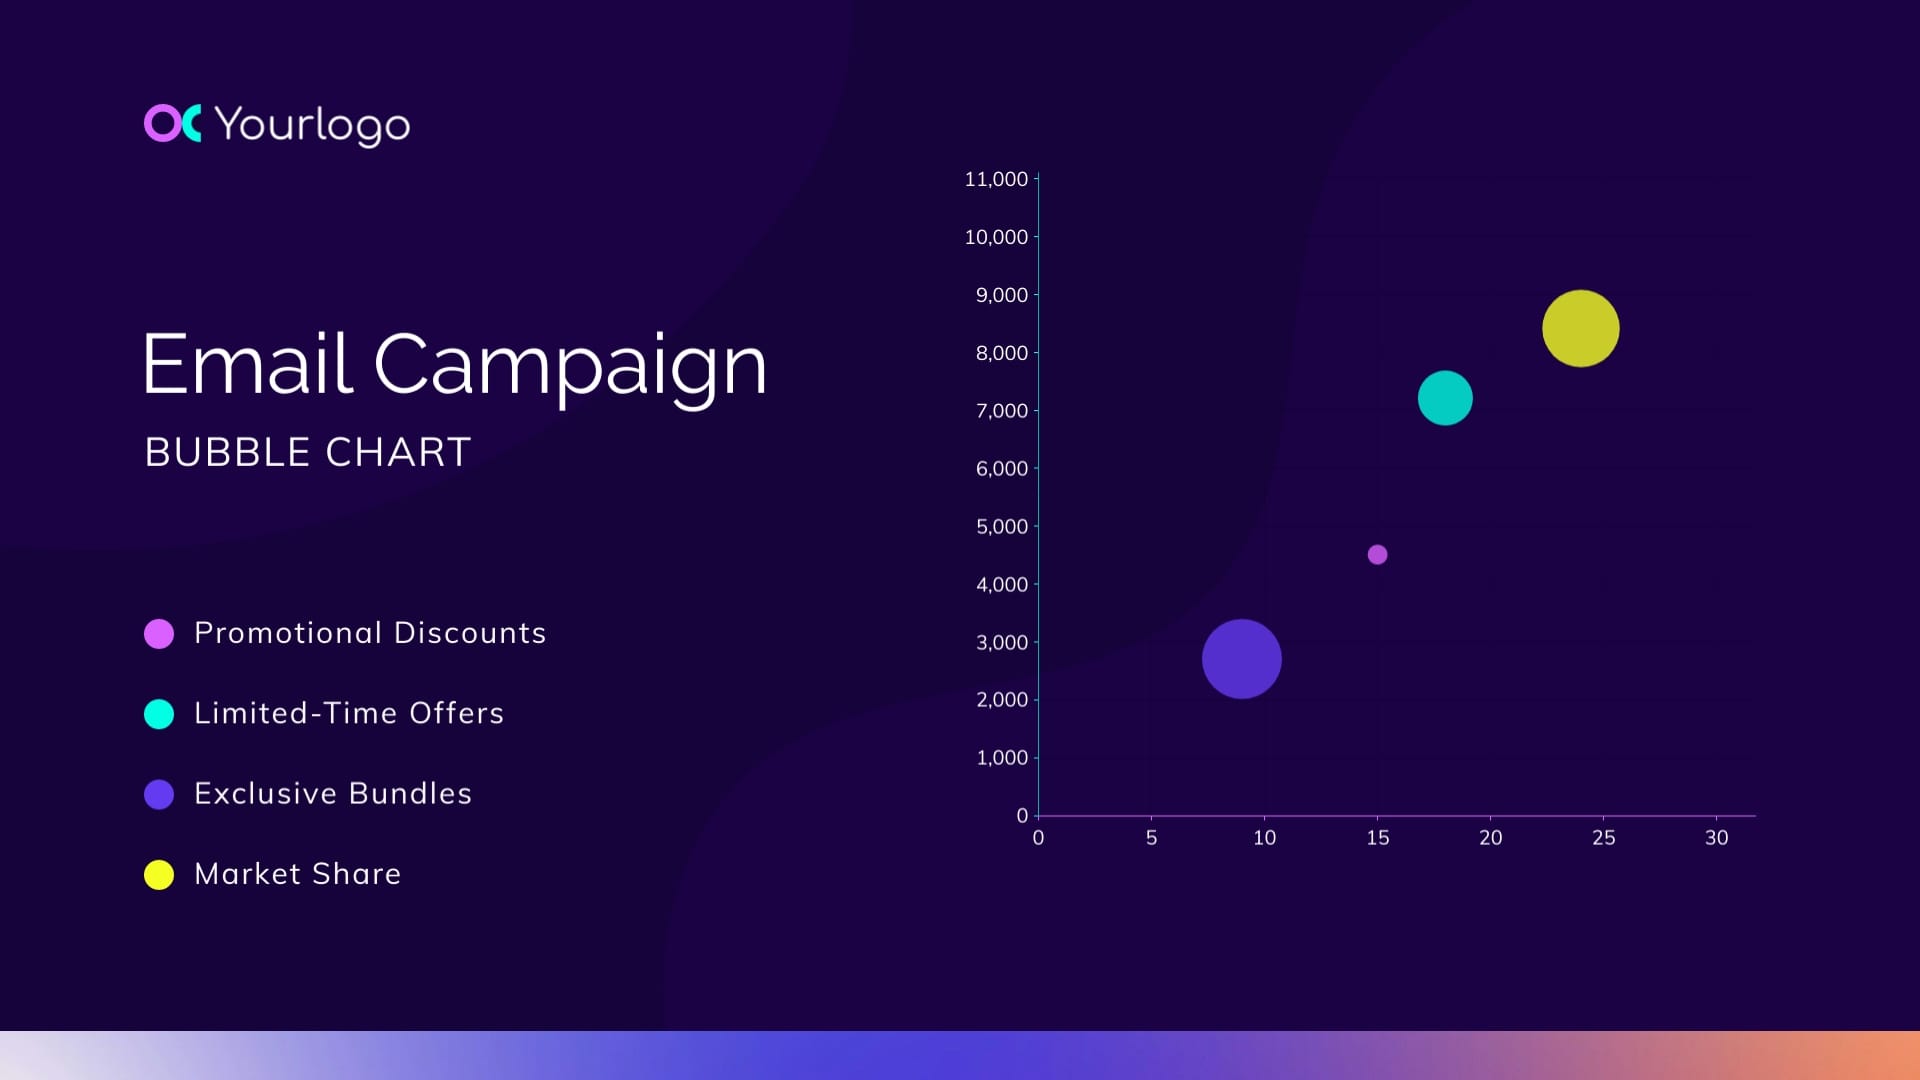
Email Campaign Bubble Chart
Share data about your email campaign with this customizable bubble chart template.
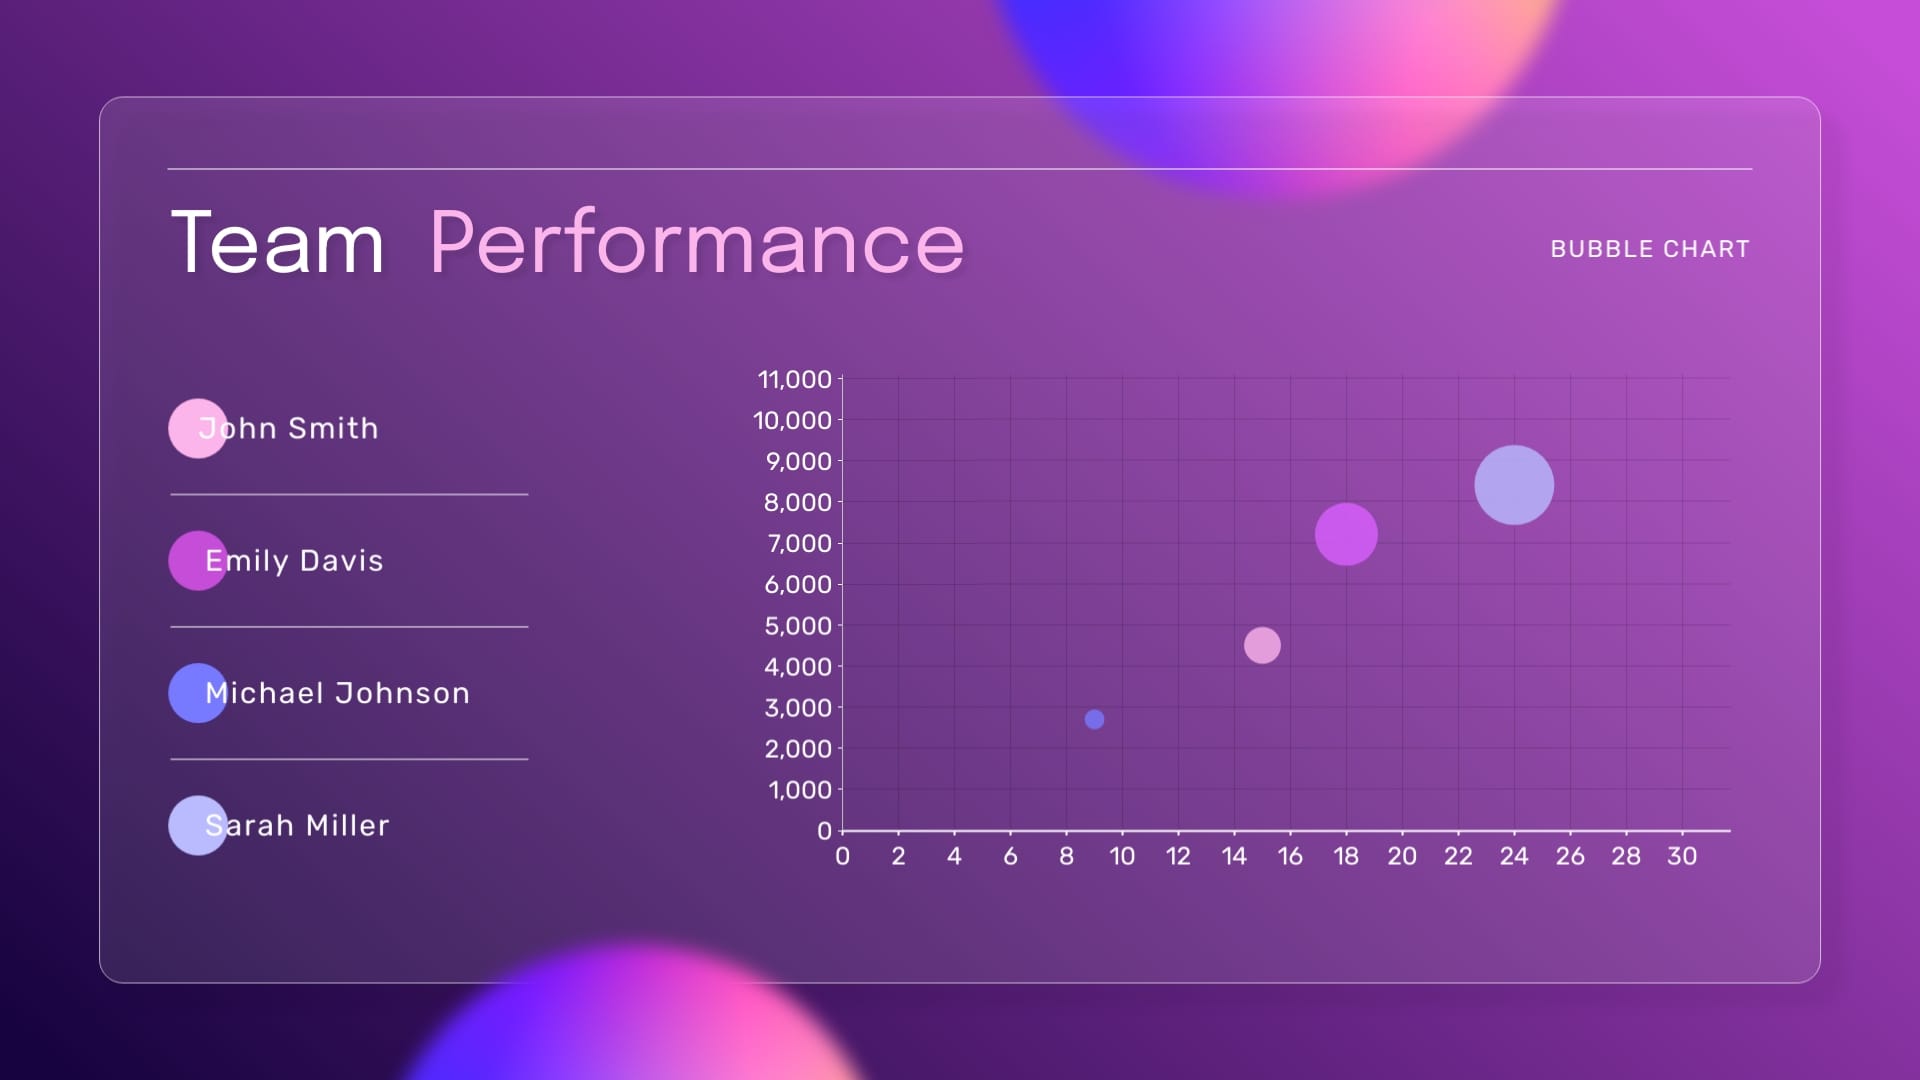
Team Performance Bubble Chart
Visually analyze team performance with this beautiful bubble chart template.
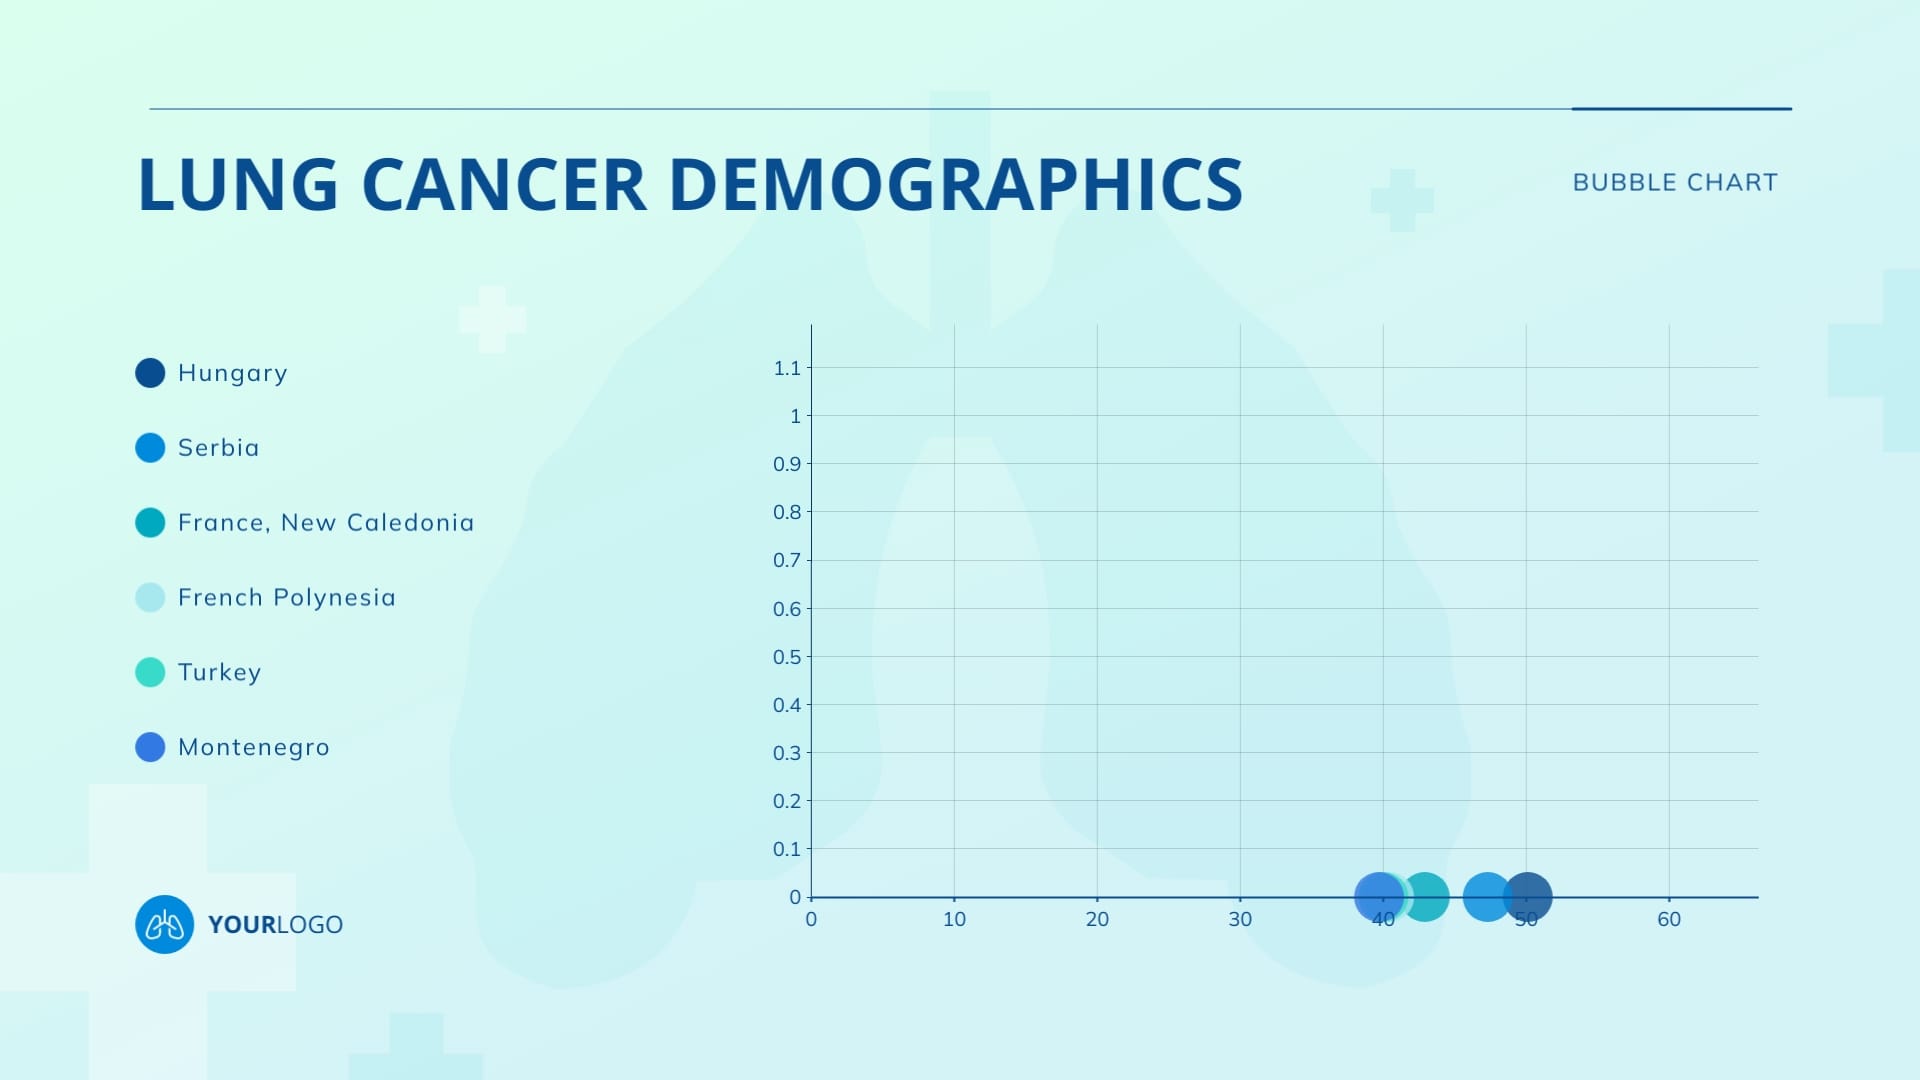
Lung Cancer Demographics Bubble Chart
Share lung cancer demographics data with this customizable bubble chart template.
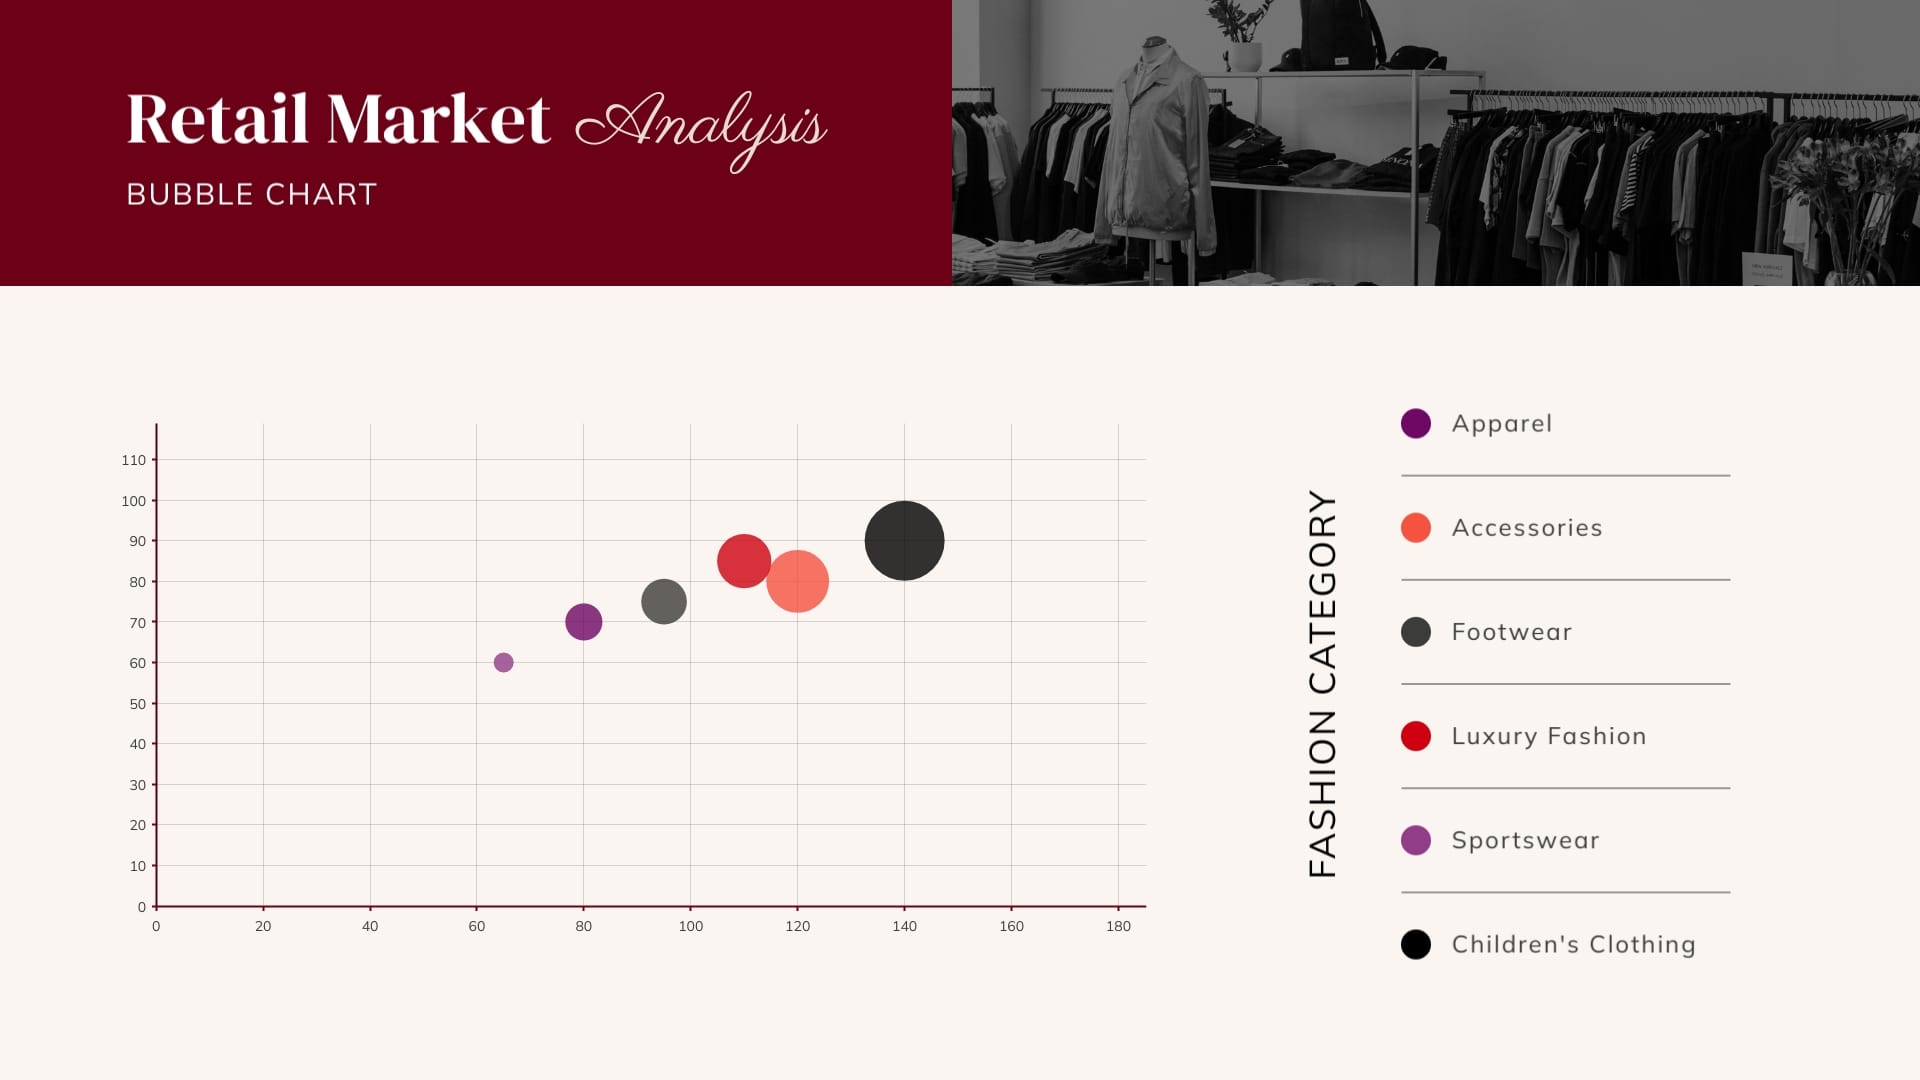
Retail Market Analysis Bubble Chart
Analyze the retail market for your business strategies using this bubble chart template.

App Rating Bubble Chart
Use this customizable bubble chart template to compare a group of apps and rate them visually.
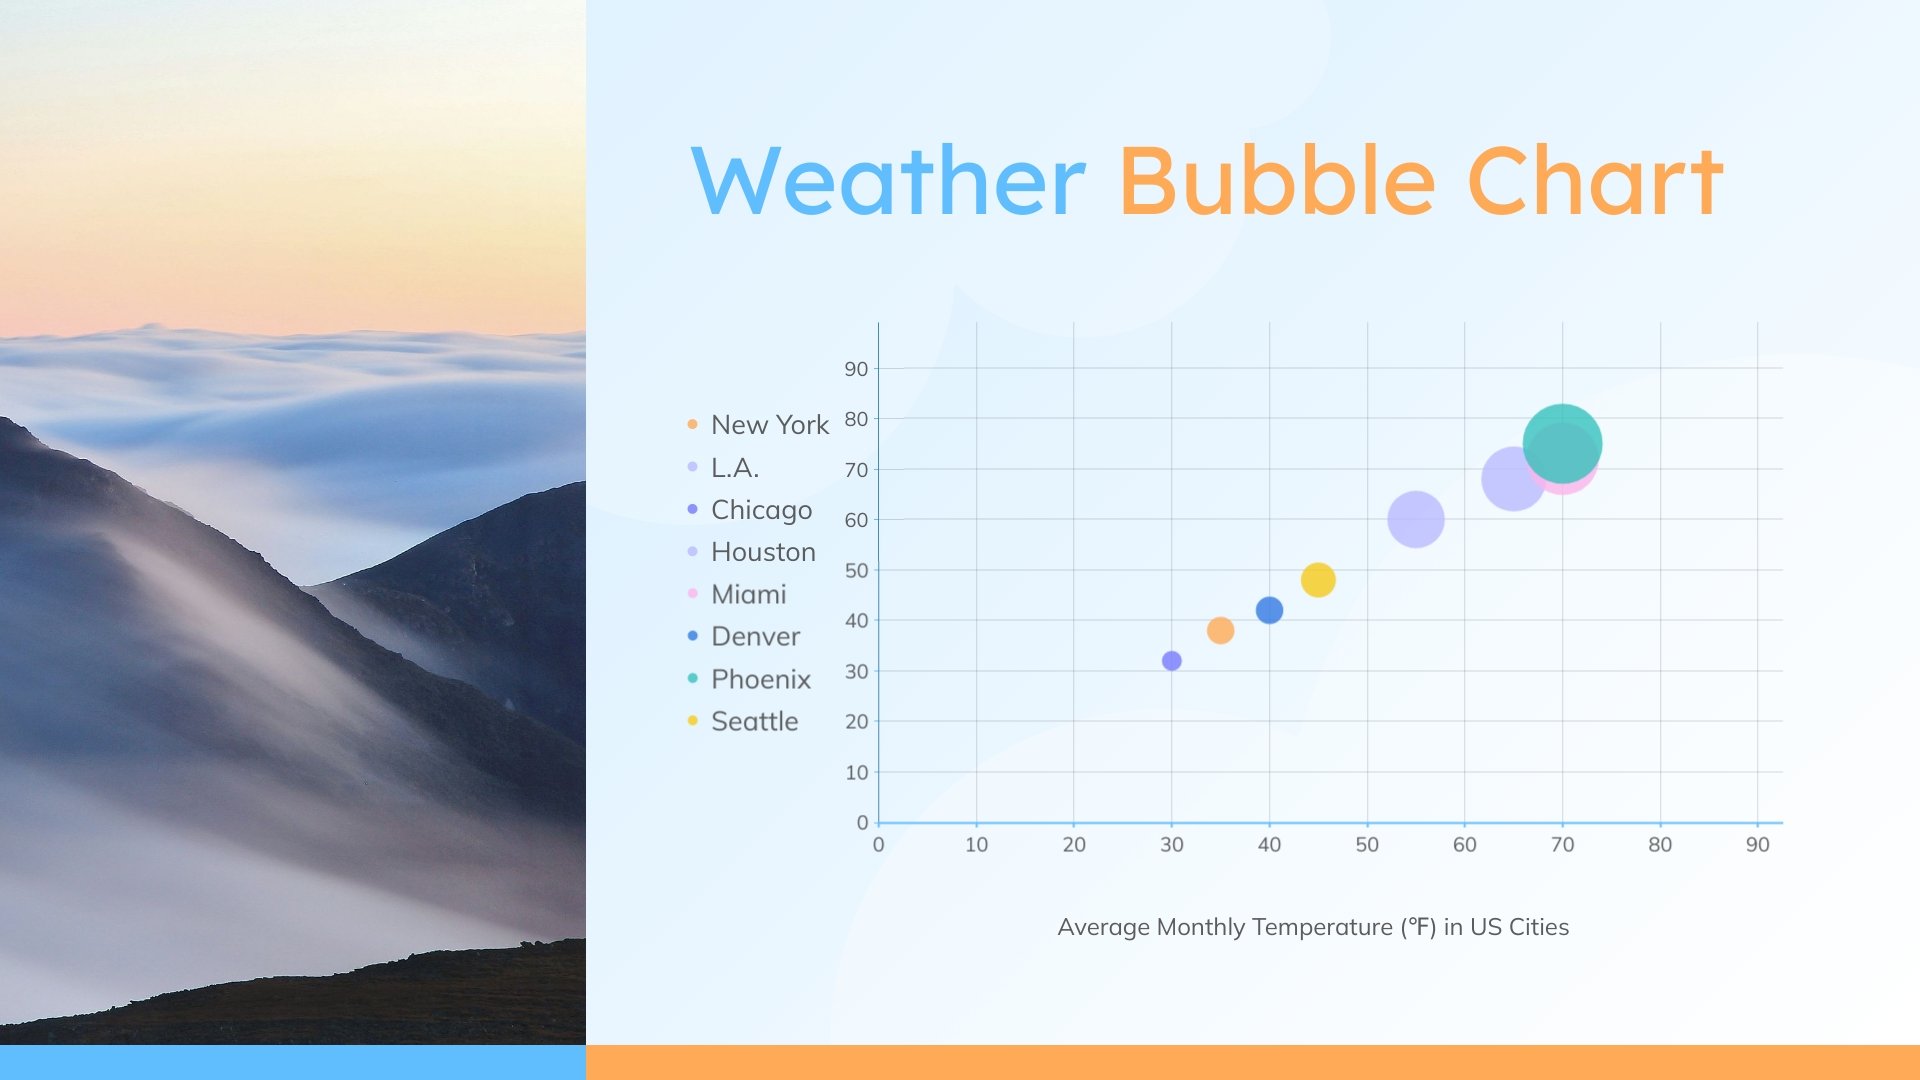
Weather Bubble Chart
Visualize the average monthly temperature in US cities with this rectangular bubble chart template from Visme.
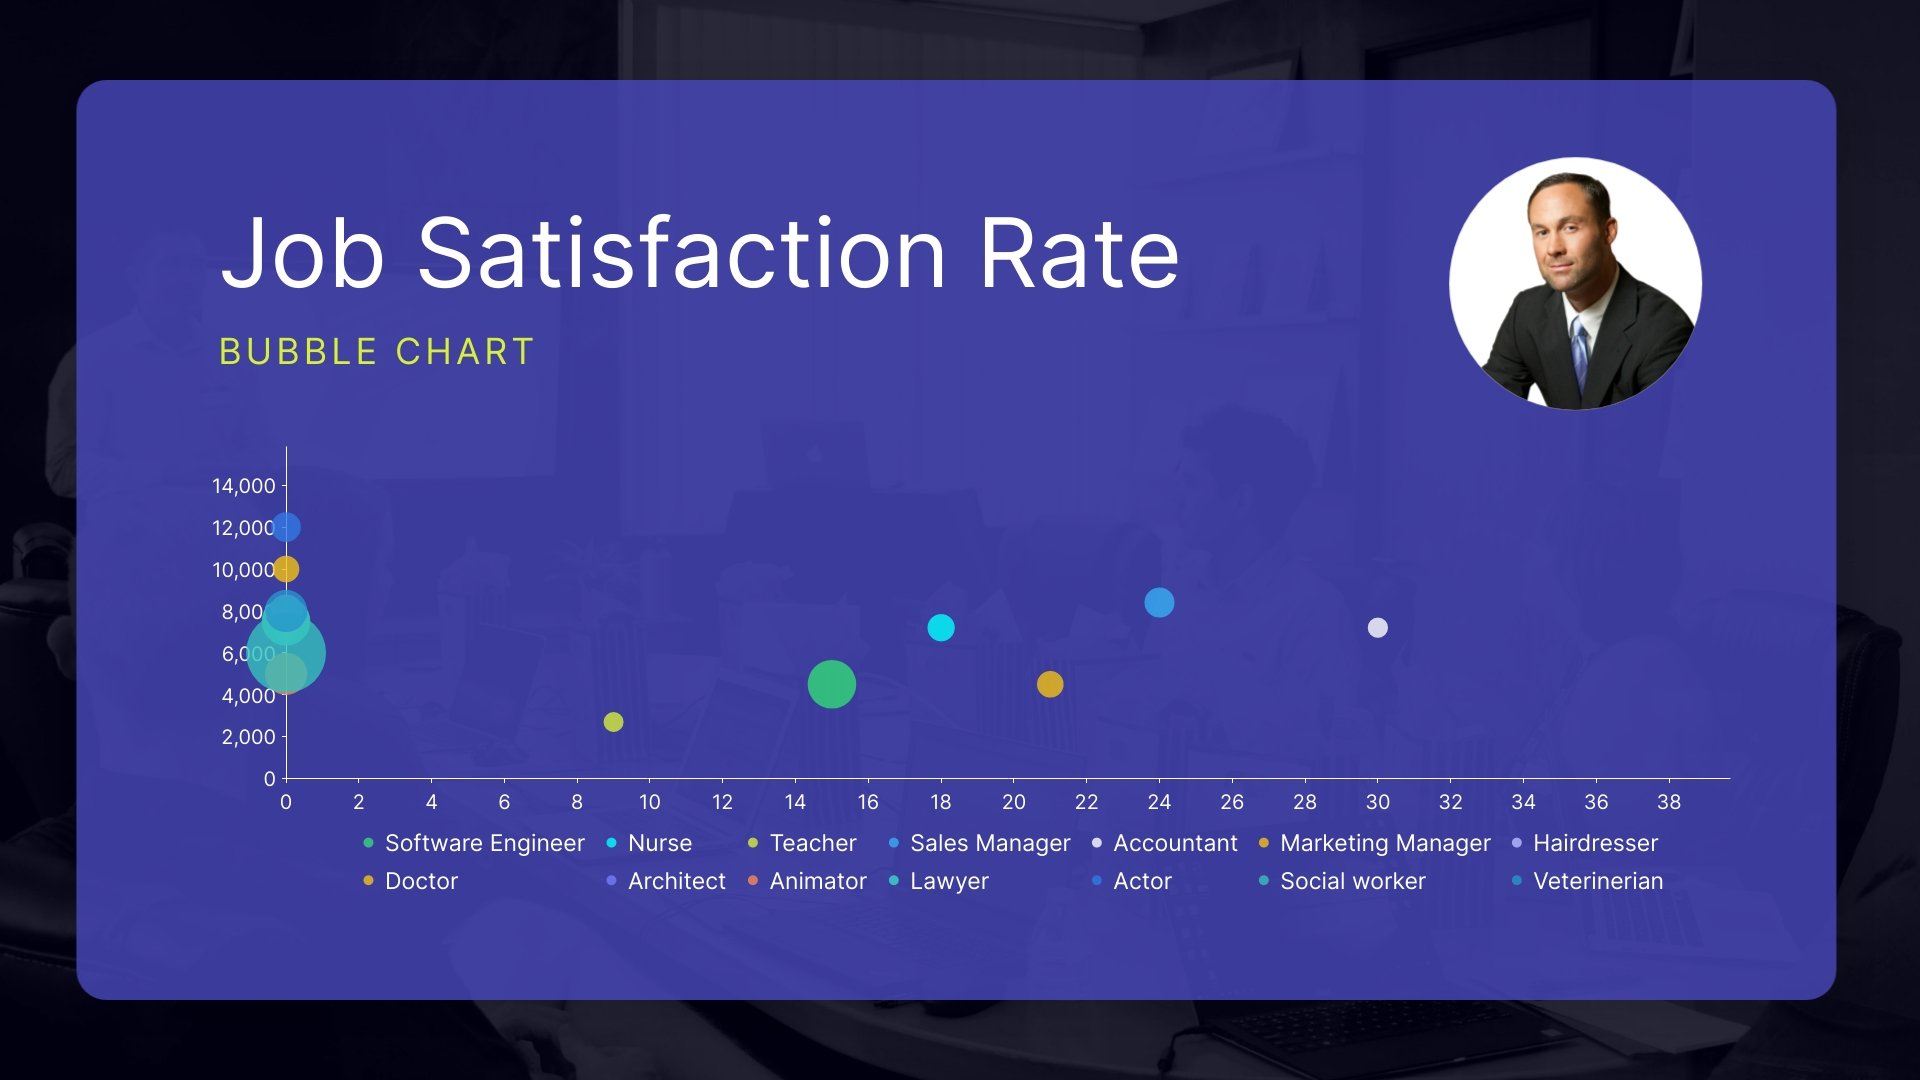
Job Satisfaction Rate Bubble Chart
Personalize this bubble chart template using Visme’s chart editor to visualize the job satisfaction rate of different careers.
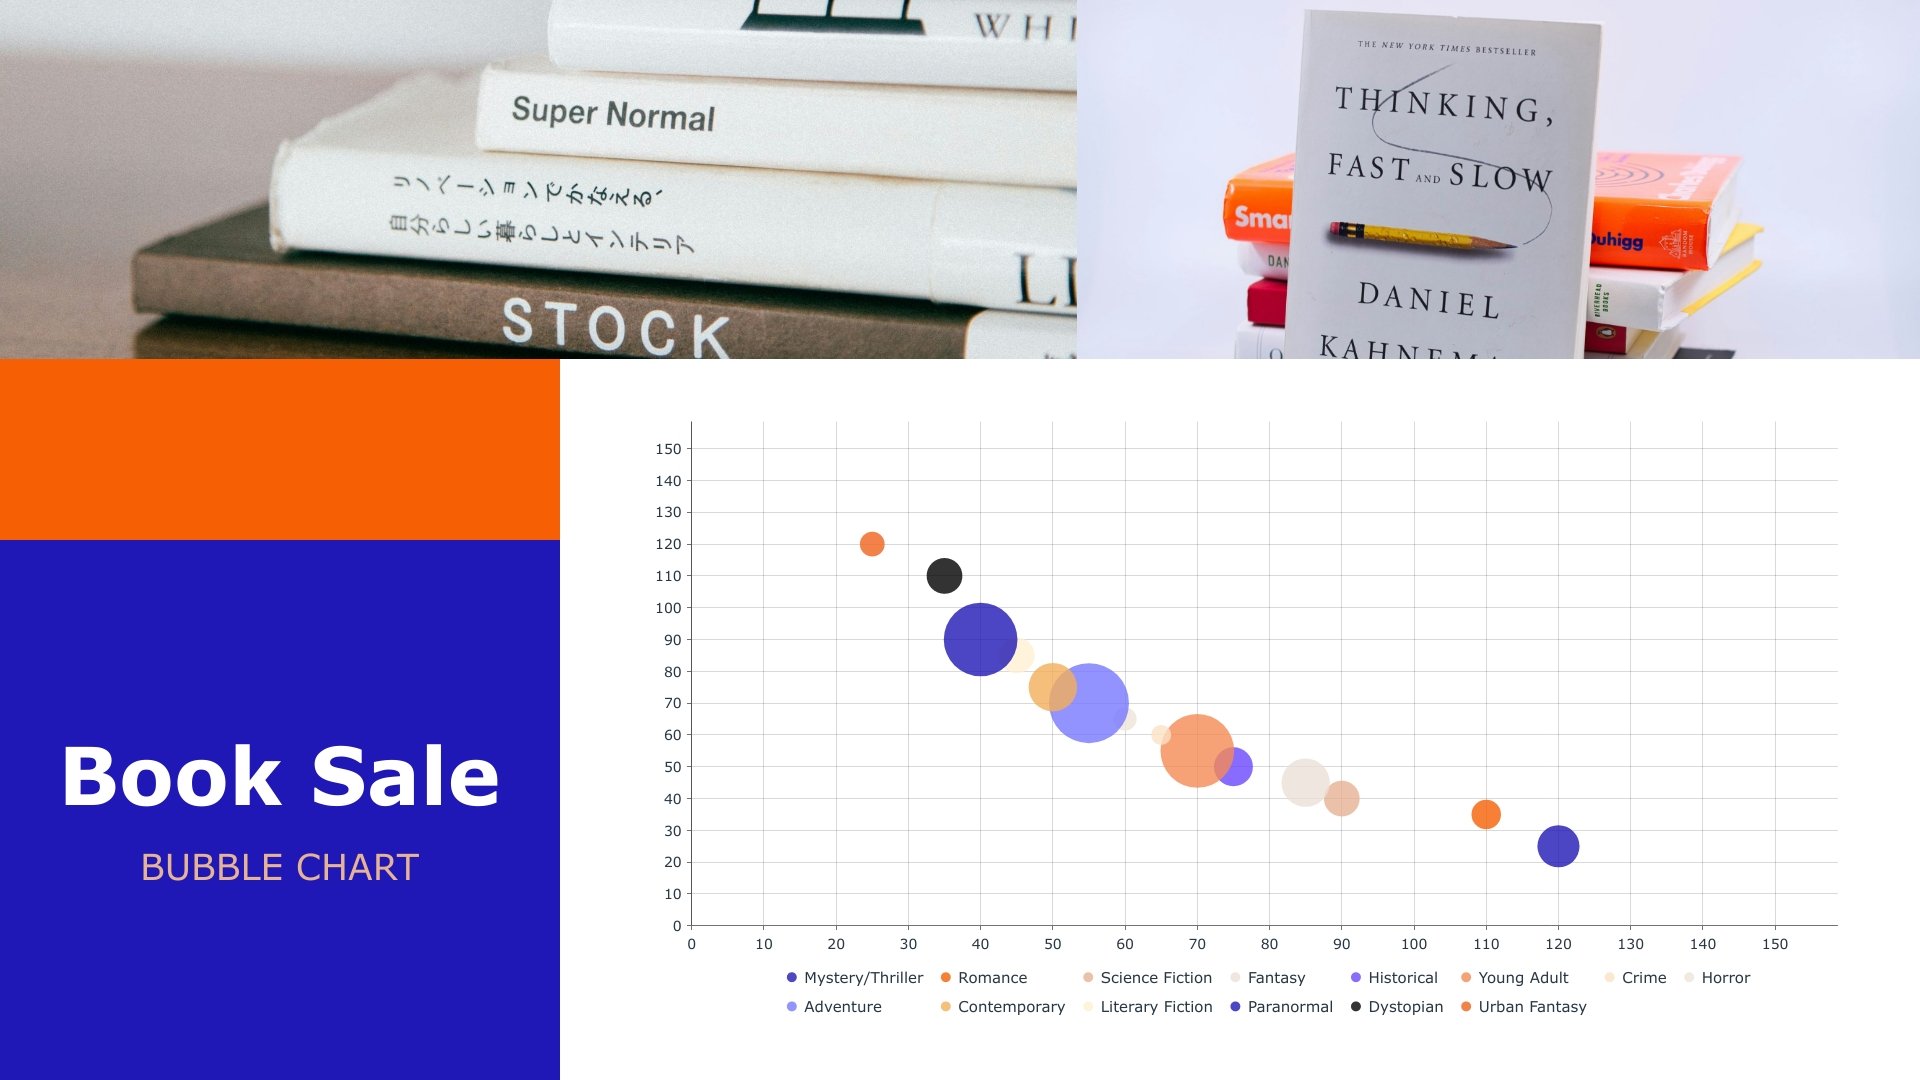
Book Sale Bubble Chart
Visually analyze book sales by type using this customizable bubble chart with Visme’s editor.
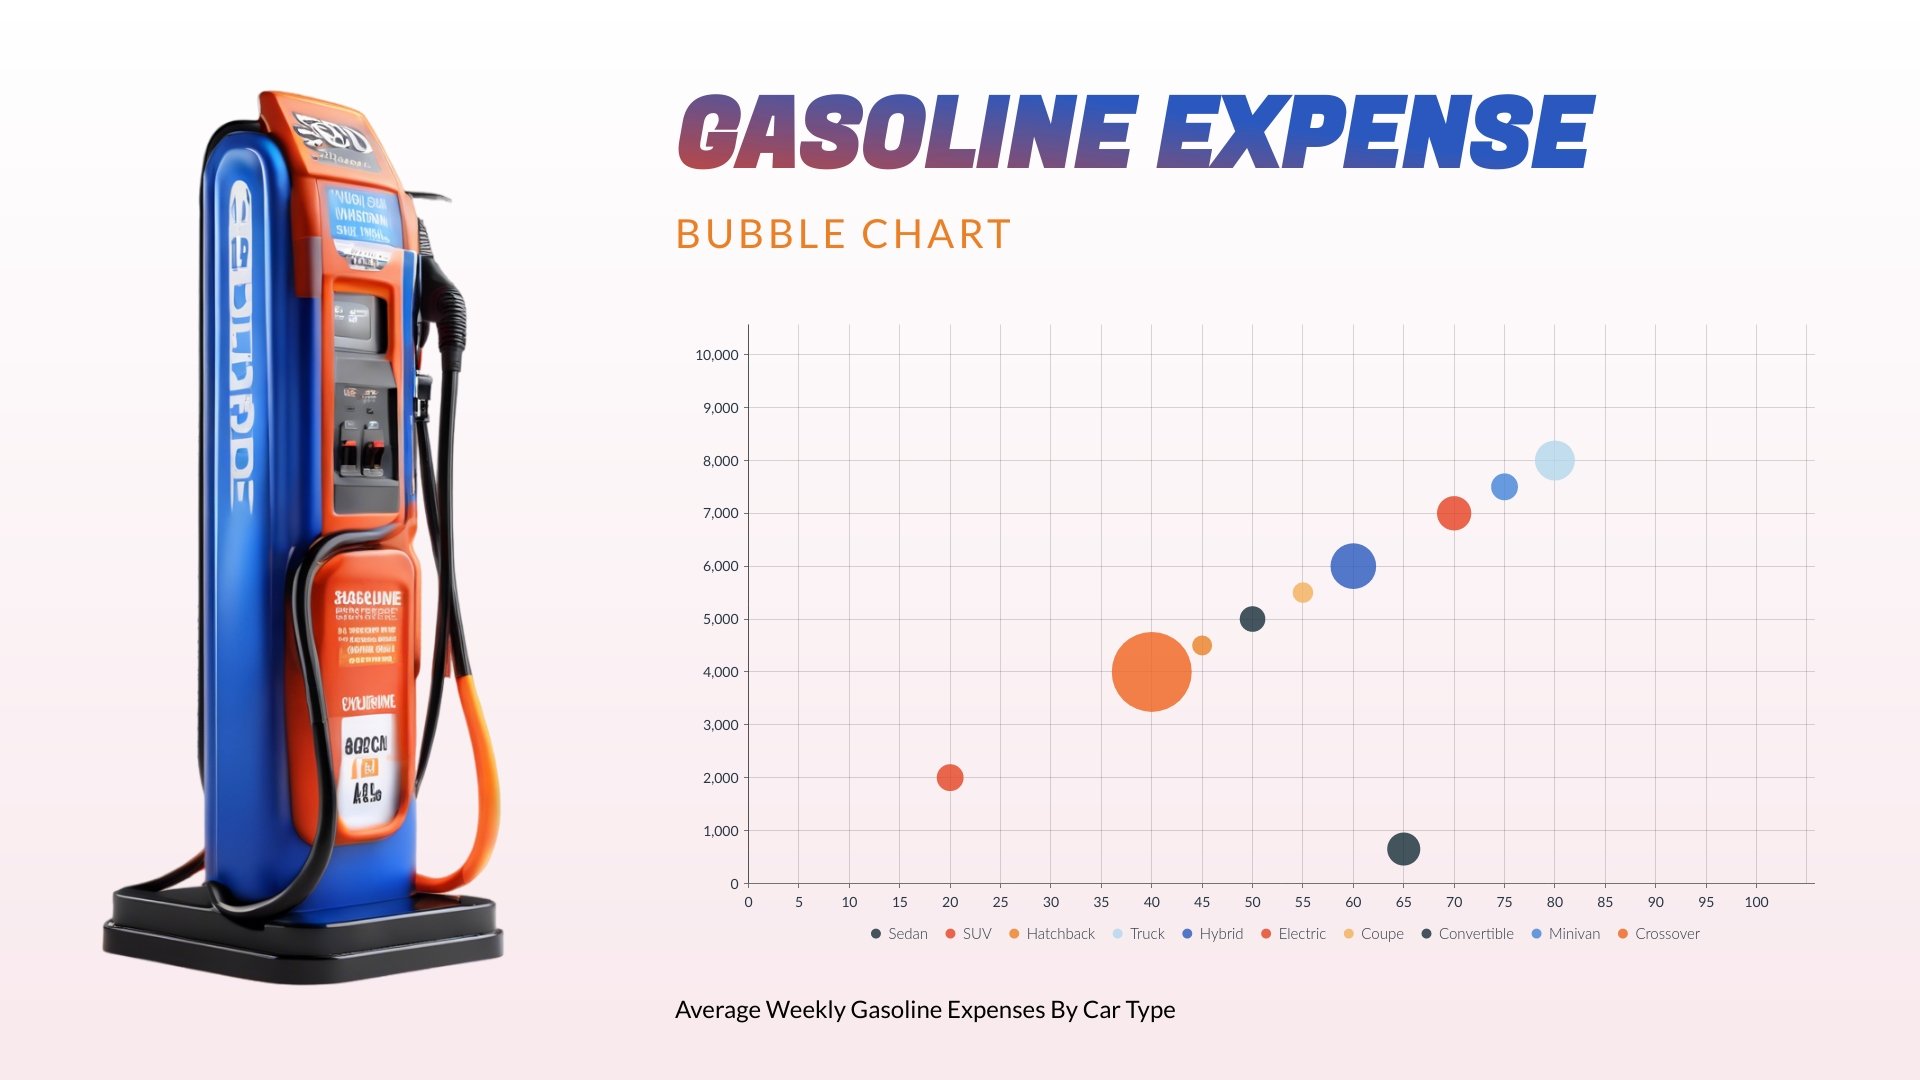
Gasoline Expense Bubble Chart
Visualize the average weekly gasoline expenses by car type using this bubble chart template and Visme’s editor.
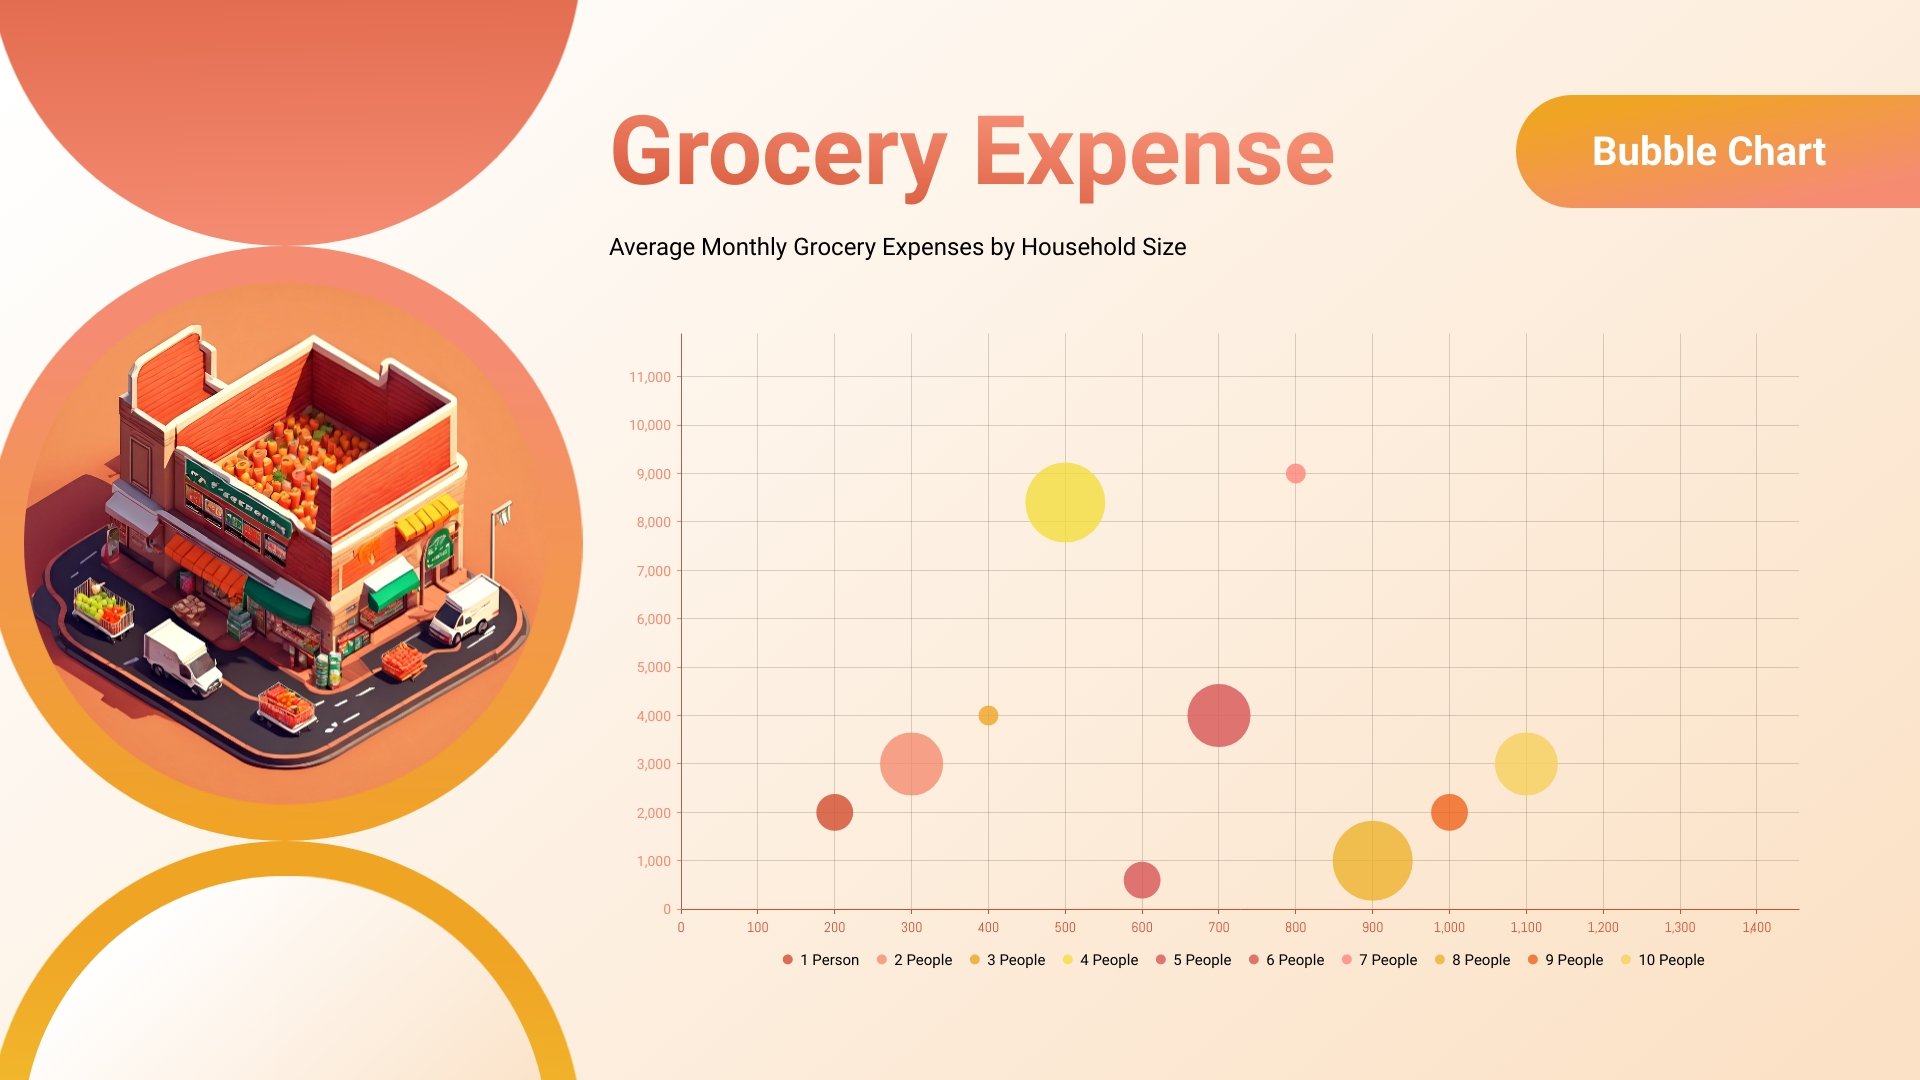
Grocery Expense Bubble Chart
Use this bubble chart template and Visme’s chart maker to create a data visualization for your analysis report.
