Crops Template
Use This TemplateShare important crop data with this thoughtfully designed graphic template
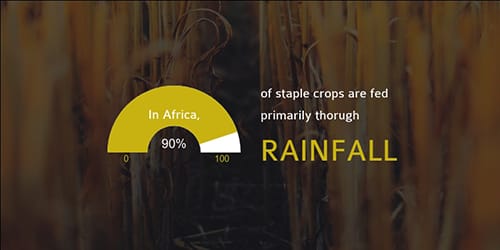
Make crop stats easy to understand with this engaging template design. It uses bright colored
semi-circle chart to visualize the percentage of staple crops fed through rainfall on an abstract brown background. You can swap out the chart type, background and any other design elements to make it truly yours.
Here’s the exciting part: Visme offers dozens of charts and widgets to help you visualize all types of data, whether it’s percentages, trends, or comparisons. This means you can tweak this design to present any kind of statistical data, from environmental insights to business performance metrics.
- Change colors, fonts and more to fit your branding
- Access free, built-in design assets or upload your own
- Visualize data with customizable charts and widgets
- Add animation, interactivity, audio, video and links
- Download in PDF, JPG, PNG and HTML5 format
- Create page-turners with Visme’s flipbook effect
- Share online with a link or embed on your website
Edit this template immediately, or check out all the web graphic templates available inside Visme’s template gallery.
Edit this template with our web graphics creator!
-
Dimensions
8.5” X 11” (US Letter) - Can also be customized to any desired dimension.
-
Customizable
Yes. This template can be fully customized. You can edit content, change image(s), apply custom colors, add or sub-tract pages.
-
Formats
Can be shared as public or private link, embedded to a site or blog, download as JPG, PNG, PDF or HTML5.
More like this

