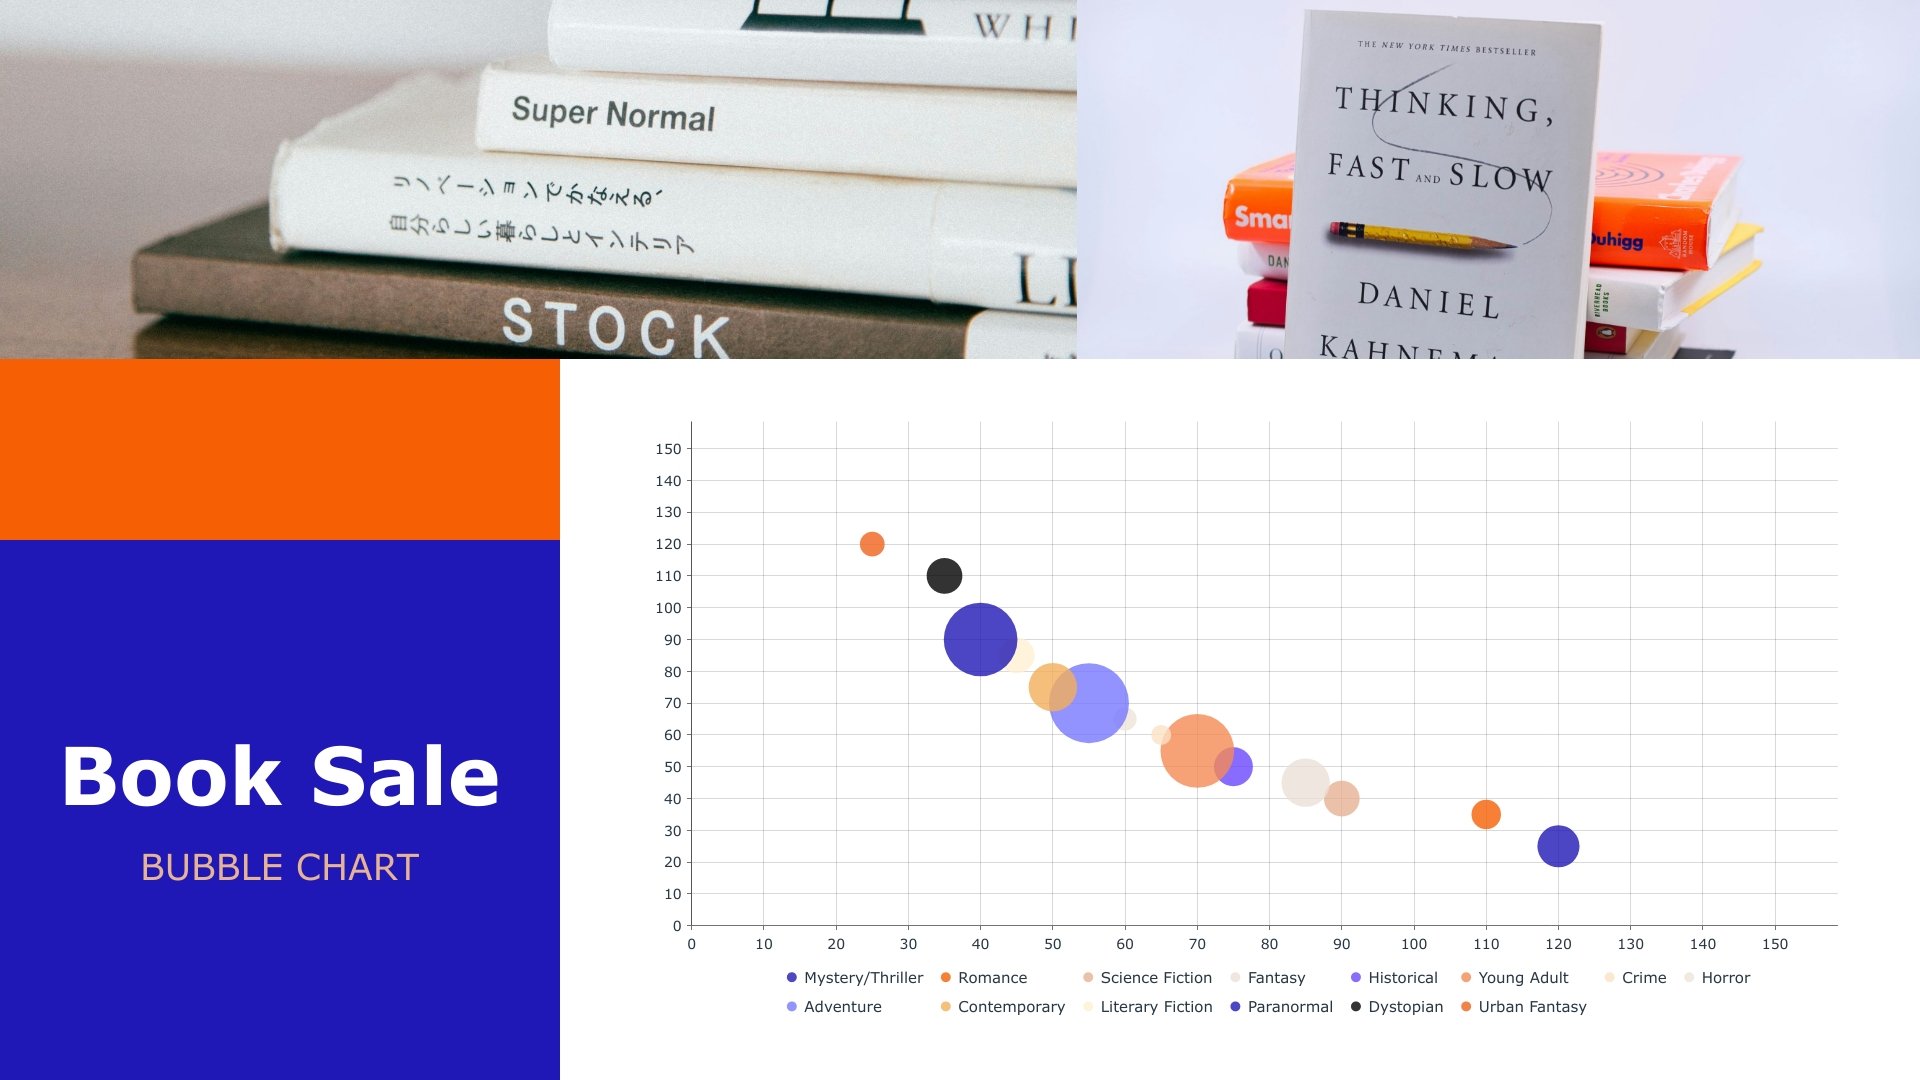
Book Sale Bubble Chart Template

Use This Template

Visually analyze book sales by type using this customizable bubble chart with Visme’s editor.


Bubble charts are data visualizations that can help analyze the relationship between three numerical variables. One variable goes along the x-axis, the other along the y axis and the third is the size of the bubble. To input your data into the bubble chart template, you can easily import a Google Sheet or CSV or manually add it. Then, you can replace the image with one that matches your data and update the header with your text. When finished, share the chart through a live link or directly on social media with Visme’s content scheduler.


  • Change colors, fonts and more to fit your branding
  • Access free, built-in design assets or upload your own
  • Visualize data with customizable charts and widgets
  • Add animation, interactivity, audio, video and links
  • Download in PDF, JPG, PNG and HTML5 format
  • Create page-turners with Visme’s flipbook effect
  • Share online with a link or embed on your website


Customize this graph template with your data using Visme’s graph editor or browse many other bubble chart templates in different designs.

Edit this template with our pie chart maker!

Book Sale Bubble Chart Template

Template Specifications

  • Dimensions

    All chart templates come in two sizes: horizontal (1920 x 1080 pixels) and square (800 x 800 pixels)

  • Customizable

    This chart template can be fully customized. You can edit content, change image(s), apply custom colors, add or subtract pages and more.

  • Formats

    Can be shared as public or private link online, embedded to a site or blog, or downloaded as JPG, PNG, PDF or HTML5. If downloaded as an image, you can also insert into other documents and presentations.

Compatibility

Related Charts & Graphs

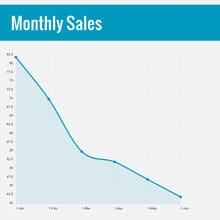
Monthly Sales Area Chart Template
Monthly Sales Area Chart Find and illustrate trends in your company’s financial data using this monthly sales area chart template.
Business Information Pie Chart Template
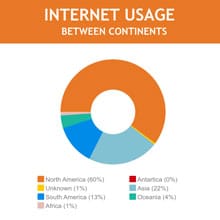
Business Information Pie Chart Present data and proportions in a visually appealing way using this business information pie chart template.
Monthly Expenses Pie Chart Template
Monthly Expenses Pie Chart Visually illustrate expenses in a given time using this colorful monthly expenses pie chart template.
Nonprofit Organizations Pie Chart Template
Nonprofit Organizations Pie Chart Present different quantities according to proportion by customizing this nonprofit pie chart template.
Technology Use Pie Chart Template
Technology Use Pie Chart Illustrate quantities and proportions in data visually using this customizable technology pie chart template.
Experience Level of Marketing Managers Pie Chart Template
Experience Level of Marketing Managers Pie Chart Edit this colorful pie chart template to visually present different proportions of data.
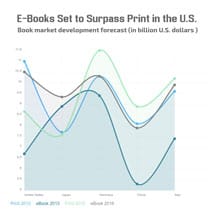
E-Books Set to Surpass Print Area Chart Template
E-Books Set to Surpass Print Area Chart Customize this colorful area chart template to compare and contrast between different data sets.
Book (19) Facebook Cover Template
Book (19) Facebook Cover Personalize this template and add it to your Facebook page or profile to inspire your followers on social media.
Books (20) Facebook Ad Template
Books (20) Facebook Ad Promote your book sale on Facebook by customizing this ad template with your information.
Library Template
Library Take your social media profile to the next level using this creative Twitter post template.
Scrapbook Making Template
Scrapbook Making Promote your scrapbook making guide in a unique way using this colorful social media graphics template. 
Travel Template
Travel Promote stress-free travel experiences with this sleek travel template
Study Session - Flyer Template
Study Session - Flyer Promote your educational events in style using this study session flyer template.
Digital Marketing - Business Card Template
Digital Marketing - Business Card Make a lasting impression with this highly professional business card template.
Digital Marketers Template
Digital Marketers Share actionable tips and strategies for digital marketing success using this eye-catching web graphic template. 
U.S Food Consumption Template
U.S Food Consumption Visualize U.S. food consumption at a glance with this sleek web graphic template.
Physical Activity Facts Template
Physical Activity Facts Make physical activity facts engaging and easy to digest with this web graphics template.
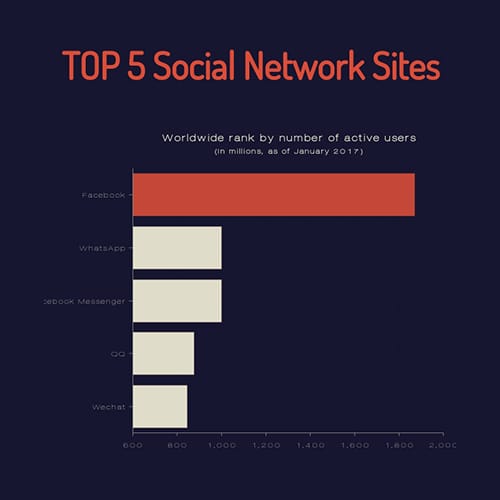
Social Network Sites Ranking Template
Social Network Sites Ranking Highlight the world’s top social network sites with this web graphic template.
Company Timeline Template
Company Timeline Explain your company history in style with the help of this visually engaging company timeline template.
Laptop Comparison Template
Laptop Comparison Use this laptop comparison web graphic to showcase the differences between Macbook and Notebook.