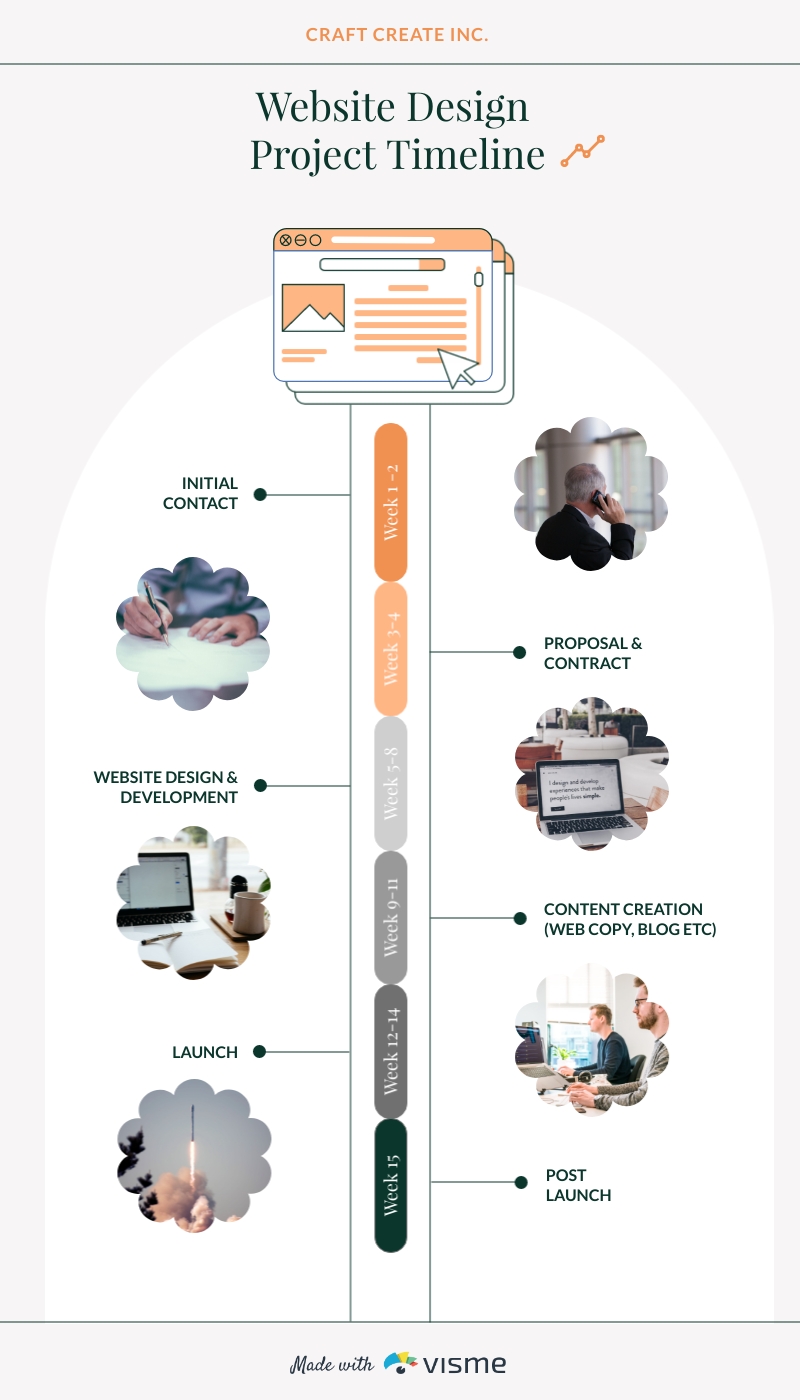
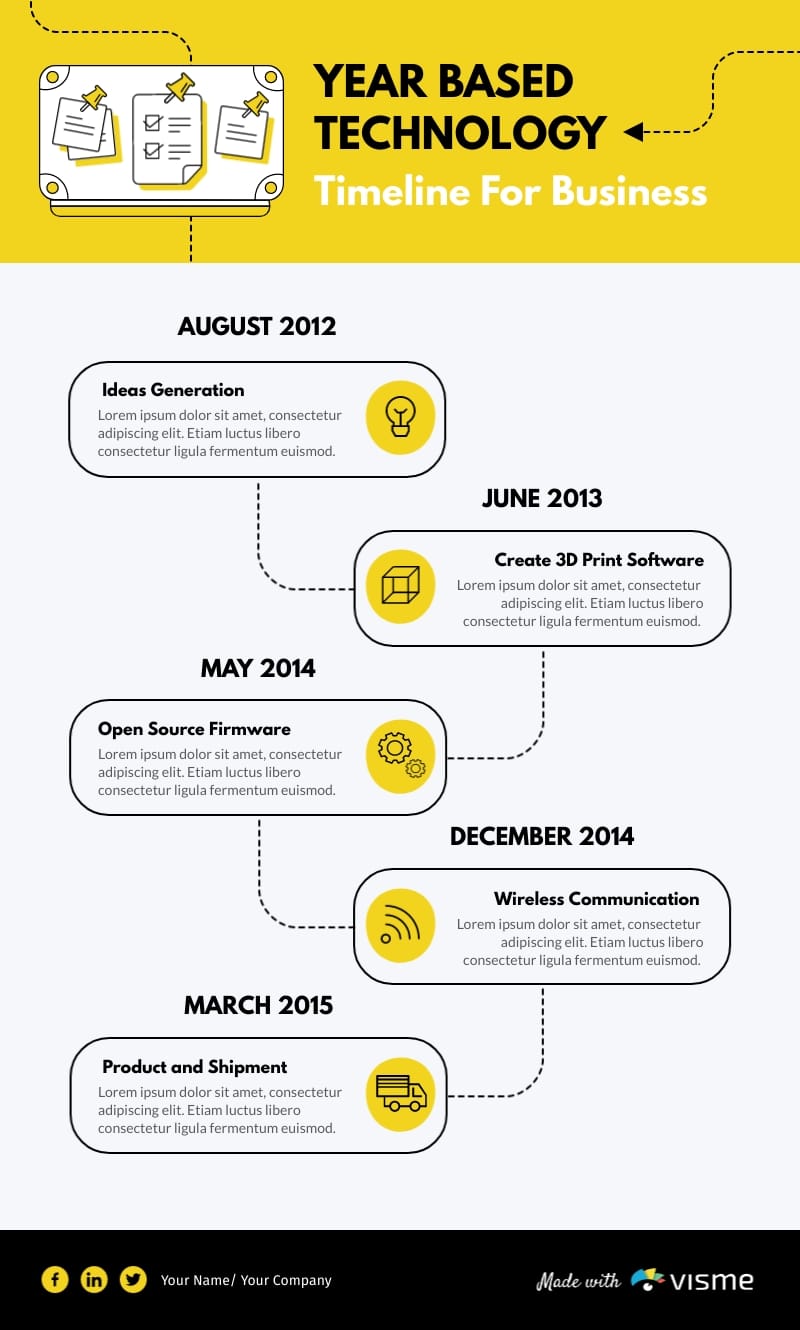
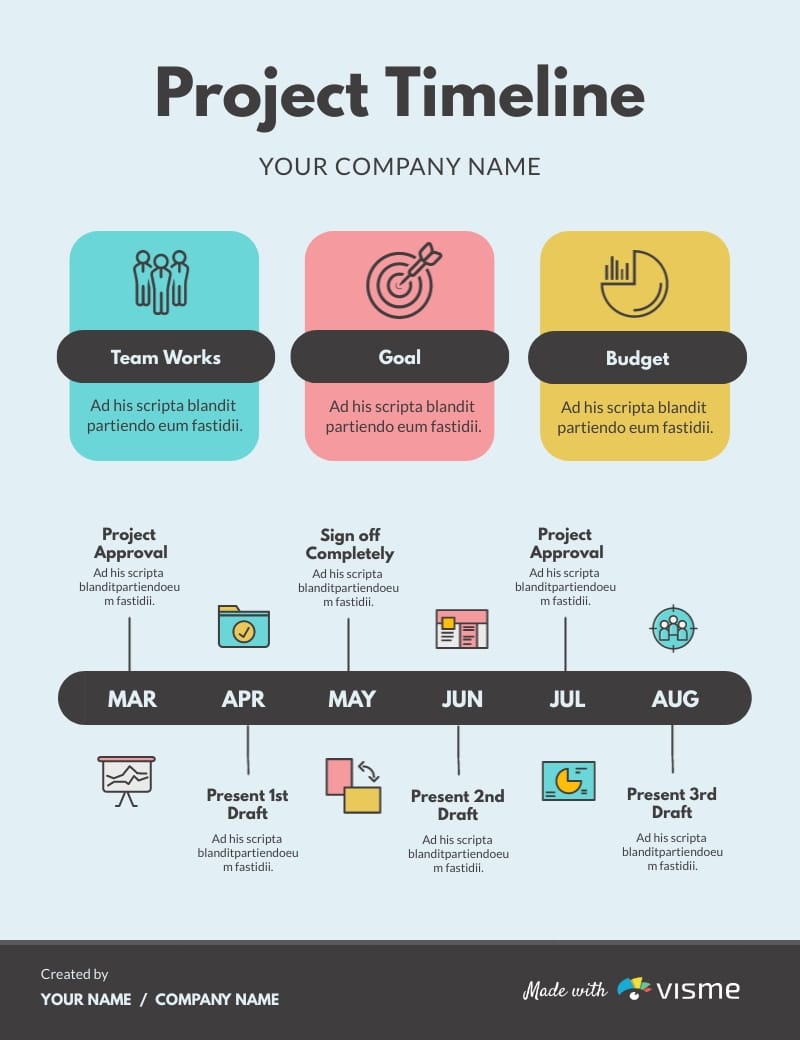
Sustainable Growth Rate (SGR) Timeline Infographic Template
Use This TemplateVisualize dates and events of a business or industry using this sustainable growth rate timeline infographic template.
Over the year, growth progress must be tracked for businesses and industries and can go a long way if presented properly during board meetings and other meetings and reports. The sustainable growth rate (SGR) timeline infographic allows you to simply illustrate the over-the-time progression using icons and texts.
Use this template for other purposes, too, like visualizing your business career and successes, outlining company history or showing important scientific discoveries.
- Apply different color themes and font styles with a few clicks
- Access millions of free design assets from inside the editor
- Visualize data with customizable widgets, maps, charts and graphs
- Add interactivity with animation, hover effects, pop-ups and links
- Download in different formats: JPG, PNG, PDF and HTML5
- Share your work online with a link or embed it on your website
Show your stable growth in the next board meeting with this visually appealing template, or check out our 500+ professional infographic templates to explore more options.
Edit this template with our infographic maker!
-
Dimensions
All infographic templates are 800 pixels wide with varying lengths. These dimensions can be easily changed and the length adjusted with a slider.
-
Customizable
This template can be fully customized. You can edit content, change image(s), apply custom colors, input your own fonts and logo, and more.
-
Formats
Download as a high resolution JPEG, PNG, PDF or HTML5, embed into a blog post or webpage, or generate a shareable link for online use.
Related Infographics


