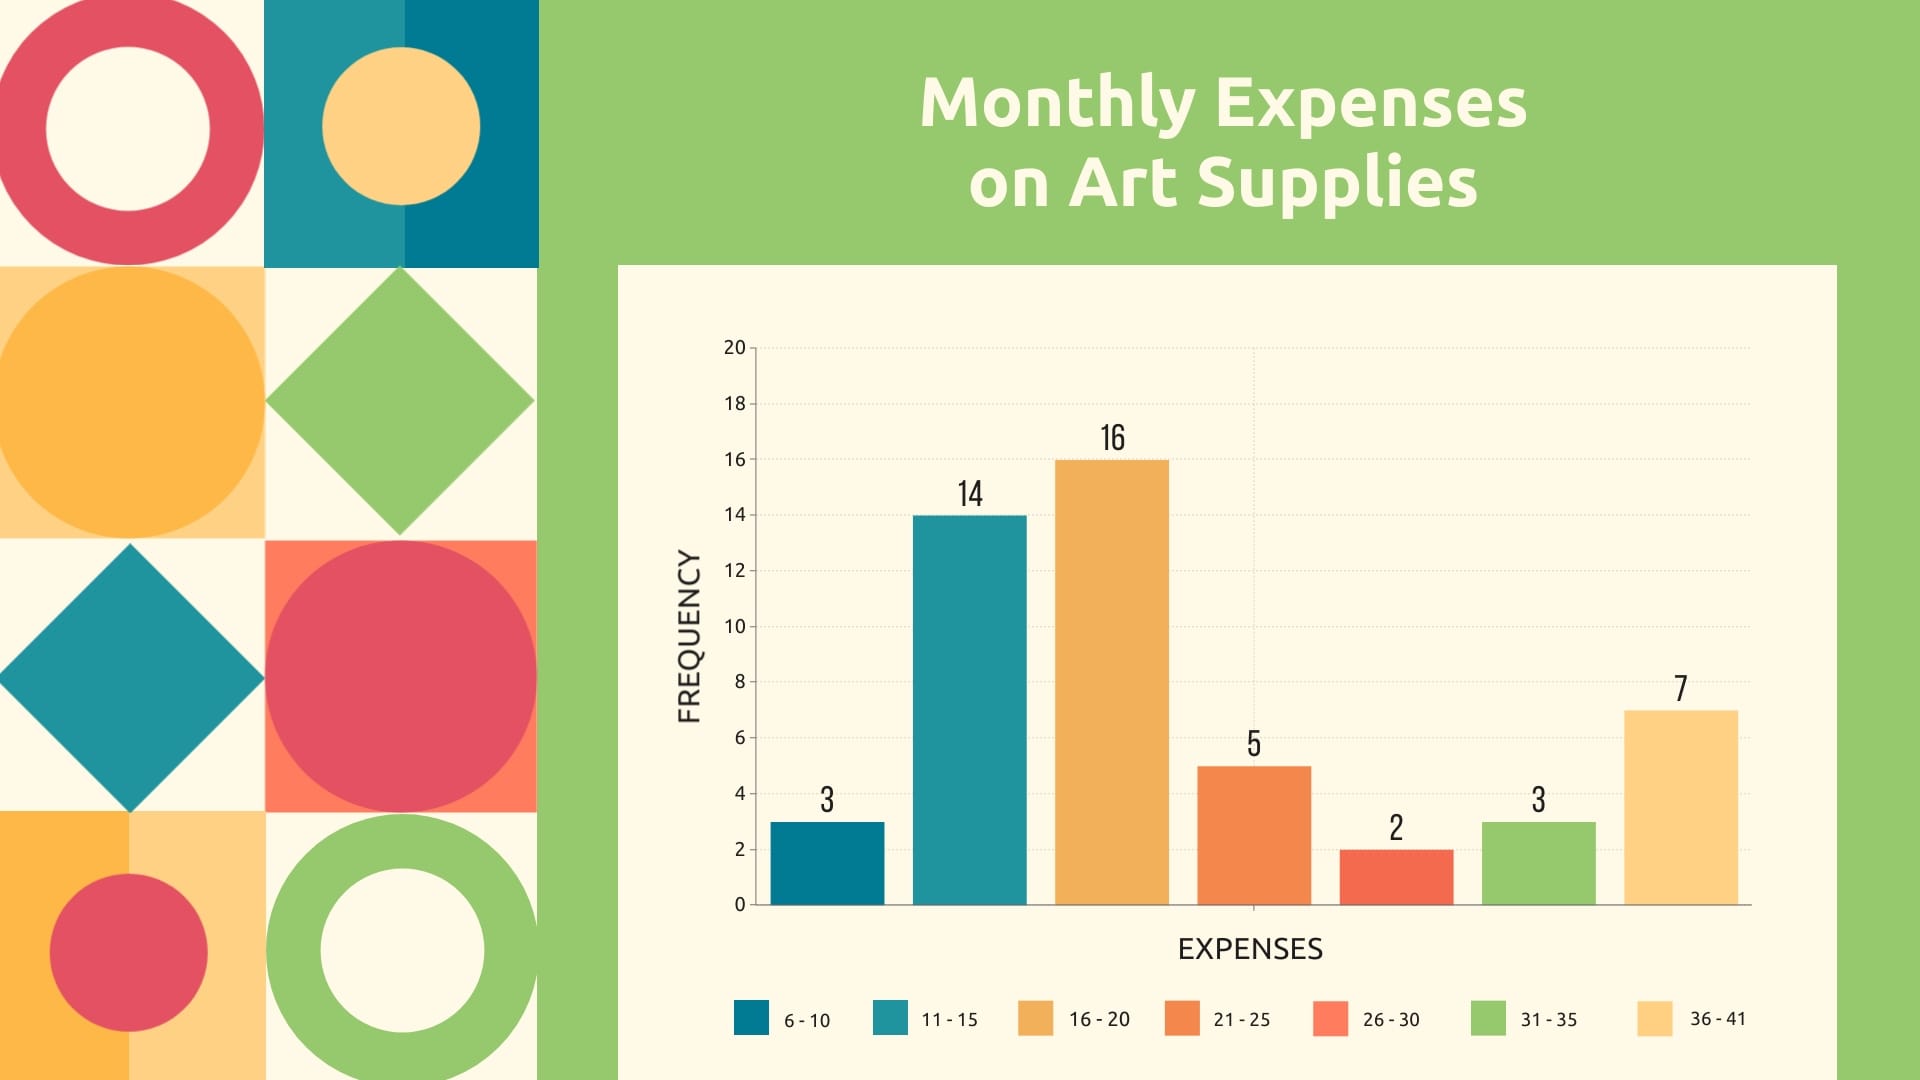
Secondhand Smoking Bar Graph Template
Use This TemplateUse this bar graph template to show the exposure of secondhand smoking on different age groups.
Sporting a purple, blue, yellow and a blue color palette, this editable bar graph template is designed to showcase the impact of secondhand smoking on various age groups. Ideal for health educators, anti-smoking advocates, or community organizations, it ensures the data is impactful. Generate awareness, promote healthier habits, or support policy change initiatives – all with this template.
- Change colors, fonts and more to fit your branding
- Access free, built-in design assets or upload your own
- Visualize data with customizable charts and widgets
- Add animation, interactivity, audio, video and links
- Download in PDF, JPG, PNG and HTML5 format
- Create page-turners with Visme’s flipbook effect
- Share online with a link or embed on your website
Edit this template using Visme's user-friendly editor and dig into more health-related bar graph templates for your communication needs.
Edit this template with our pie chart maker!
-
Dimensions
All chart templates come in two sizes: horizontal (1920 x 1080 pixels) and square (800 x 800 pixels)
-
Customizable
This chart template can be fully customized. You can edit content, change image(s), apply custom colors, add or subtract pages and more.
-
Formats
Can be shared as public or private link online, embedded to a site or blog, or downloaded as JPG, PNG, PDF or HTML5. If downloaded as an image, you can also insert into other documents and presentations.
Related Charts & Graphs


