1. Home
  2. Create Infographics
  3. Infographic Templates
  4. Facebook Users based on Age Group Histogram Template

Facebook Users based on Age Group Histogram Template

Use This Template

Gain insights on social media demographics with this engaging histogram that sorts Facebook users by age group.

Boasting a blue and orange color palette that reflects Facebook's branding, this histogram template is a must-have for social media analysts and digital marketers. Explore user age ranges and their interactions with the platform, providing a visual breakdown that can inform content strategy and advertising decisions. With Visme's editor, you can customize the histogram to showcase your data insights vividly and communicate them to your audience.

  • Change colors, fonts and more to fit your branding
  • Access free, built-in design assets or upload your own
  • Visualize data with customizable charts and widgets
  • Add animation, interactivity, audio, video and links
  • Download in PDF, JPG, PNG and HTML5 format
  • Create page-turners with Visme’s flipbook effect
  • Share online with a link or embed on your website

Edit this template now for a more tailored approach, or explore additional creatively designed histogram templates to meet diverse data presentation needs.

Edit this template with our infographic maker!

Facebook Users based on Age Group Histogram Template
Template Specifications
  • Dimensions

    All infographic templates are 800 pixels wide with varying lengths. These dimensions can be easily changed and the length adjusted with a slider.

  • Customizable

    This template can be fully customized. You can edit content, change image(s), apply custom colors, input your own fonts and logo, and more.

  • Formats

    Download as a high resolution JPEG, PNG, PDF or HTML5, embed into a blog post or webpage, or generate a shareable link for online use.

Compatibility

Related Infographics

BMI prevalence in a Population of 50 people Histogram Template
BMI prevalence in a Population of 50 people Histogram Unveil patterns within body mass index distributions across a diverse group using this versatile histogram design.
Weight of 30 Newborns in a Nursery Histogram Template
Weight of 30 Newborns in a Nursery Histogram Present information on newborn health metrics effectively using this detailed histogram chart.
Monthly Customers of a Bookstore Histogram Template
Monthly Customers of a Bookstore Histogram Visualize customer engagement and draw meaningful conclusions from monthly visitor data with this dynamic histogram infographic.
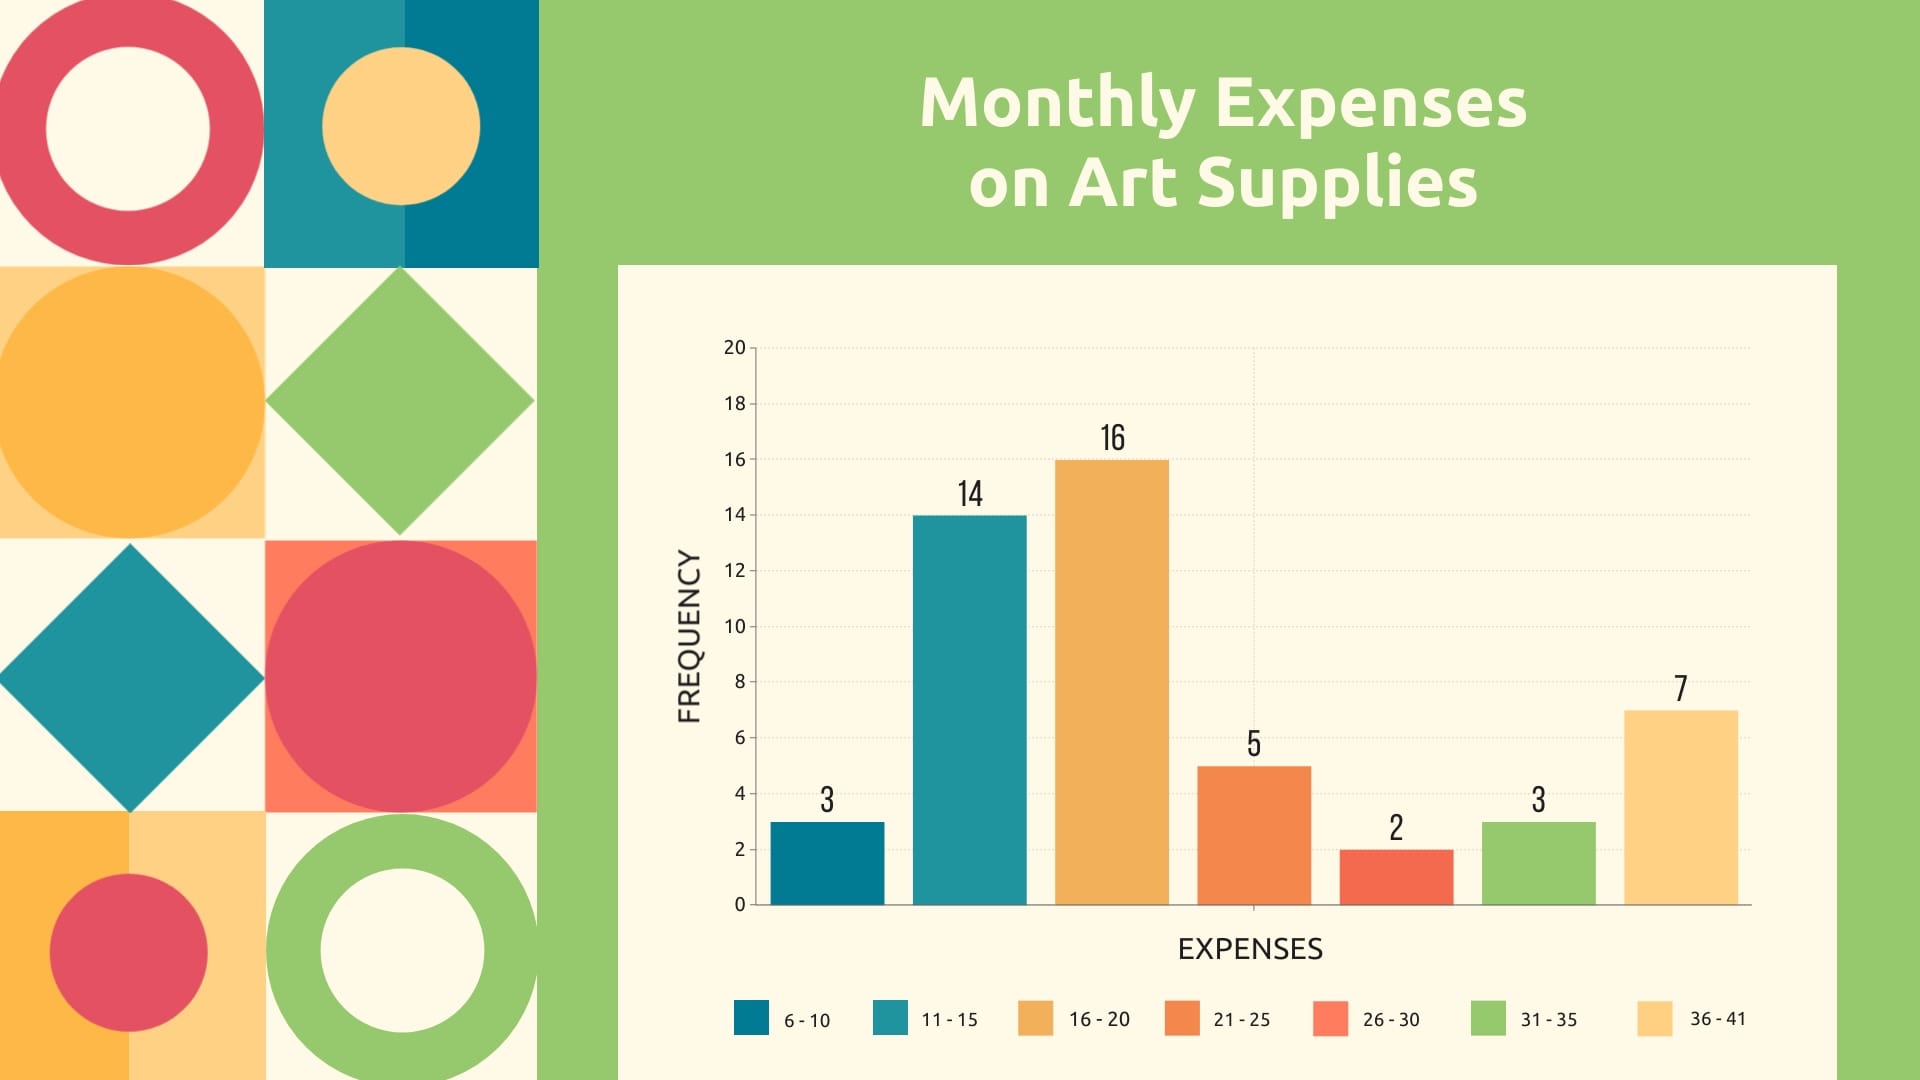
Monthly Expenses on Art Supplies Histogram Template
Monthly Expenses on Art Supplies Histogram Track and visualize your monthly art investments with this user-friendly histogram template.
Quarterly Sales of a Lemonade Stand Histogram Template
Quarterly Sales of a Lemonade Stand Histogram Showcase business growth and seasonal trends with this creative histogram depicting the quarterly sales of a lemonade stand.
Population Estimates by State Histogram Template
Population Estimates by State Histogram Display population metrics with precision through the population estimates by state histogram.
Distance Traveled by a Cyclist Histogram Template
Distance Traveled by a Cyclist Histogram Analyze and present the progress of a cyclist over time with this engaging histogram infographic.
Average Annual Temperature of a Region Histogram Template
Average Annual Temperature of a Region Histogram Impress your audience with detailed temperature trends over time using this histogram template.