1. Home
  2. Create Charts & Graphs
  3. Chart Templates
  4. Programming Languages Bar Graph Template

Programming Languages Bar Graph Template

Use This Template

Put together information on the fastest growing programming languages with this bar graph template.

Designed for tech enthusiasts, this bar graph template is perfect for showcasing the fastest growing programming languages. Suitable for tech blogs, educational webinars, or coding workshops, this template allows you to turn dense data into an engaging narrative. Whether you’re tracking the rise of Python or the steady popularity of Java, this design will make your content visually compelling.

  • Change colors, fonts and more to fit your branding
  • Access free, built-in design assets or upload your own
  • Visualize data with customizable charts and widgets
  • Add animation, interactivity, audio, video and links
  • Download in PDF, JPG, PNG and HTML5 format
  • Create page-turners with Visme’s flipbook effect
  • Share online with a link or embed on your website

Edit this template using Visme's interactive editor and explore more tech-oriented bar graph templates for your data visualization needs.

Edit this template with our pie chart maker!

Programming Languages Bar Graph Template

Template Specifications

  • Dimensions

    All chart templates come in two sizes: horizontal (1920 x 1080 pixels) and square (800 x 800 pixels)

  • Customizable

    This chart template can be fully customized. You can edit content, change image(s), apply custom colors, add or subtract pages and more.

  • Formats

    Can be shared as public or private link online, embedded to a site or blog, or downloaded as JPG, PNG, PDF or HTML5. If downloaded as an image, you can also insert into other documents and presentations.

Compatibility

Related Charts & Graphs

Surveys Template
Surveys Make your survey results stand out and drive home key takeaways with this sleek, easy-to-use template.
Top How to Searches in US Bar Graph Template
Top How to Searches in US Bar Graph Use this bar graph template to showcase the most popular how-to searches in the US.
UK Employment by Occupation Bar Graph Template
UK Employment by Occupation Bar Graph Showcase occupations with the highest employment rates using this bar graph template.
Global Social Media Usage Bar Graph Template
Global Social Media Usage Bar Graph Show the usage of popular social media platforms with this bar graph template.
Global Temperature Variations Bar Graph Template
Global Temperature Variations Bar Graph Break down the rapid variations in global temperature using this bar graph template.
Secondhand Smoking Bar Graph Template
Secondhand Smoking Bar Graph Use this bar graph template to show the exposure of secondhand smoking on different age groups.
Hardware Store Sales Bar Graph Template
Hardware Store Sales Bar Graph Narrow down all the items sold in your hardware store using this bar graph template.
Profit Generated Bar Graph Template
Profit Generated Bar Graph Show the profits generated by different stores of your company using this bar graph template.
Average Annual Temperature of a Region Histogram Template
Average Annual Temperature of a Region Histogram Impress your audience with detailed temperature trends over time using this histogram template.
Distance Traveled by a Cyclist Histogram Template
Distance Traveled by a Cyclist Histogram Analyze and present the progress of a cyclist over time with this engaging histogram infographic.
Population Estimates by State Histogram Template
Population Estimates by State Histogram Display population metrics with precision through the population estimates by state histogram.
Quarterly Sales of a Lemonade Stand Histogram Template
Quarterly Sales of a Lemonade Stand Histogram Showcase business growth and seasonal trends with this creative histogram depicting the quarterly sales of a lemonade stand.
Monthly Expenses on Art Supplies Histogram Template
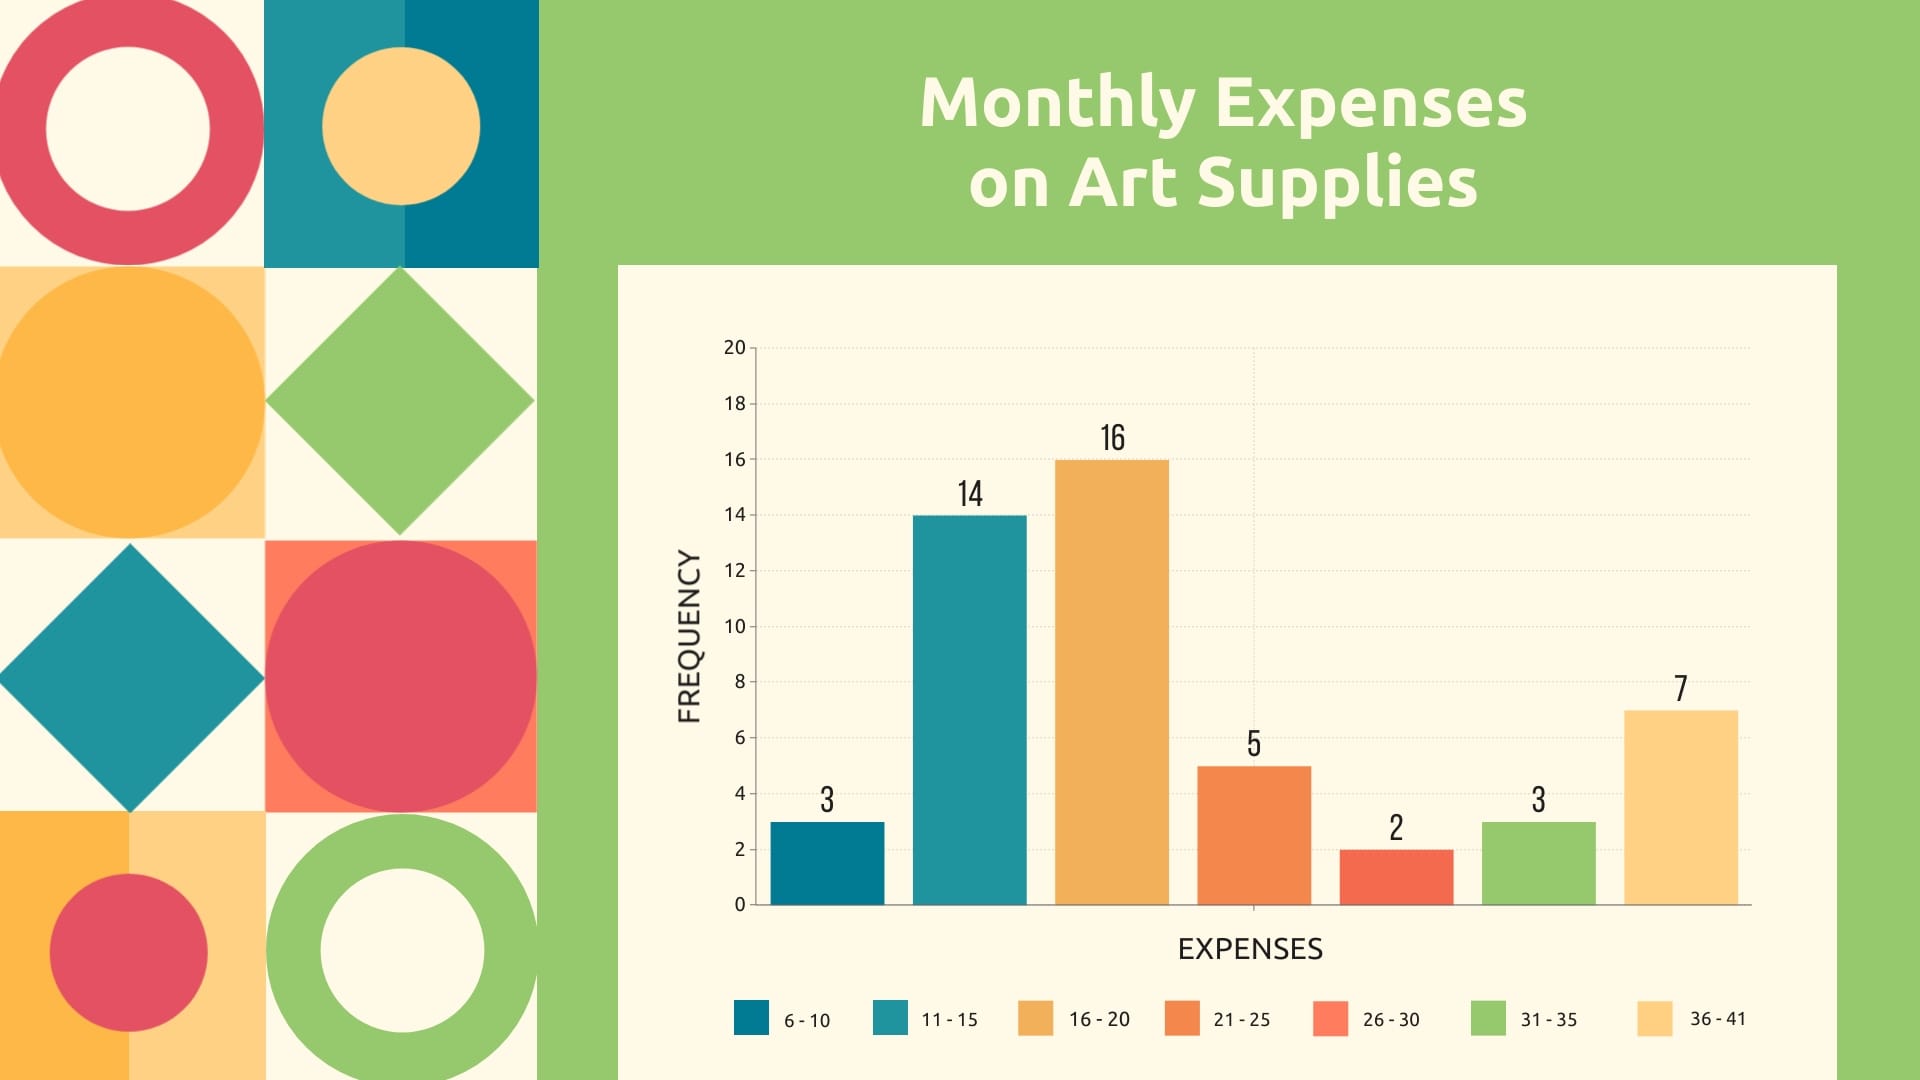
Monthly Expenses on Art Supplies Histogram Track and visualize your monthly art investments with this user-friendly histogram template.
Monthly Customers of a Bookstore Histogram Template
Monthly Customers of a Bookstore Histogram Visualize customer engagement and draw meaningful conclusions from monthly visitor data with this dynamic histogram infographic.
Weight of 30 Newborns in a Nursery Histogram Template
Weight of 30 Newborns in a Nursery Histogram Present information on newborn health metrics effectively using this detailed histogram chart.
BMI prevalence in a Population of 50 people Histogram Template
BMI prevalence in a Population of 50 people Histogram Unveil patterns within body mass index distributions across a diverse group using this versatile histogram design.
Facebook Users based on Age Group Histogram Template
Facebook Users based on Age Group Histogram Gain insights on social media demographics with this engaging histogram that sorts Facebook users by age group.
Creative Bar Graph Template
Creative Bar Graph Break down Apple’s sales data and show the most-sold products with this creative bar graph template.
Simple Bar Graph Template
Simple Bar Graph Show Apple’s top-selling products with this simple bar graph template.
Modern Bar Graph Template
Modern Bar Graph Use this modern bar graph template to show the best selling products of Apple.