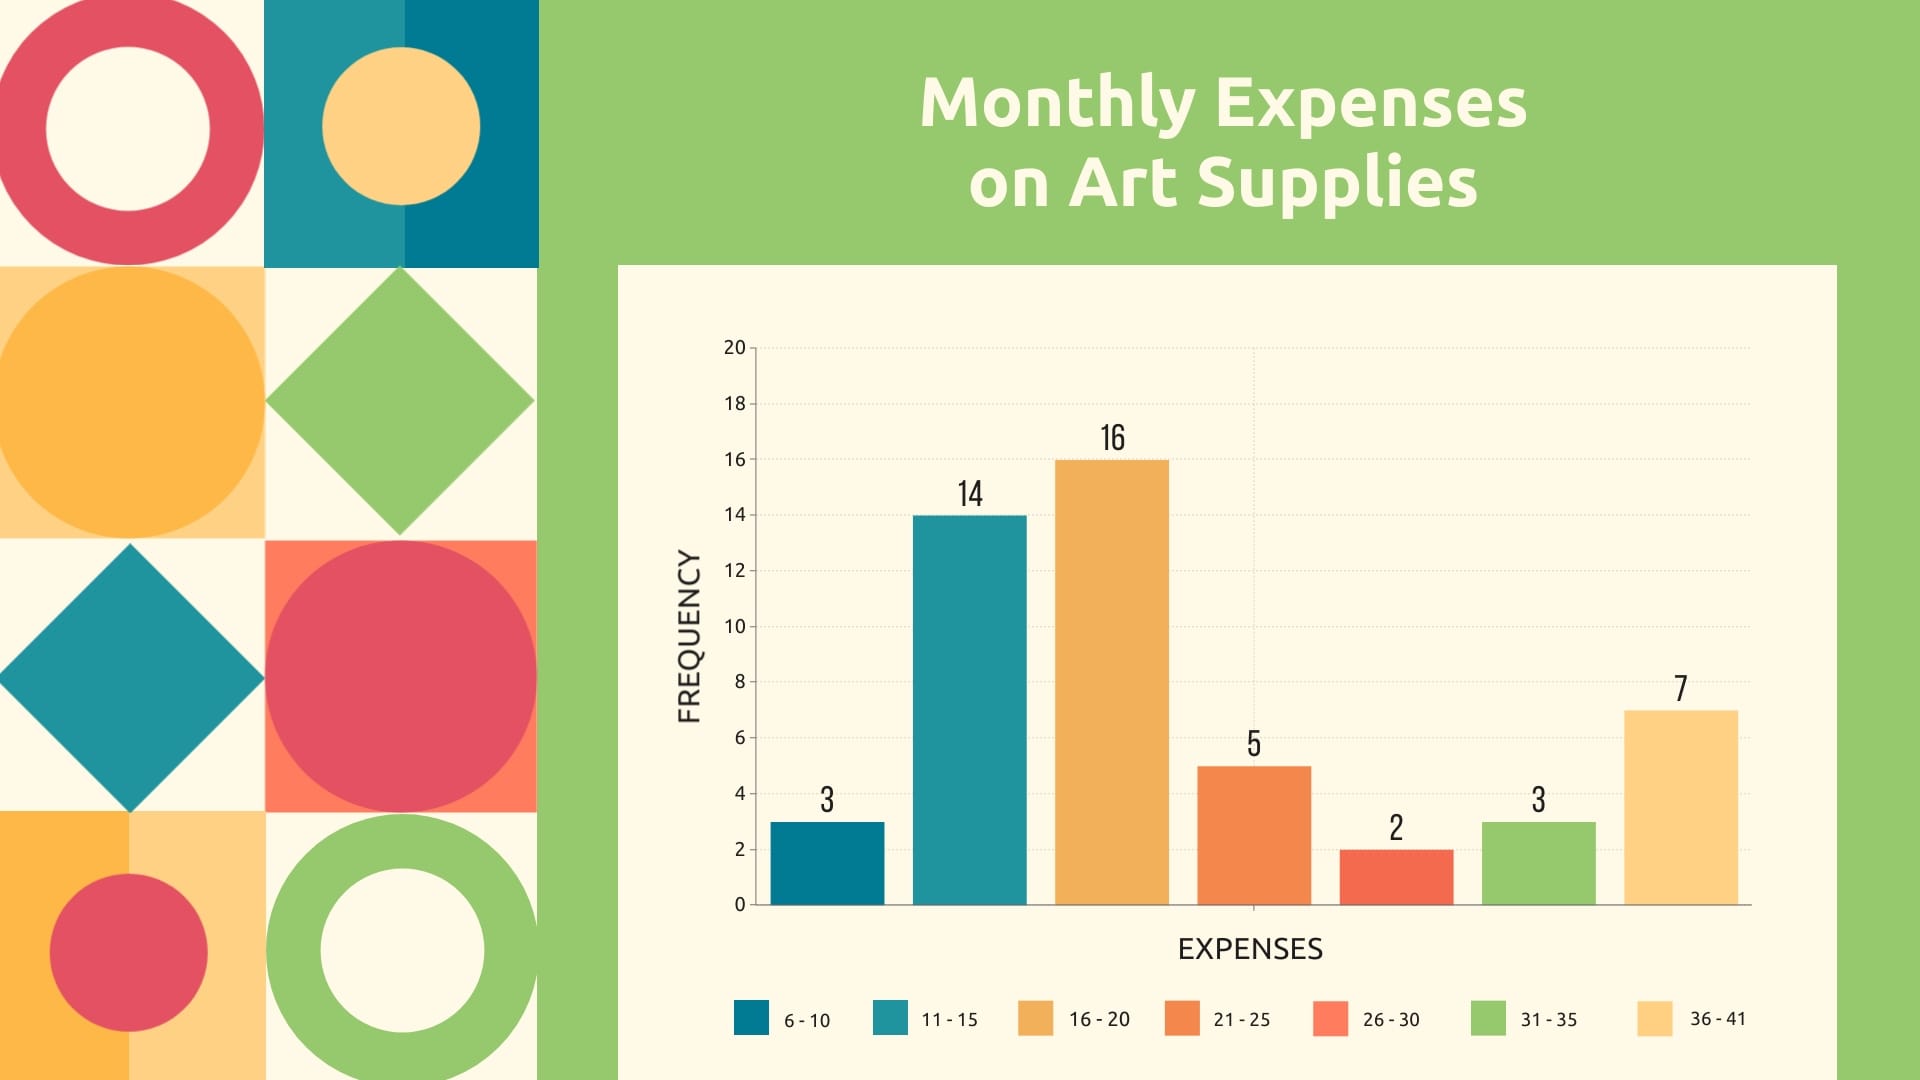
Monthly Car Sales Bar Graph Template
Use This TemplateShowcase the number of cars sold in a month using this bar graph template.
Boasting a bold and dynamic design, this effective bar graph template helps provide a clear illustration of your dealership's monthly car sales. Easily input your data - the make, model, and number of cars sold per month — and watch the graph evolve. Great for sales meetings, investor presentations, or dealership marketing materials. This template can be customized to fit your business-related needs.
- Change colors, fonts and more to fit your branding
- Access free, built-in design assets or upload your own
- Visualize data with customizable charts and widgets
- Add animation, interactivity, audio, video and links
- Download in PDF, JPG, PNG and HTML5 format
- Create page-turners with Visme’s flipbook effect
- Share online with a link or embed on your website
Edit this template with Visme's interactive editor, or browse our other sales-oriented bar graph templates for more options.
Edit this template with our pie chart maker!
-
Dimensions
All chart templates come in two sizes: horizontal (1920 x 1080 pixels) and square (800 x 800 pixels)
-
Customizable
This chart template can be fully customized. You can edit content, change image(s), apply custom colors, add or subtract pages and more.
-
Formats
Can be shared as public or private link online, embedded to a site or blog, or downloaded as JPG, PNG, PDF or HTML5. If downloaded as an image, you can also insert into other documents and presentations.
Related Charts & Graphs


