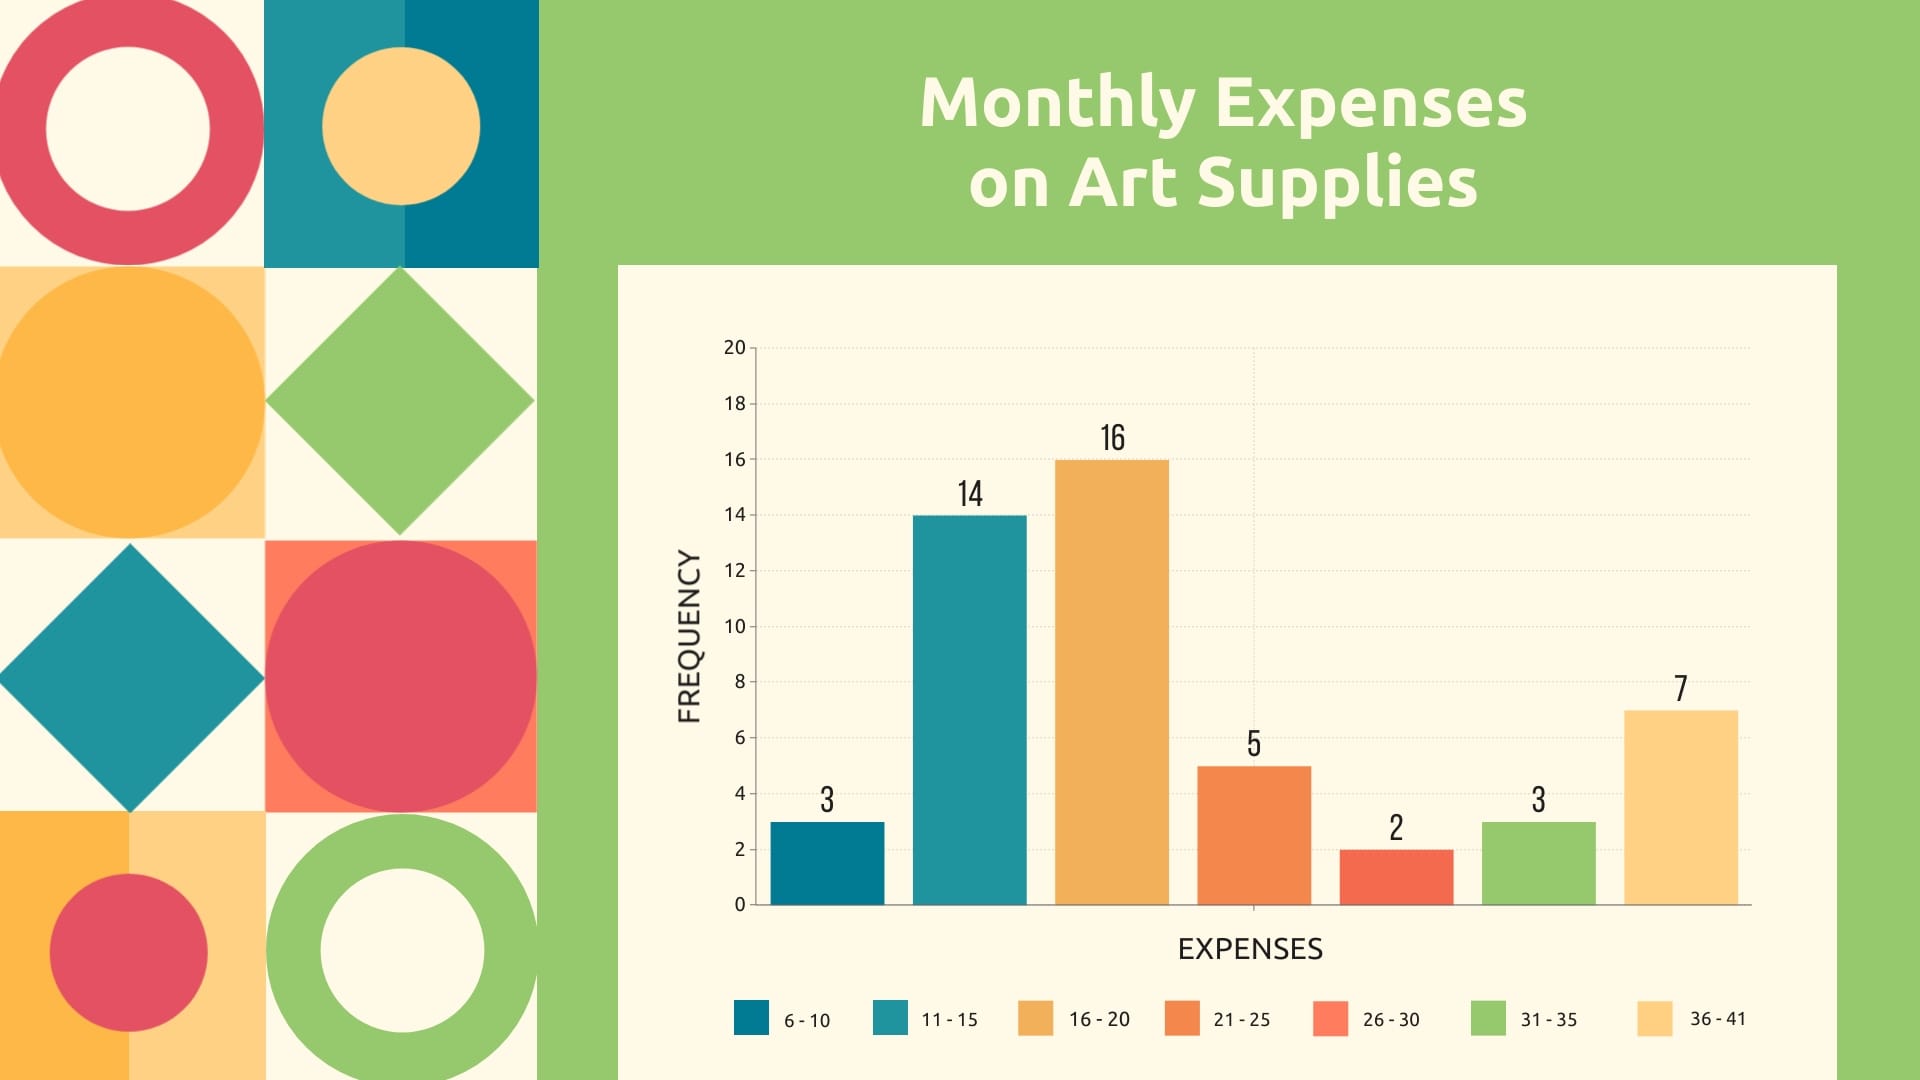
Investment Split Chart Template
Use This TemplateBreak down your investment portfolio using this Investment Split Chart template.
From equities to bonds to commodities, this investment split chart template provides a visual representation of your portfolio's composition. The clear and organized layout enables investors, financial analysts, or portfolio managers a quick snapshot of their investments.
Highlight the diversification and performance of your portfolio for more informed investment strategies or client presentations.
- Change colors, fonts and more to fit your branding
- Access free, built-in design assets or upload your own
- Visualize data with customizable charts and widgets
- Add animation, interactivity, audio, video and links
- Download in PDF, JPG, PNG and HTML5 format
- Create page-turners with Visme’s flipbook effect
- Share online with a link or embed on your website
Edit this template using Visme's user-friendly editor, and explore additional bar graph templates for your investment analysis needs.
Edit this template with our pie chart maker!
-
Dimensions
All chart templates come in two sizes: horizontal (1920 x 1080 pixels) and square (800 x 800 pixels)
-
Customizable
This chart template can be fully customized. You can edit content, change image(s), apply custom colors, add or subtract pages and more.
-
Formats
Can be shared as public or private link online, embedded to a site or blog, or downloaded as JPG, PNG, PDF or HTML5. If downloaded as an image, you can also insert into other documents and presentations.
Related Charts & Graphs


