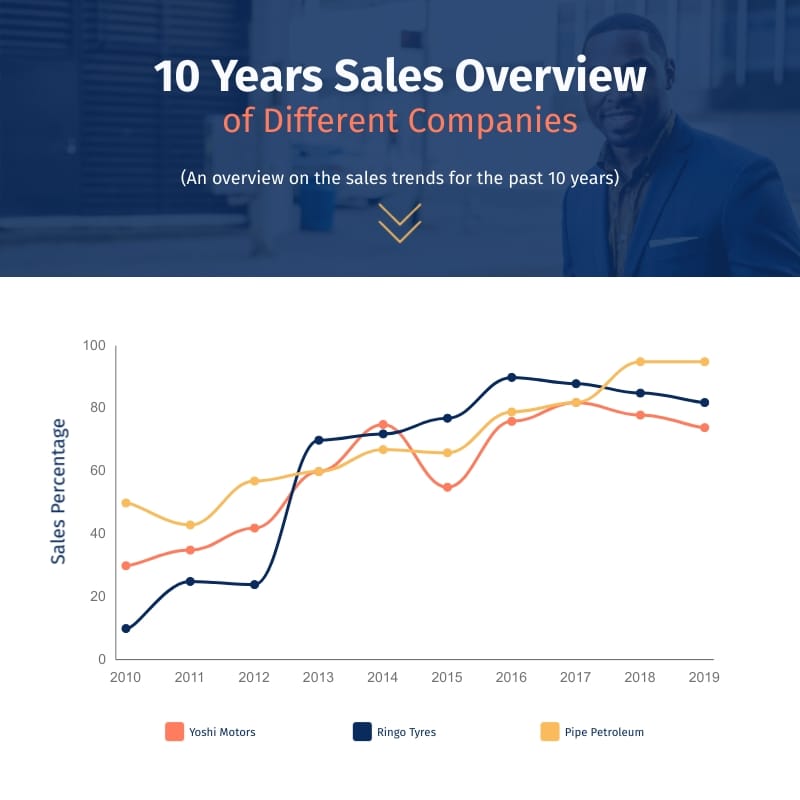
10 Years Sales Overview Line Graph Square Template
Use This TemplateShowcase important sales data of multiple companies with this line graph template.
Edit this template with our pie chart maker!
Template Specifications
-
Dimensions
All chart templates come in two sizes: horizontal (1920 x 1080 pixels) and square (800 x 800 pixels)
-
Customizable
This chart template can be fully customized. You can edit content, change image(s), apply custom colors, add or subtract pages and more.
-
Formats
Can be shared as public or private link online, embedded to a site or blog, or downloaded as JPG, PNG, PDF or HTML5. If downloaded as an image, you can also insert into other documents and presentations.
Compatibility
Related tags
Related Charts & Graphs

Brand Guidelines Document
Share everything related to your brand personality and win over your audience using this style guide template.

Post Campaign Analysis Report
Present the developments and results of your brand campaign with this report template.
Monthly Sales Area Chart
Find and illustrate trends in your company’s financial data using this monthly sales area chart template.

Business Information Pie Chart
Present data and proportions in a visually appealing way using this business information pie chart template.

Monthly Expenses Pie Chart
Visually illustrate expenses in a given time using this colorful monthly expenses pie chart template.

Nonprofit Organizations Pie Chart
Present different quantities according to proportion by customizing this nonprofit pie chart template.

Revenues by Region Line Graph
Explain trends in data in a visually engaging way using this financial line graph template.
Technology Use Pie Chart
Illustrate quantities and proportions in data visually using this customizable technology pie chart template.

Experience Level of Marketing Managers Pie Chart
Edit this colorful pie chart template to visually present different proportions of data.
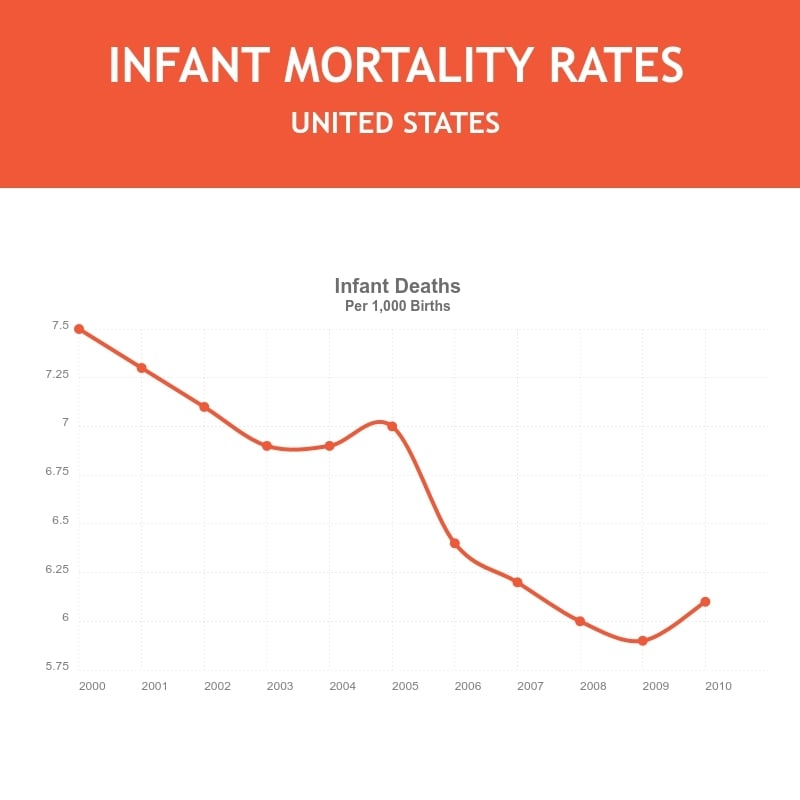
Infant Mortality Rate Line Graph
Visualize data and illustrate trends in an appealing way using this infant mortality rate line graph template.
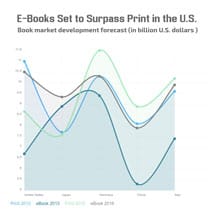
E-Books Set to Surpass Print Area Chart
Customize this colorful area chart template to compare and contrast between different data sets.
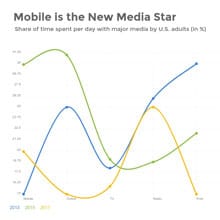
Mobile is the New Media Star Line Graph
Use this line graph template to present and compare trends in multiple datasets.

Chinese Class
Get more people to sign up for your language classes using this website template.

Education Facebook posts
Create a Facebook post easily by customizing this template and sharing it online directly from Visme’s dashboard.

HD Movies
Show website visitors how they can watch high-quality movies with this website ad template.

Holiday Treats
Announce your special holiday treat offers with this inviting template.

Insider Exclusives
Get more customers to sign up with your brand using this website ad template.

Training videos
Share your brand’s value proposition with your website visitors using this leaderboard template.

VIP Member Exclusive
Show website visitors how they can take advantage of exclusive VIP deals using this website ad template.

Artist
Promote drawing lessons and inspire creativity with this artist's social media graphic template
