1. Home
  2. Create Infographics
  3. Infographic Templates
  4. Worldwide Social Media Usage Bar Graph Infographic Template

Worldwide Social Media Usage Bar Graph Infographic Template

Use This Template

Educate your audience on social media usage trends using this eye-catching infographic template.

Share information about social media usage with the help of Visme’s modern infographic template. Fully customizable, this graphic can be tailored to suit your needs in just minutes. Scroll through our outstanding range of engaging typefaces for inspiration and a myriad of fresh ideas.

  • Change color themes and font styles with a few clicks
  • Access millions of free graphics from inside the editor
  • Visualize data with custom widgets, maps and charts
  • Add interactivity like animation, hover effects and links
  • Download in JPG, PNG, PDF and HTML5 format
  • Share online with a link or embed it on your website

Reveal social media usage trends with this versatile design or check out Visme’s diverse collection of infographic templates now.

Edit this template with our infographic maker!

Worldwide Social Media Usage Bar Graph Infographic Template
Template Specifications
  • Dimensions

    All infographic templates are 800 pixels wide with varying lengths. These dimensions can be easily changed and the length adjusted with a slider.

  • Customizable

    This template can be fully customized. You can edit content, change image(s), apply custom colors, input your own fonts and logo, and more.

  • Formats

    Download as a high resolution JPEG, PNG, PDF or HTML5, embed into a blog post or webpage, or generate a shareable link for online use.

Compatibility

Related Infographics

Social Platform Bar Graph Template
Social Platform Bar Graph Share your research in an impactful manner using this eye-catching bar graph template.
Facebook Demographics Histogram Infographic Template
Facebook Demographics Histogram Infographic Illustrate distributions in data in a visual and appealing way using this demographics histogram infographic.
Hardware Store Sales Bar Graph Infographic Template
Hardware Store Sales Bar Graph Infographic Compare and contrast between multiple datasets and convey messages through them using visuals and charts by the help of this hardware store sales bar graph infographic template.
Generated Profit Bar Graph Infographic Template
Generated Profit Bar Graph Infographic Bring boring data to life by visualizing them using this generated profit bar graph infographic template.
Adults Clean Their Teeth Bar Graph Infographic Template
Adults Clean Their Teeth Bar Graph Infographic Create informative and visually appealing infographics using this bar graph infographic template.
Cultural Event Bar Graph Infographic Template
Cultural Event Bar Graph Infographic Present and observe nuances in audience interest and participation in different event types using this cultural event bar graph infographic template.
World's Safest Countries Bar Graph Template
World's Safest Countries Bar Graph Share your research in an impeccable fashion using this bar graph template.
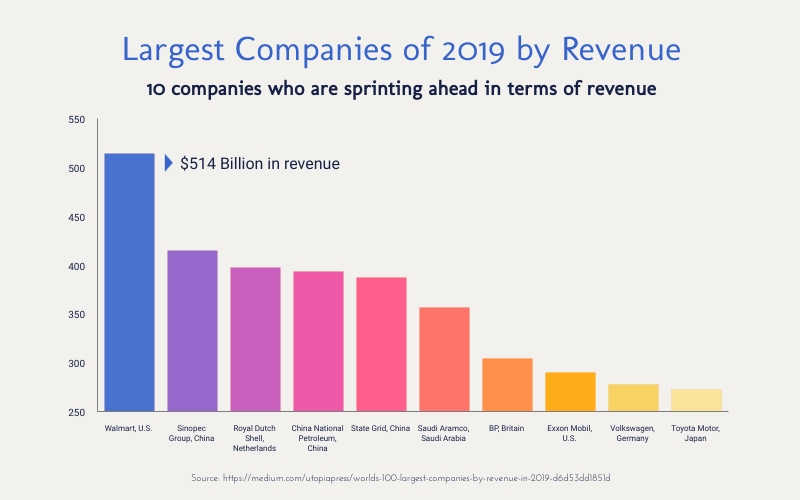
Largest Companies of 2019 by Revenue Bar Graph Template
Largest Companies of 2019 by Revenue Bar Graph Break down the numbers behind the most successful companies using this bar graph template. 
Best Selling Books Bar Graph Infographic Template
Best Selling Books Bar Graph Infographic Use this best selling books bar graph infographic template to illustrate different types of data.
Amount of Trans Fat in Different Food Bar Graph Template
Amount of Trans Fat in Different Food Bar Graph Showcase your findings and win over your audience using this bar graph template.
Most Searched How To in the U.S. Bar Graph Template
Most Searched How To in the U.S. Bar Graph Present data in a visually appealing and comprehensive way using this multi-colored, stacked bar graph.
Programming Languages Bar Graph Infographic Template
Programming Languages Bar Graph Infographic Inform your audience on the latest programming trends using this unique infographic template.
UK Employment by Occupation Bar Graph Template
UK Employment by Occupation Bar Graph Bring your research to life using this eye-catching bar graph template.
Global Temperature Variations Bar Graph Infographic Template
Global Temperature Variations Bar Graph Infographic Display large sets of data related to environment and nature in a meaningful way using this bar graph infographic template.
Instances of Second Hand Smoking Bar Graph Infographic Template
Instances of Second Hand Smoking Bar Graph Infographic Raise awareness of important causes, and engage with your core audience in an effective way using this bar graph infographic.
Usage Trends Pie Chart Infographic Template
Usage Trends Pie Chart Infographic Creatively present trends and research findings with this customizable pie chart infographic template.
Quarterly Sales of a Lemonade Stand Histogram Infographic Template
Quarterly Sales of a Lemonade Stand Histogram Infographic Use this quarterly sales of a lemonade stand histogram infographic to visually present your data.
Age of 2019s Richest People Histogram Infographic Template
Age of 2019s Richest People Histogram Infographic Illustrate frequencies in data in a creative way using this beautiful histogram infographic template. 
Monthly Expenses on Art Supplies Histogram Infographic Template
Monthly Expenses on Art Supplies Histogram Infographic Use this monthly expense on art supplies histogram infographic template to present frequencies in data in a visually meaningful way.
Monthly Customers of a Bookstore Histogram Infographic Template
Monthly Customers of a Bookstore Histogram Infographic Customize this monthly customer's histogram infographic template to present your data visually.