1. Home
  2. Create Infographics
  3. Infographic Templates
  4. The Weather Research and Forecasting Model Template

The Weather Research and Forecasting Model Template

Use This Template

Present the important historic events in the creation of the weather forecasting model with this infographic template. 

Illustrate historic events in chronological order, so people can learn to appreciate each technological advancement with the help of this fully customizable timeline infographic template. Featuring bold colors, data widgets, high-res images in the background and an overall stylish design layout, this template is ideal for a variety of topics.

  • Change color themes and font styles with a few clicks
  • Access millions of free graphics from inside the editor
  • Visualize data with custom widgets, maps and charts
  • Add interactivity like animation, hover effects and links
  • Download in JPG, PNG, PDF and HTML5 format
  • Share online with a link or embed it on your website

Click the button below to use this professionally-designed infographic template now, or if you are looking for more design ideas and categories, check out our collection of other professional templates.

Edit this template with our infographic maker!

The Weather Research and Forecasting Model Template

Template Specifications

  • Dimensions

    All infographic templates are 800 pixels wide with varying lengths. These dimensions can be easily changed and the length adjusted with a slider.

  • Customizable

    This template can be fully customized. You can edit content, change image(s), apply custom colors, input your own fonts and logo, and more.

  • Formats

    Download as a high resolution JPEG, PNG, PDF or HTML5, embed into a blog post or webpage, or generate a shareable link for online use.

Compatibility

Related Infographics

Company Journey Timeline Infographic Template
Company Journey Timeline Infographic Illustrate your company’s story from conception to present day using the company journey timeline infographic template.
Comparing Products Online - Infographic Template
Comparing Products Online - Infographic Help your readers know where to shop online for the best products with this sleek infographic template.
The Science Behind the Farm Bill Infographic Template
The Science Behind the Farm Bill Infographic Explain the science behind the farm bill with this colorful infographic template.
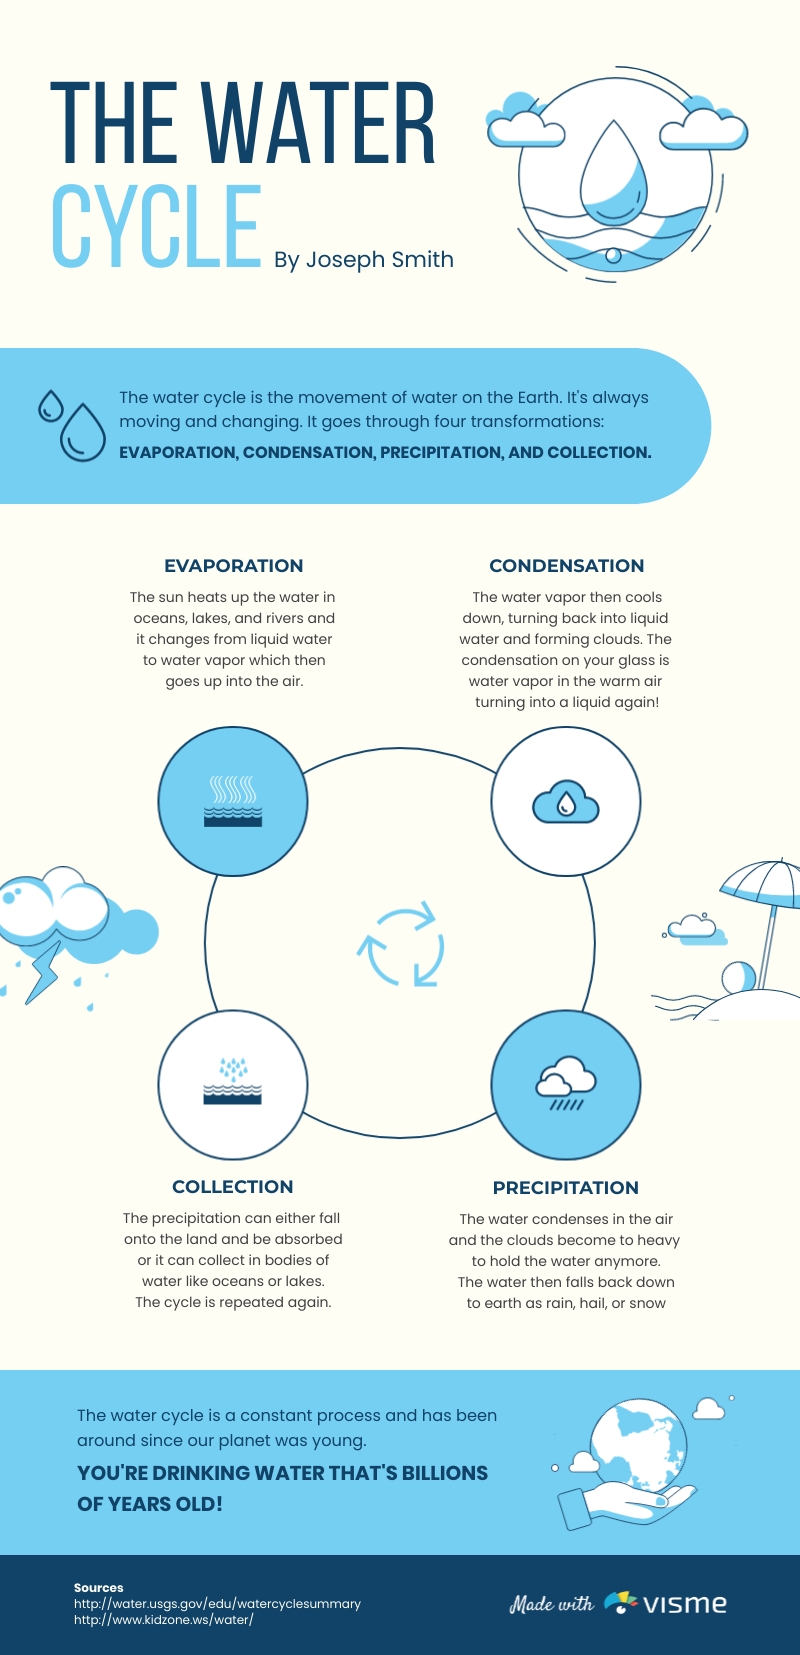
The Water Cycle Infographic Template
The Water Cycle Infographic Show the movement of water and its stages with this expressive water cycle infographic template.
Connecting with Nature Infographic Template
Connecting with Nature Infographic Use this infographic template to illustrate information related to environmental awareness and nature
Simple Ways to Save the Environment Infographic Template
Simple Ways to Save the Environment Infographic Educate your audience on ways to save the environment using this simple infographic template.
Environmental Factors Infographic Template
Environmental Factors Infographic Use this environmental-factors infographic template to educate people on nature and environmental topics.
Saving Energy Infographic Template
Saving Energy Infographic Educate people about environmental issues and create awareness with this saving energy infographic template.
The Recycling System Infographic Template
The Recycling System Infographic Show how recycling works with this nature-inspired recycling system template.
The Weather Forecast Infographic Template
The Weather Forecast Infographic Inform your audience about the weather in their region with this icy infographic template.
Energy Saving Tips Infographic Template
Energy Saving Tips Infographic Share tips on saving energy and making this world a better place with this infographic template.
Study Time vs Test Score Scatter Plot Infographic Template
Study Time vs Test Score Scatter Plot Infographic Present the correlation between two factors in a visual and meaningful way using this scatter plot template.
Hours Worked vs Sales Scatter Plot Template
Hours Worked vs Sales Scatter Plot Show the correlation between hours worked and sales with the help of this scatter plot template.
Instances of Second Hand Smoking Bar Graph Infographic Template
Instances of Second Hand Smoking Bar Graph Infographic Raise awareness of important causes, and engage with your core audience in an effective way using this bar graph infographic.
Global Temperature Variations Bar Graph Infographic Template
Global Temperature Variations Bar Graph Infographic Display large sets of data related to environment and nature in a meaningful way using this bar graph infographic template.
Monthly Climate Trend in Japan Line Graph Infographic Template
Monthly Climate Trend in Japan Line Graph Infographic Bring your data to life by presenting it visually using this climate trends line graph infographic template.
Ice Cream Shop Sales Scatter Plot Infographic Template
Ice Cream Shop Sales Scatter Plot Infographic Make your reports and presentations more impactful by adding this beautiful scatter plot infographic template.
Average Annual Temperature Histogram Infographic Template
Average Annual Temperature Histogram Infographic Present frequency distributions in a meaningful way using this temperature histogram infographic template.
Ecommerce Website Project Milestones Infographic Template
Ecommerce Website Project Milestones Infographic Customize this sleek e-commerce website project milestone to keep track of your project progress.
2nd Grade Homeschooling Schedule Infographic Template
2nd Grade Homeschooling Schedule Infographic Keep track of your child’s schedule when homeschooling with this straightforward template.