1. Home
  2. Create Infographics
  3. Infographic Templates
  4. Presidential Debates Pie Chart Infographic Template

Presidential Debates Pie Chart Infographic Template

Use This Template

Customize this political pie chart infographic template to present all your findings in a creative way.

This editable presidential debates pie chart infographic template features beautiful, professional-looking colors and a circle graph that showcases political findings. You can customize this pie chart template for any industry or purpose.

Use this bite-sized infographic template as part of a presentation or report, or use it as a standalone infographic.

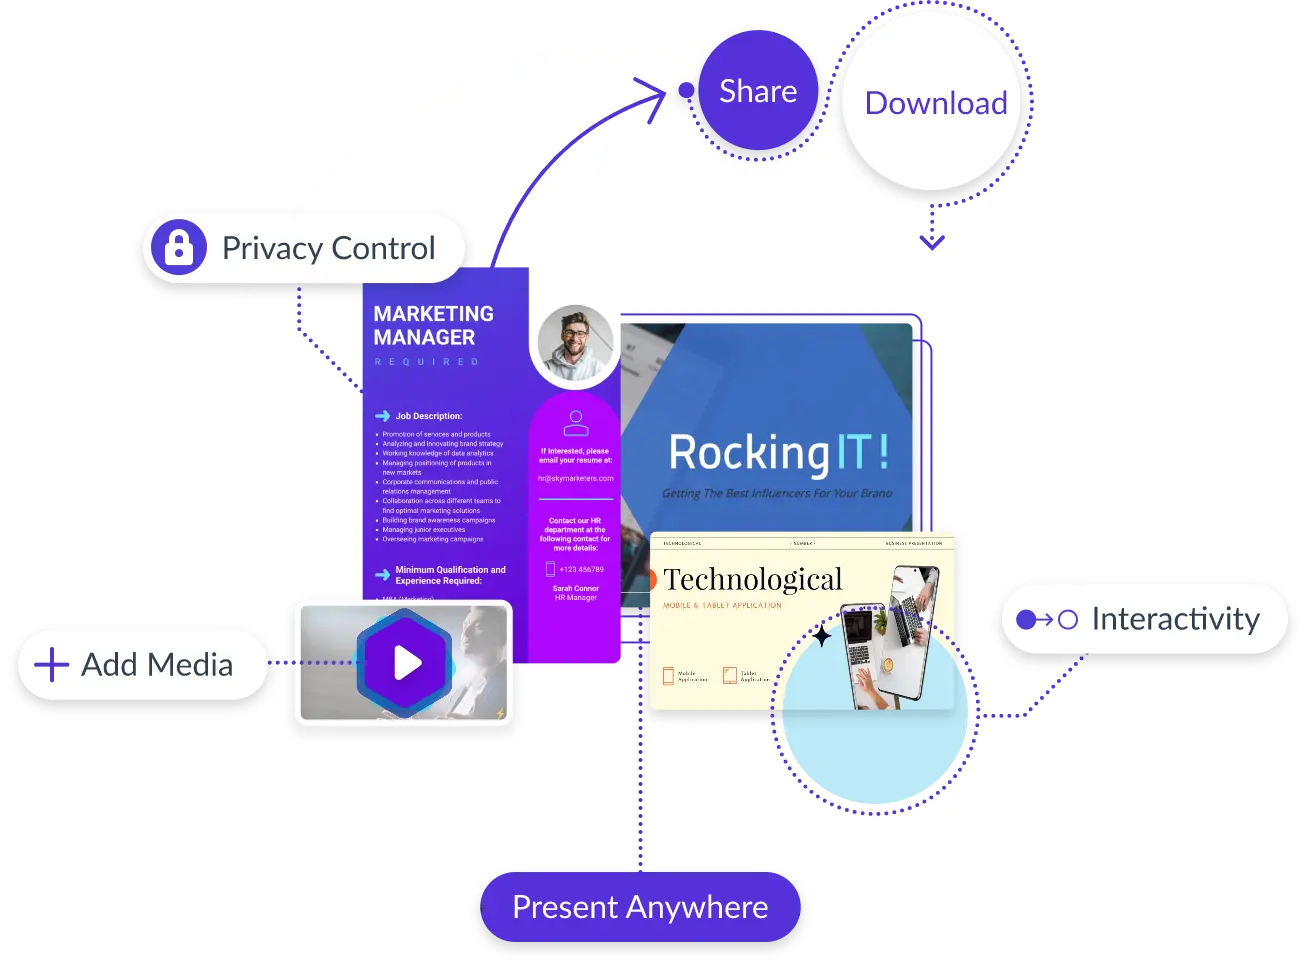
  • Change color themes and font styles with a few clicks
  • Access millions of free graphics from inside the editor
  • Visualize data with custom widgets, maps and charts
  • Add interactivity like animation, hover effects and links
  • Download in JPG, PNG, PDF and HTML5 format
  • Share online with a link or embed it on your website

Start customizing this presidential debates pie chart infographic template today or browse through other customizable templates to find the best one for you.

Edit this template with our infographic maker!

Presidential Debates Pie Chart Infographic Template
Template Specifications
  • Dimensions

    All infographic templates are 800 pixels wide with varying lengths. These dimensions can be easily changed and the length adjusted with a slider.

  • Customizable

    This template can be fully customized. You can edit content, change image(s), apply custom colors, input your own fonts and logo, and more.

  • Formats

    Download as a high resolution JPEG, PNG, PDF or HTML5, embed into a blog post or webpage, or generate a shareable link for online use.

Compatibility

Related Infographics

Budget Pie Chart Infographic Template
Budget Pie Chart Infographic Visualize your business’s monthly or quarterly estimated expenses using this budget pie chart infographic.
Average Student Budget Pie Chart Template
Average Student Budget Pie Chart Use this colorful student budget pie chart to present proportions in different datasets.
Shoppers Online Infographic Template
Shoppers Online Infographic Illustrate data from your company sales or research findings using this online shopping pie chart template.
Global Smartphone Sales Pie Chart Template
Global Smartphone Sales Pie Chart Share your research in an impactful manner using this sales pie chart template.
Sports Brand Pie Chart Infographic Template
Sports Brand Pie Chart Infographic Present proportions in different types of datasets using this colorful sports brand pie chart infographic.
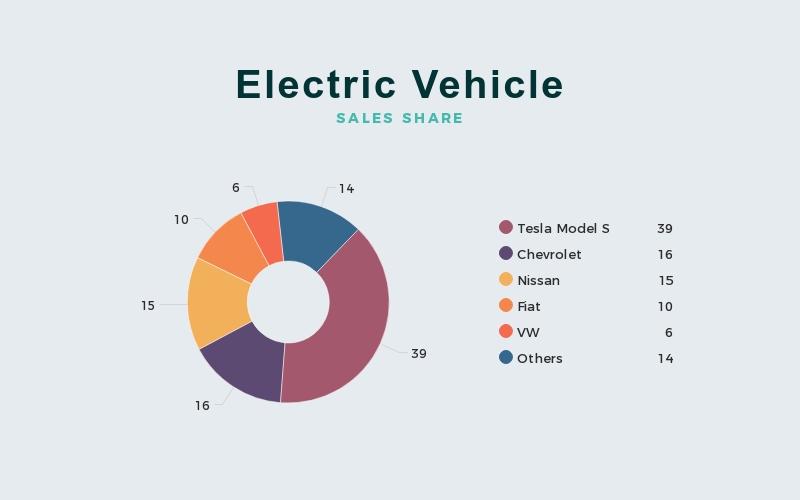
Electric Vehicle Pie Chart Infographic Template
Electric Vehicle Pie Chart Infographic Present your research findings in an attractive way with this simple pie chart infographic template.
Market Share Pie Chart Infographic Template
Market Share Pie Chart Infographic Transform research findings into engaging visuals with this business pie chart infographic template.
Usage Trends Pie Chart Infographic Template
Usage Trends Pie Chart Infographic Creatively present trends and research findings with this customizable pie chart infographic template.
Technology Use Template
Technology Use Highlight the most popular internet-using countries with the help of this infographic template.
Visual Automation Percentage Infographic Template
Visual Automation Percentage Infographic Reveal intriguing statistics about content creators using this refined infographic template.
Visuals in Marketing Infographic Template
Visuals in Marketing Infographic Educate your audience on marketing tendencies with this trendy infographic template.
Visuals in Marketing Infographic Template
Visuals in Marketing Infographic Take a unique approach to share marketing statistics with this dynamic infographic template.
Patients and Charts Infographic Template
Patients and Charts Infographic Productively relay information by sharing this eye-opening infographic template.
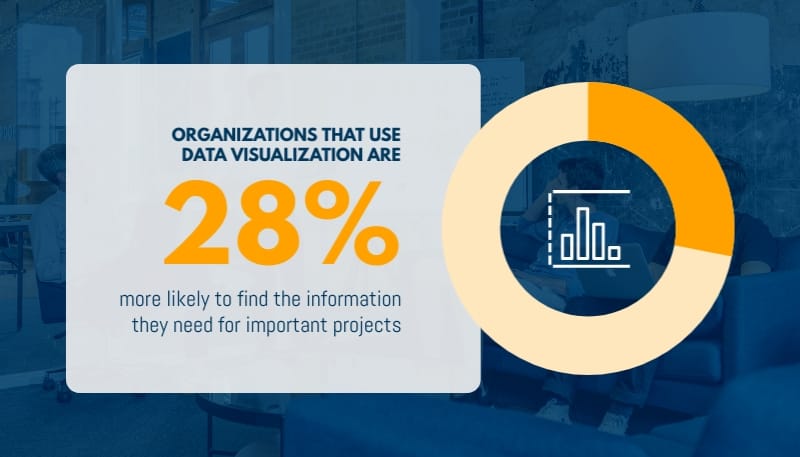
Data Visuals for Organizations Infographic Template
Data Visuals for Organizations Infographic Emphasize the benefits of using visuals in content with this groundbreaking infographic template.
Visuals in Research Infographic Template
Visuals in Research Infographic Improve documents’ readability with this unique infographic template’s guidance.
Quarterly Sales of a Lemonade Stand Histogram Infographic Template
Quarterly Sales of a Lemonade Stand Histogram Infographic Use this quarterly sales of a lemonade stand histogram infographic to visually present your data.
Age of 2019s Richest People Histogram Infographic Template
Age of 2019s Richest People Histogram Infographic Illustrate frequencies in data in a creative way using this beautiful histogram infographic template. 
Monthly Expenses on Art Supplies Histogram Infographic Template
Monthly Expenses on Art Supplies Histogram Infographic Use this monthly expense on art supplies histogram infographic template to present frequencies in data in a visually meaningful way.
Monthly Customers of a Bookstore Histogram Infographic Template
Monthly Customers of a Bookstore Histogram Infographic Customize this monthly customer's histogram infographic template to present your data visually.