1. Home
  2. Create Infographics
  3. Infographic Templates
  4. Define the Problem Infographic Template

Define the Problem Infographic Template

Use This Template

Outline the steps to defining a problem with this eye-catching infographic.

The first step to solving any problem is defining it. Now you can highlight how to effectively identify and define problems with this attractive visual aid. Use this infographic as-designed or make it your own by adding in elegant fonts, stock images and high-quality icons. 

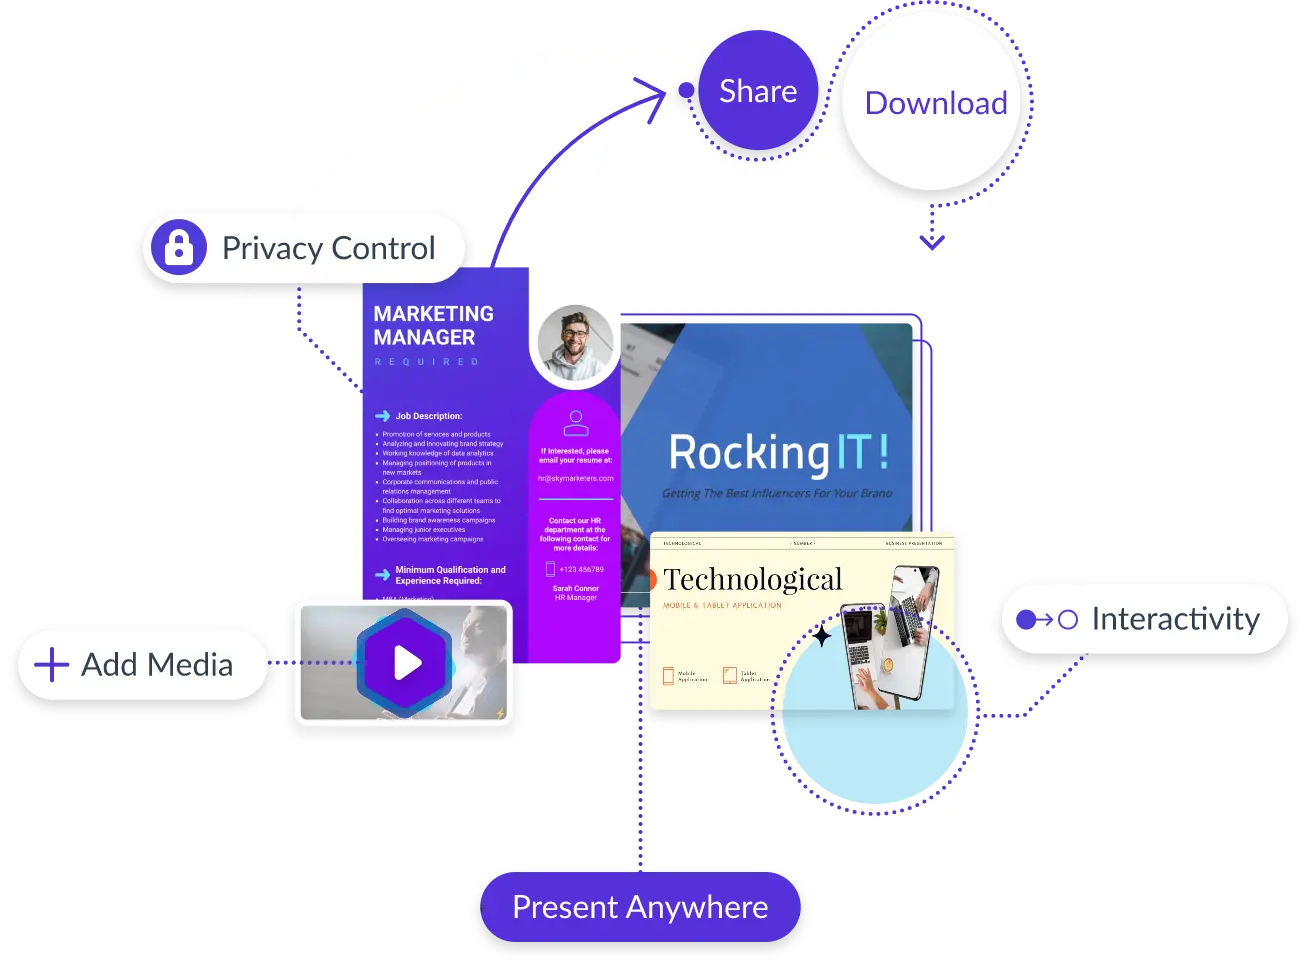
  • Change color themes and font styles with a few clicks
  • Access millions of free graphics from inside the editor
  • Visualize data with custom widgets, maps and charts
  • Add interactivity like animation, hover effects and links
  • Download in JPG, PNG, PDF and HTML5 format
  • Share online with a link or embed it on your website

Get started editing this attractive infographic today, or browse through our collection of 1,000+ professional infographic templates for more design ideas.

Edit this template with our infographic maker!

Define the Problem Infographic Template
Template Specifications
  • Dimensions

    All infographic templates are 800 pixels wide with varying lengths. These dimensions can be easily changed and the length adjusted with a slider.

  • Customizable

    This template can be fully customized. You can edit content, change image(s), apply custom colors, input your own fonts and logo, and more.

  • Formats

    Download as a high resolution JPEG, PNG, PDF or HTML5, embed into a blog post or webpage, or generate a shareable link for online use.

Compatibility

Related Infographics
What is Design Thinking Infographic Template
What is Design Thinking Infographic Showcase the thought process behind the exceptional design with this attractive infographic.
Process of Prototyping Infographic Template
Process of Prototyping Infographic Highlight the ideal process for creating a prototype with this stunning infographic.
Design Thinking Ideate Infographic Template
Design Thinking Ideate Infographic Showcase the four pillars of coming up with a great design idea with this beautiful infographic.
Design Thinking Test Infographic Template
Design Thinking Test Infographic Outline the steps of effective design with this stunning infographic.
Onboarding Process for Remote Employees Infographic Template
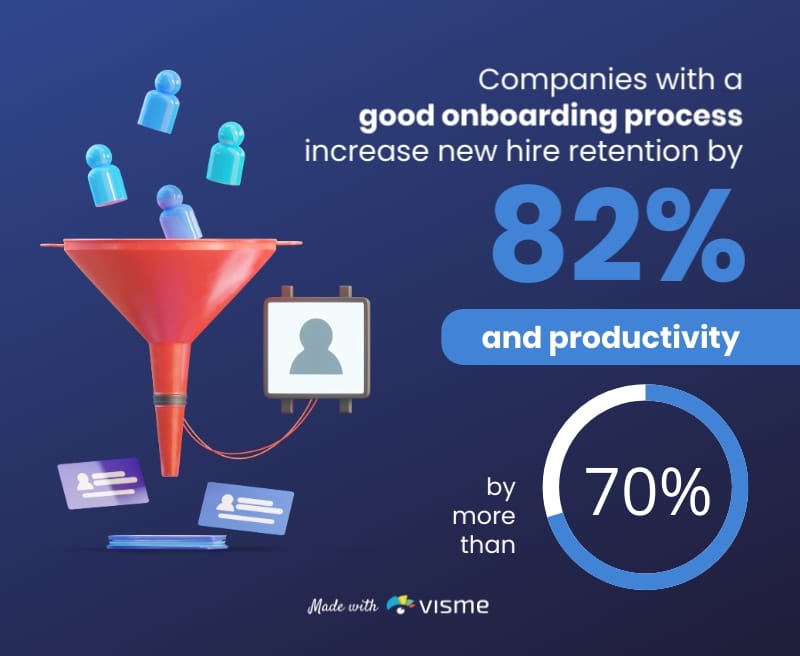
Onboarding Process for Remote Employees Infographic Showcase the process of employee onboarding with the help of this cool bite-sized infographic template.
Brain and Visual Processing Infographic Template
Brain and Visual Processing Infographic Shed light on how our brains react to visuals in content using this symmetrical infographic template.
Color vs Black and White Infographic Template
Color vs Black and White Infographic Underscore the impact of colorful messages using this vibrant infographic template.
Subliminal Message Semantic Network - Infographic Template
Subliminal Message Semantic Network - Infographic Help your audience understand subliminal messaging with this concise infographic template.
Subliminal Message How Does It Work Infographic Template
Subliminal Message How Does It Work Infographic Clearly explain subliminal messaging with the help of this eye-catching infographic template.
Data Storytelling Infographic Template
Data Storytelling Infographic This stunning infographic shows how to transform data into an engaging brand story.
Limited Attention Infographic Template
Limited Attention Infographic Share startling statistics about attention span using this engaging infographic template.
Common Distractions Readers Face Infographic Template
Common Distractions Readers Face Infographic Educate your audience on common distractions using this eye-catching infographic template.
Three Challenges for Impactful Content Infographic Template
Three Challenges for Impactful Content Infographic Highlight challenges that your audience faces to gain their attention with this infographic template.
Facebook Demographics Histogram Infographic Template
Facebook Demographics Histogram Infographic Illustrate distributions in data in a visual and appealing way using this demographics histogram infographic.
Monthly Active Users of an App Line Graph Infographic Template
Monthly Active Users of an App Line Graph Infographic Present data in a creative and visual way by editing this monthly active users line graph infographic template.
Product Trends Line Graph Infographic Template
Product Trends Line Graph Infographic Boost your market research reports by adding interactive charts to illustrate data in a meaningful way using this line graph infographic template.
Simple Bite Sized Infographic Template
Simple Bite Sized Infographic Visually display a simple data set with this customizable bite-sized infographic template from Visme.
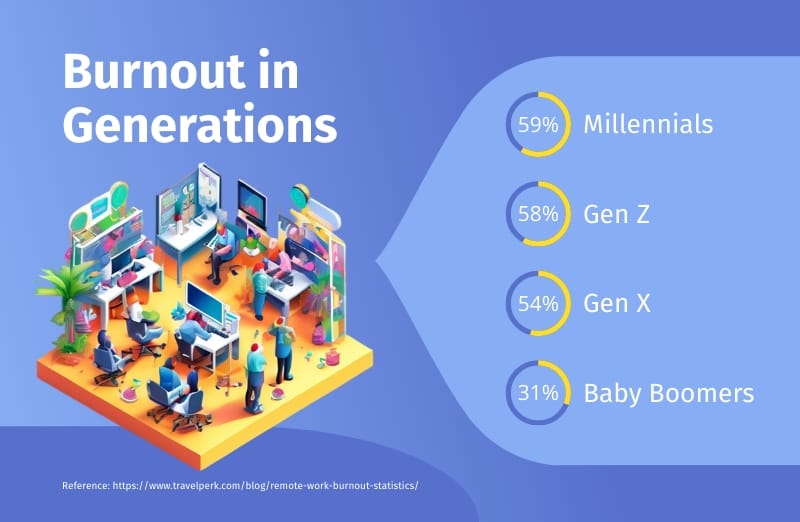
Employee Burnout Bite Sized Infographic Template
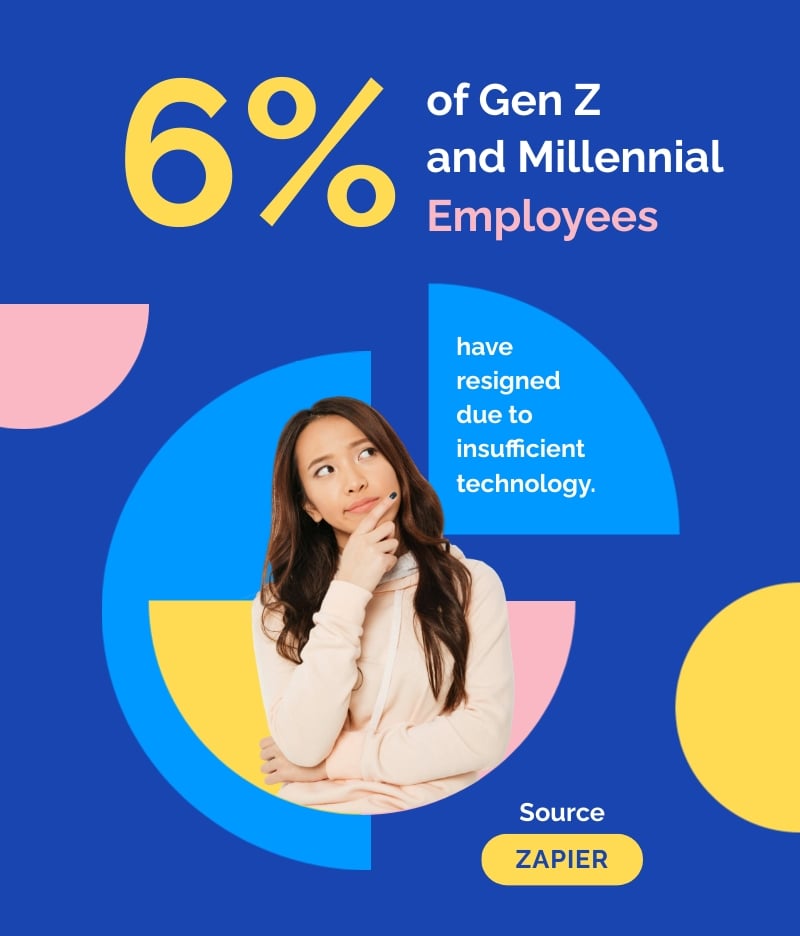
Employee Burnout Bite Sized Infographic Share data about a specific phenomenon or situation using this employee burnout bite sized infographic template.
The Three Stages of a Product Launch Infographic Template
The Three Stages of a Product Launch Infographic Bring your research to life with the help of this creative bite-sized infographic template.