1. Home
  2. Create Infographics
  3. Infographic Templates
  4. Daily Calories Pie Chart Infographic Template

Daily Calories Pie Chart Infographic Template

Use This Template

Customize this nutrition pie chart template to illustrate data in a creative and visually appealing way.

With a solid background and multiple colors to present each proportion, this pie chart template can be used for all types of data regardless of the industry. You can simply replace the placeholder data of the pie chart by linking your Excel or Google Sheets. 

Personalize this pie chart template using Visme’s library of built-in resources including thousands of high-quality vector icons and stock photos. 

  • Change color themes and font styles with a few clicks
  • Access millions of free graphics from inside the editor
  • Visualize data with custom widgets, maps and charts
  • Add interactivity like animation, hover effects and links
  • Download in JPG, PNG, PDF and HTML5 format
  • Share online with a link or embed it on your website

Click the button below to start editing this pie chart infographic template now or check out our collection of creative infographic templates.

Edit this template with our infographic maker!

Daily Calories Pie Chart Infographic Template

Template Specifications

  • Dimensions

    All infographic templates are 800 pixels wide with varying lengths. These dimensions can be easily changed and the length adjusted with a slider.

  • Customizable

    This template can be fully customized. You can edit content, change image(s), apply custom colors, input your own fonts and logo, and more.

  • Formats

    Download as a high resolution JPEG, PNG, PDF or HTML5, embed into a blog post or webpage, or generate a shareable link for online use.

Compatibility

Related Infographics

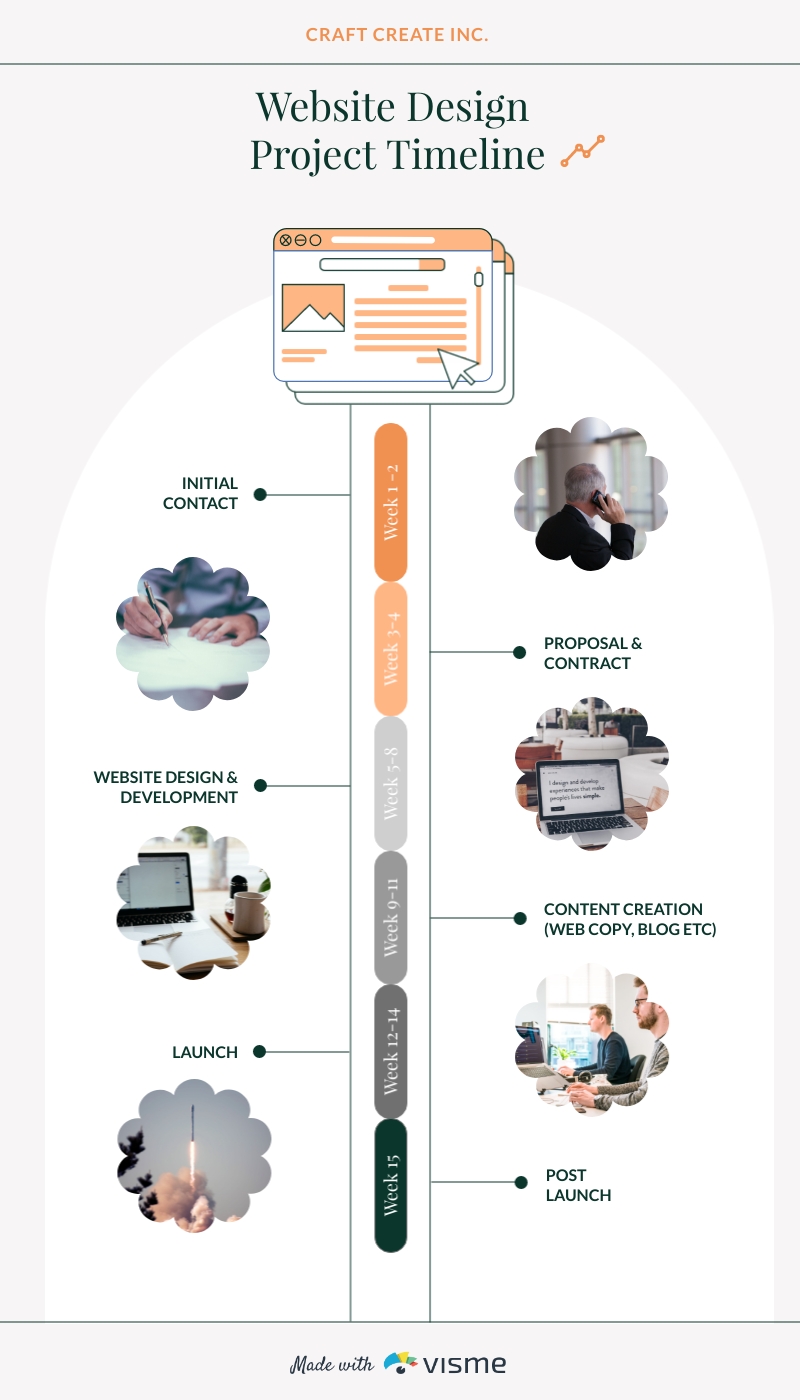
Website Design Project Timeline Infographic Template
Website Design Project Timeline Infographic Guide businesses through the typical timeline of a website design with this elegant infographic template.
Are Employers Responsible for Workers Financial Wellness? Template
Are Employers Responsible for Workers Financial Wellness? Easily create an infographic for your content strategy by opening this template and customizing it online.
Global Trust Levels in Business and Governments Template
Global Trust Levels in Business and Governments Bring people’s attention to important political stats with the help of this infographic template.
Survey: Social Networks in the Workplace Around the World (1) Statistical Infographic Template
Survey: Social Networks in the Workplace Around the World (1) Statistical Infographic Visualize survey results about social networks by personalizing this infographic template and integrating it with your content.
List of Common Things Infographic Template
List of Common Things Infographic Turn simple lists into beautiful, comprehensible infographics using this list infographic template.
Strategy Analysis Infographic Template
Strategy Analysis Infographic Outline every detail of your strategy with this eye-catching infographic.
Product Comparison Chart Infographic Template
Product Comparison Chart Infographic Create a compelling and comprehensive comparison table using this product comparison chart infographic template.
Concentric Doughnut Chart Infographic Template
Concentric Doughnut Chart Infographic Use this concentric doughnut chart to present fun stats and figures about your industry in a visually comprehensive manner.
Startup Funding Infographic Template
Startup Funding Infographic Use this startup funding infographic template to summarize facts and figures related to step-by-step processes of achieving something.
Vertical Facts List Infographic Template
Vertical Facts List Infographic Make a list of important facts and data for your audience by using this vertical facts list infographic template.
Financial Wellness Infographic Template
Financial Wellness Infographic Illustrate facts and figures and summarize data and statistics using this financial wellness infographic template.
Survey Results Infographic Template
Survey Results Infographic Illustrate your survey results and bring the most out of your data using this survey results infographic template.
Comparison Report - Infographic Template
Comparison Report - Infographic Create an easy-to-understand comparison between different products using this comparison report infographic template.
App Usage Comparison - Infographic Template
App Usage Comparison - Infographic Compare different datasets using charts and progress bars with this app-usage comparison infographic template.
Strategy Diagram Infographic Template
Strategy Diagram Infographic Highlight your strategies and create a visually comprehensive flowchart using this strategy diagram infographic template.
Ipads In The Classroom: Changing The Face of Education Template
Ipads In The Classroom: Changing The Face of Education Showcase the positive impact of technology on education by using this eye-catching infographic template.
8 Scary Food-Drug Interactions Infographic Template
8 Scary Food-Drug Interactions Infographic Communicate important information in a visual way with this customizable health infographic template.
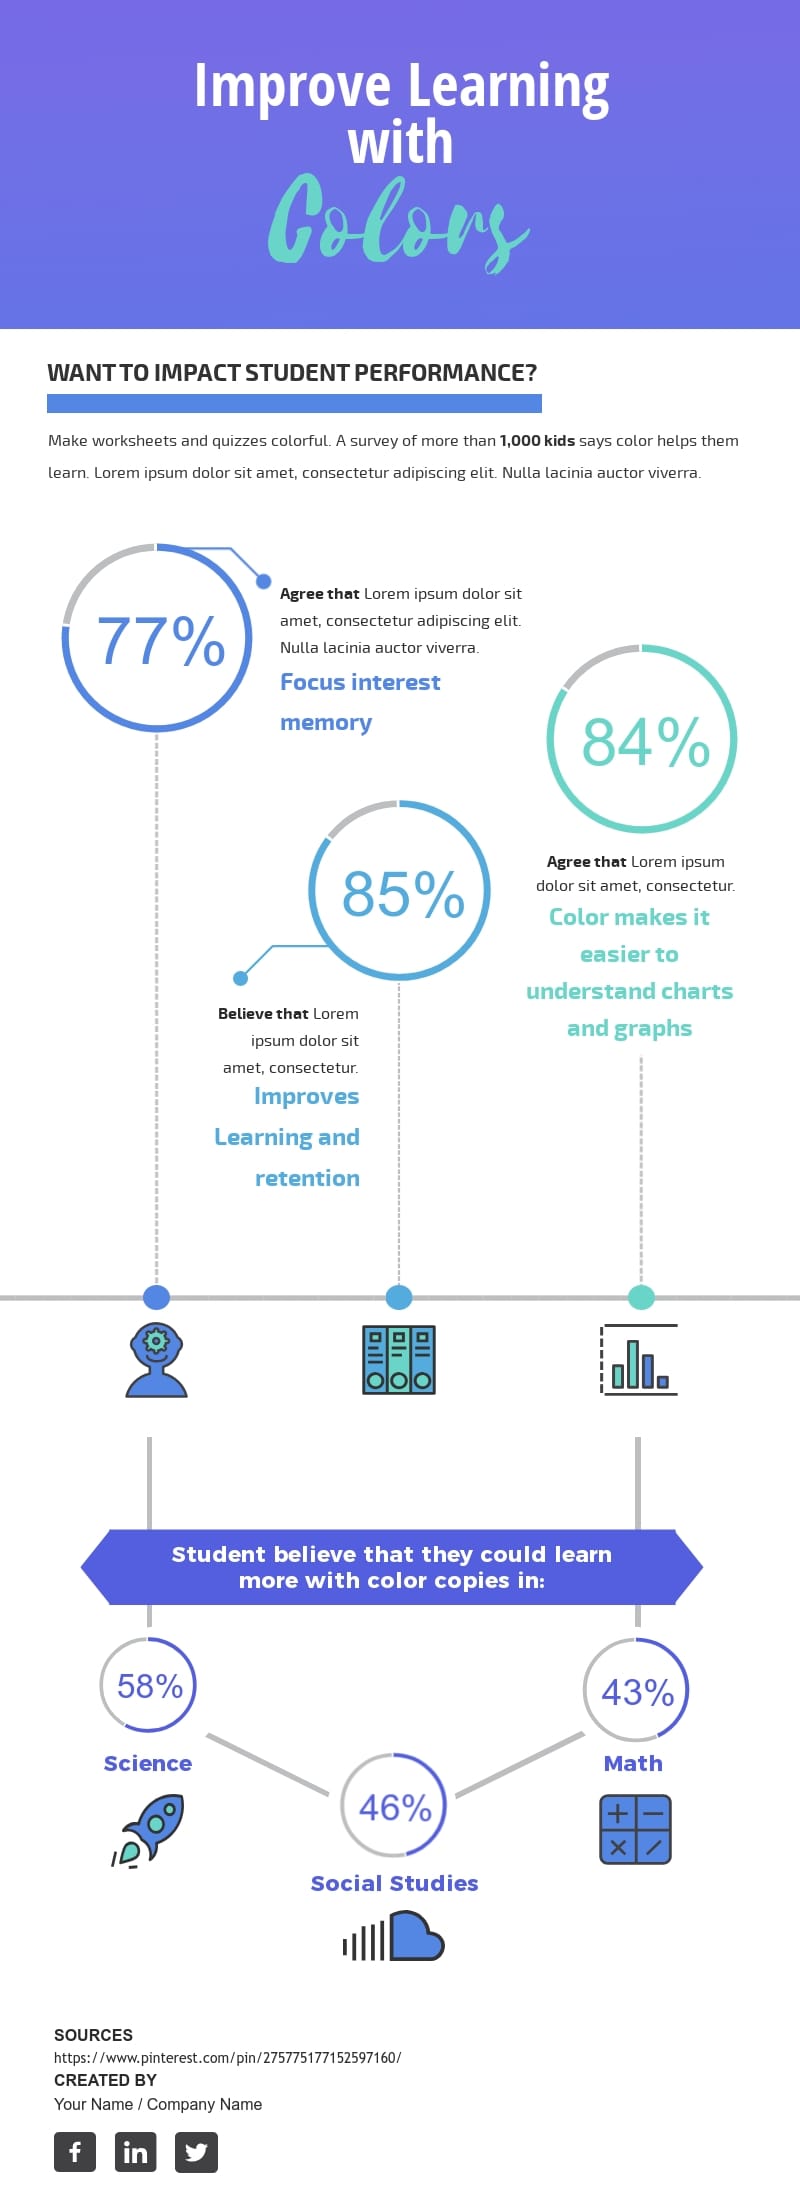
Learning with Colors Infographic Template
Learning with Colors Infographic Show statistical data on how you can improve learning with colors using this basic infographic template.
Undergraduate Map - Infographic Template
Undergraduate Map - Infographic Plan out your undergraduate experiences with this expressive map template.
Remarketing Process Infographic Template
Remarketing Process Infographic Walk your audience through each step with this creative remarketing process infographic template.