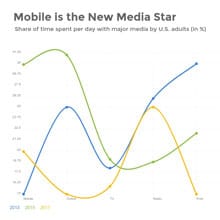
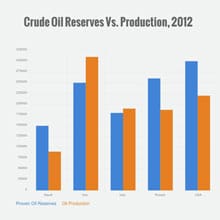
Top 10 Products By Revenue Bar Graph Template
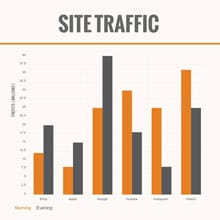
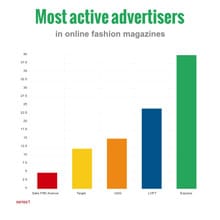
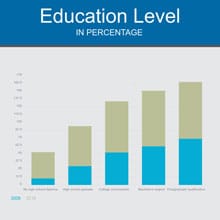
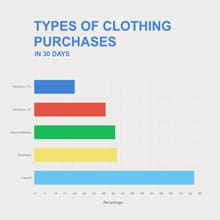
Use This TemplateIllustrate different proportions in data using colorful stacked bars with this revenue bar graph template.
This professional bar graph can be a good addition to all types of presentations and reports and is a smart choice for solo use as well. You can add your data by editing the placeholder data manually or by importing Excel workbooks or linking Google sheets.
Visme’s user friendly editor allows you to choose between a variety of charts and graphs so you can easily replace the bar graph in this template with any other chart keeping everything else as it is. You can change the colors of the columns according to your choice and use an image instead of a solid background from Visme’s library of 1,000,000+ stock photos.
Download this bar chart in different formats for offline use. You can also link this graph in your social media posts or embed it in newsletters, marketing emails or websites.
Start editing this professional bar chart template by clicking the button below. Check out our collection of other professional templates to explore more ideas.
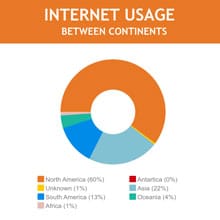
Edit this template with our pie chart maker!
-
Dimensions
All chart templates come in two sizes: horizontal (1920 x 1080 pixels) and square (800 x 800 pixels)
-
Customizable
This chart template can be fully customized. You can edit content, change image(s), apply custom colors, add or subtract pages and more.
-
Formats
Can be shared as public or private link online, embedded to a site or blog, or downloaded as JPG, PNG, PDF or HTML5. If downloaded as an image, you can also insert into other documents and presentations.
Related Charts & Graphs
