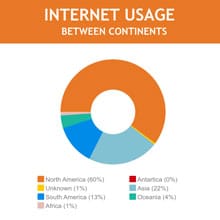
Technology Use Pie Chart Template
Use This TemplateIllustrate quantities and proportions in data visually using this customizable technology pie chart template.
The template can be used on its own to summarize data using a pie chart with an easy to understand legend, or combined with presentations, reports and proposals. The monochromatic color theme of the template gives it an elegant and professional look. Use it to present data related to technology and science or edit it according to your own industry.
Use our library of 10,000+ vector icons and 1,000,000+ stock photos or your brand’s own fonts, logo and color themes to customize this template. Add new blocks to turn this chart template into an infographic combining with other templates and charts to communicate your data the most.
Download the pie chart in JPG, PNG, PDF, PPTX and HTML5 formats and combine it with your presentations or reports. You can also generate a shareable link and forward to your team members if you want to share the chart privately.
Click the button below to use this pie chart template now. If you are looking for more design ideas and categories, check out our collection of other professional templates.
Edit this template with our pie chart maker!
-
Dimensions
All chart templates come in two sizes: horizontal (1920 x 1080 pixels) and square (800 x 800 pixels)
-
Customizable
This chart template can be fully customized. You can edit content, change image(s), apply custom colors, add or subtract pages and more.
-
Formats
Can be shared as public or private link online, embedded to a site or blog, or downloaded as JPG, PNG, PDF or HTML5. If downloaded as an image, you can also insert into other documents and presentations.
Related Charts & Graphs
