Report Users Donut Chart Template
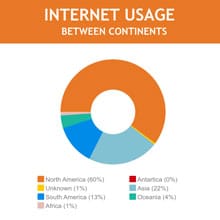
Use This TemplateLooking for a simple donut chart to categorize your findings? Customize this report users chart template now.
This clean and professional donut chart template is a great pick to present your findings in a visual way. You can use it as part of your presentation or report, or turn it into an infographic by adding some more images and vector icons to share on social media or print out as a hard copy.
You can change the colors and font styles in this report user donut chart template using Visme’s built in resources or replace them with your own colors, fonts, logo and text. Add interactive links and hover effects to make your chart more engaging, or add some animation to spruce things up a bit, especially if you plan on publishing it online.
Download this chart template for offline use in multiple formats, share it online with your audience, or embed it on your website or blog.
Get started with this donut chart template today or look through Visme’s library of a wide range of professionally designed templates to find your ideal fit.
Edit this template with our pie chart maker!
Template Specifications
-
Dimensions
All chart templates come in two sizes: horizontal (1920 x 1080 pixels) and square (800 x 800 pixels)
-
Customizable
This chart template can be fully customized. You can edit content, change image(s), apply custom colors, add or subtract pages and more.
-
Formats
Can be shared as public or private link online, embedded to a site or blog, or downloaded as JPG, PNG, PDF or HTML5. If downloaded as an image, you can also insert into other documents and presentations.
Compatibility
Related Charts & Graphs


