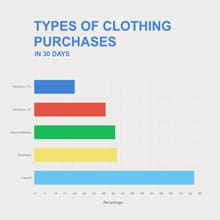
Clothing Purchases Bar Graph Template
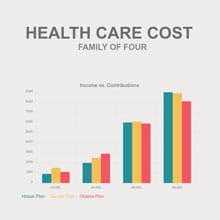
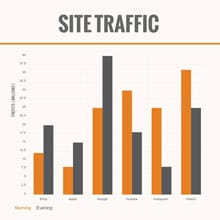
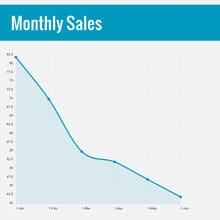
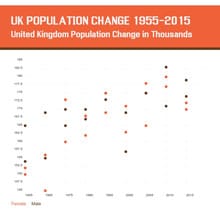
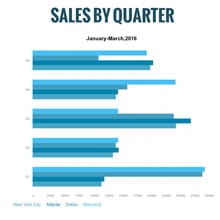
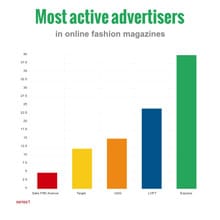
Use This TemplateVisualize your store’s purchase data and statistics using this 30 days purchase bar graph template.
If you own an ecommerce website, selling products online or offline, this 30 days purchase bar graph is a great choice for you to visualize your purchase data using a horizontal bar graph. Customize it however you want to fit to your industry or topic.
You can turn this simple chart template into an infographic by adding visuals from our library of 10,000+ vector icons and 1,000,000+ stock photos. Add new blocks to combine this template with other charts, experiment with different color themes and a variety of other graphic tools to level up this simple bar graph.
Download this professional chart template in JPG, PNG, PDF, PPTX and HTML5 formats and combine it with reports, presentations and proposals. You can also share the chart privately by generating a link or embed it in your webpages for public sharing.
Click “Use this Template” to get started or check out our collection of other professional templates to explore more ideas.
Edit this template with our pie chart maker!
-
Dimensions
All chart templates come in two sizes: horizontal (1920 x 1080 pixels) and square (800 x 800 pixels)
-
Customizable
This chart template can be fully customized. You can edit content, change image(s), apply custom colors, add or subtract pages and more.
-
Formats
Can be shared as public or private link online, embedded to a site or blog, or downloaded as JPG, PNG, PDF or HTML5. If downloaded as an image, you can also insert into other documents and presentations.
Related Charts & Graphs
