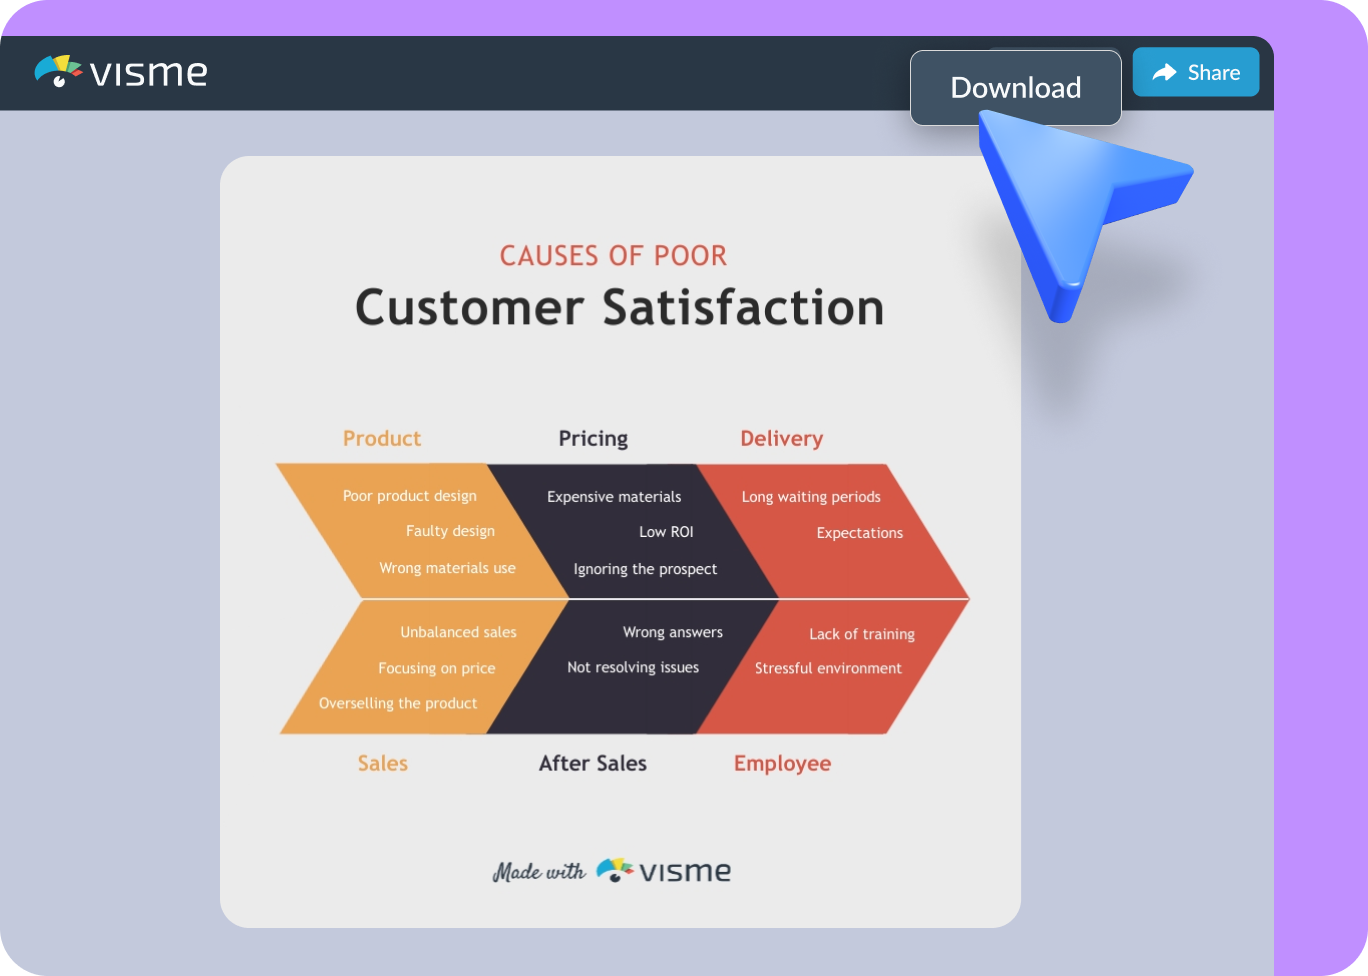
Create Fishbone Diagrams
for Effective Problem Solving
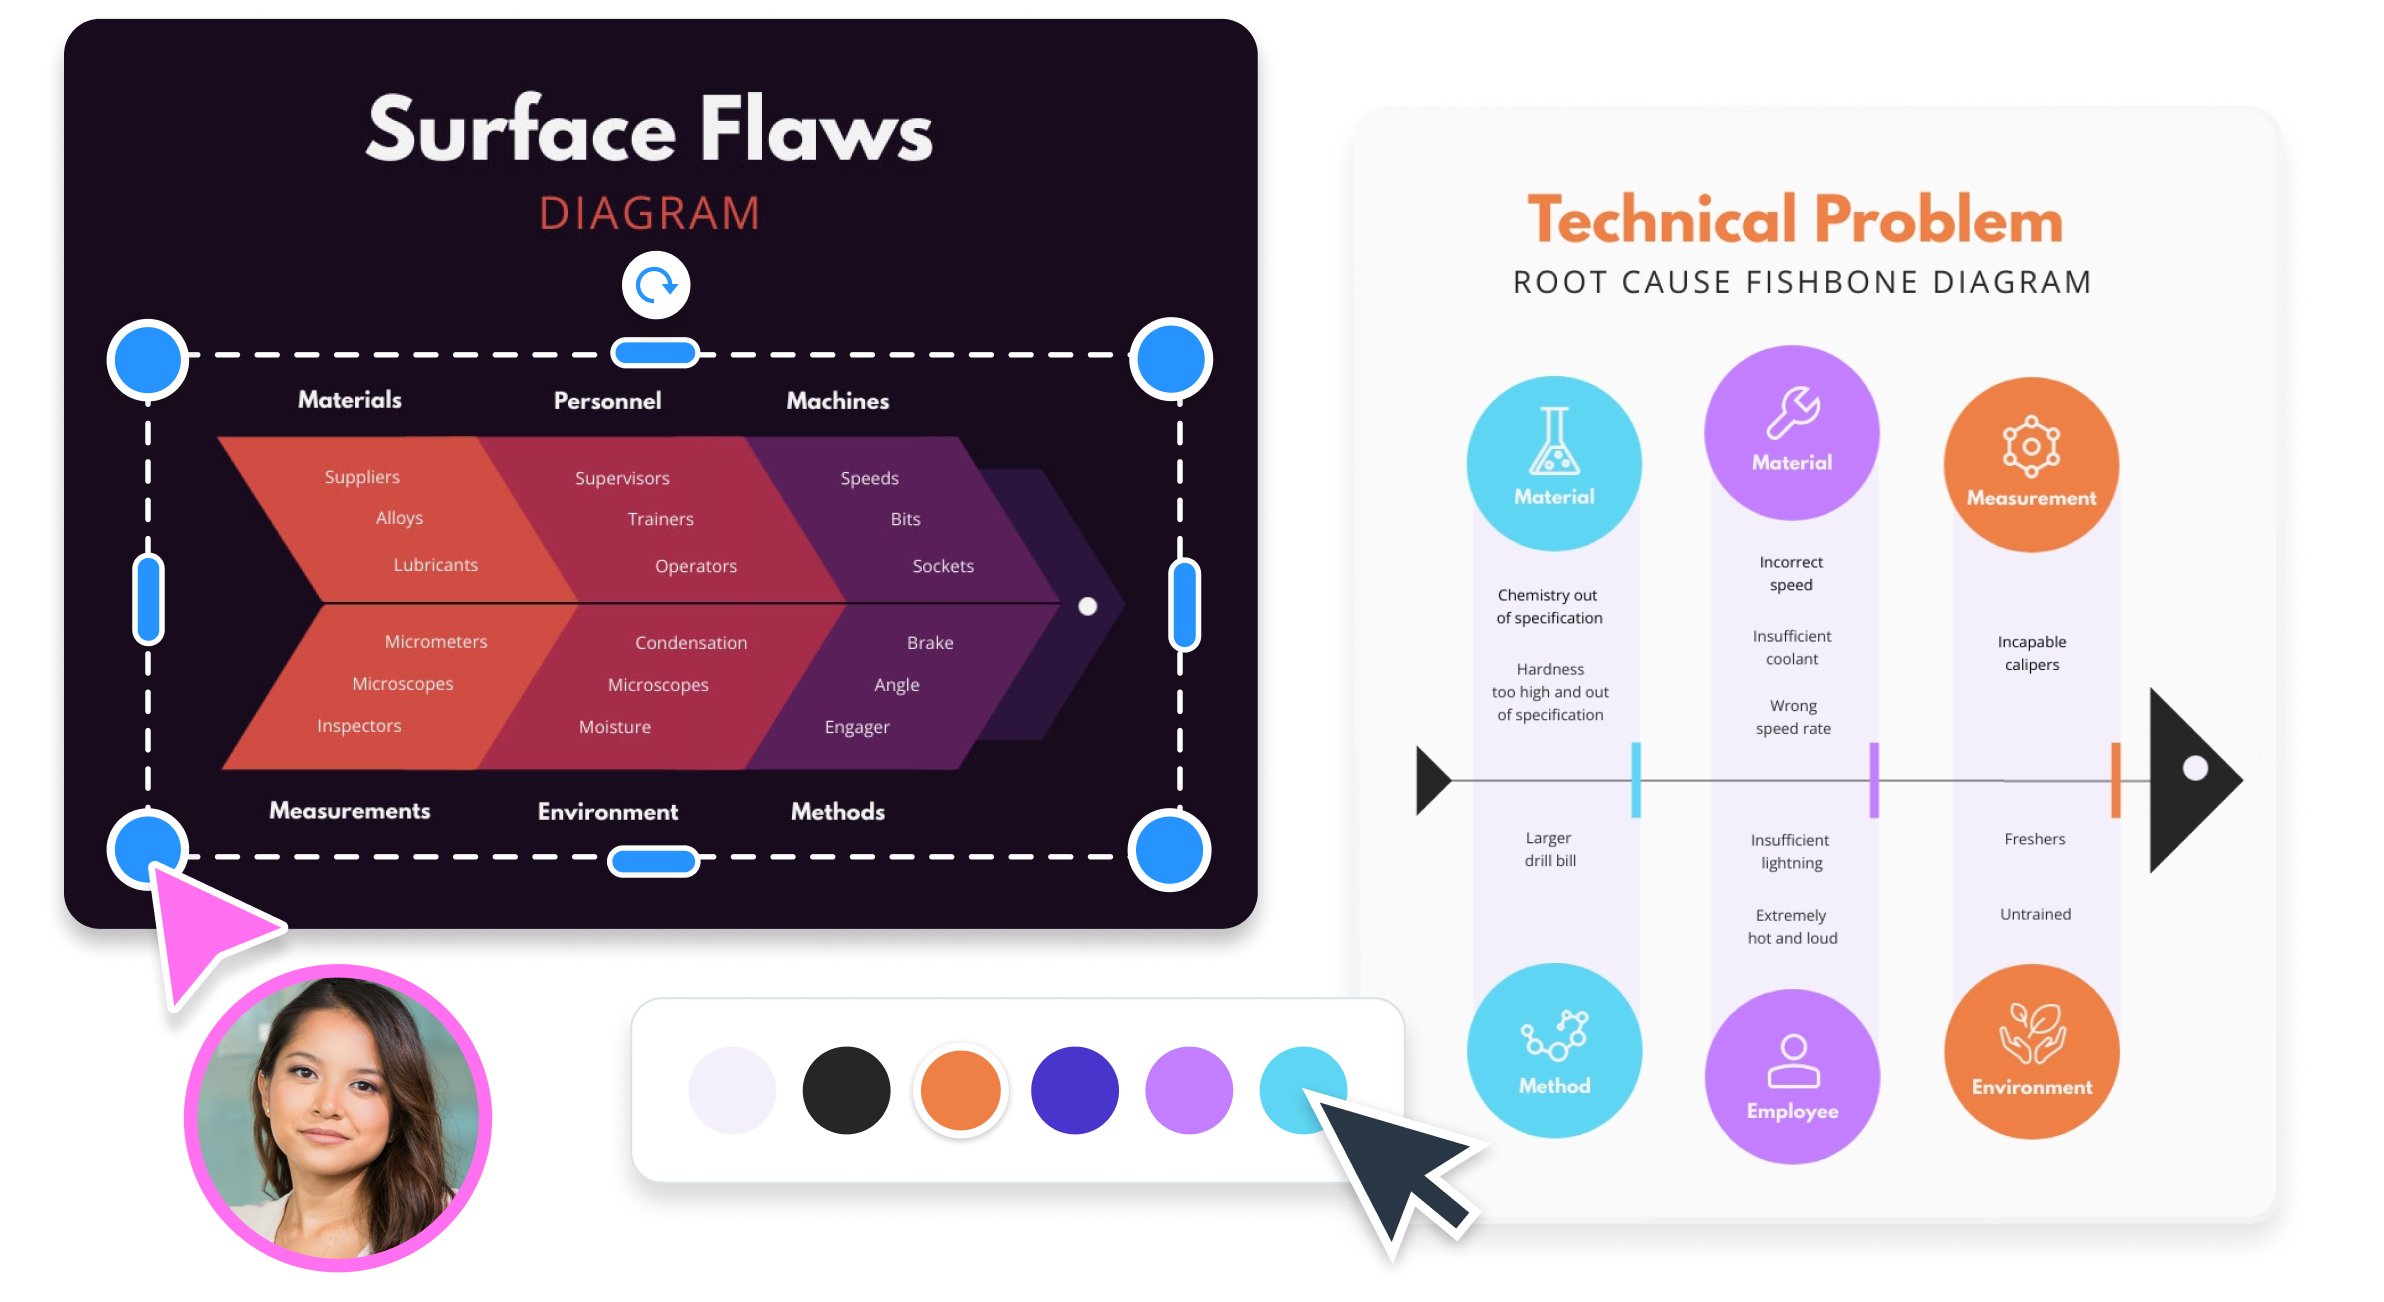
It’s free to sign up and easy to use.
Use Visme's fishbone diagrams to brainstorm, identify root causes and strategize solutions.
Choose a template that suits your industry or problem type and customize it to your needs.
Invite your team to contribute directly to the fishbone diagram, fostering real-time discussion and idea generation.
Upgrade to save your fishbone diagram as a PNG, JPG or PDF, or share it online for instant feedback and collaboration.
The leading visual communication platform empowering 34,300,000 users and top brands.
Easy to edit
Fishbone Diagram Templates
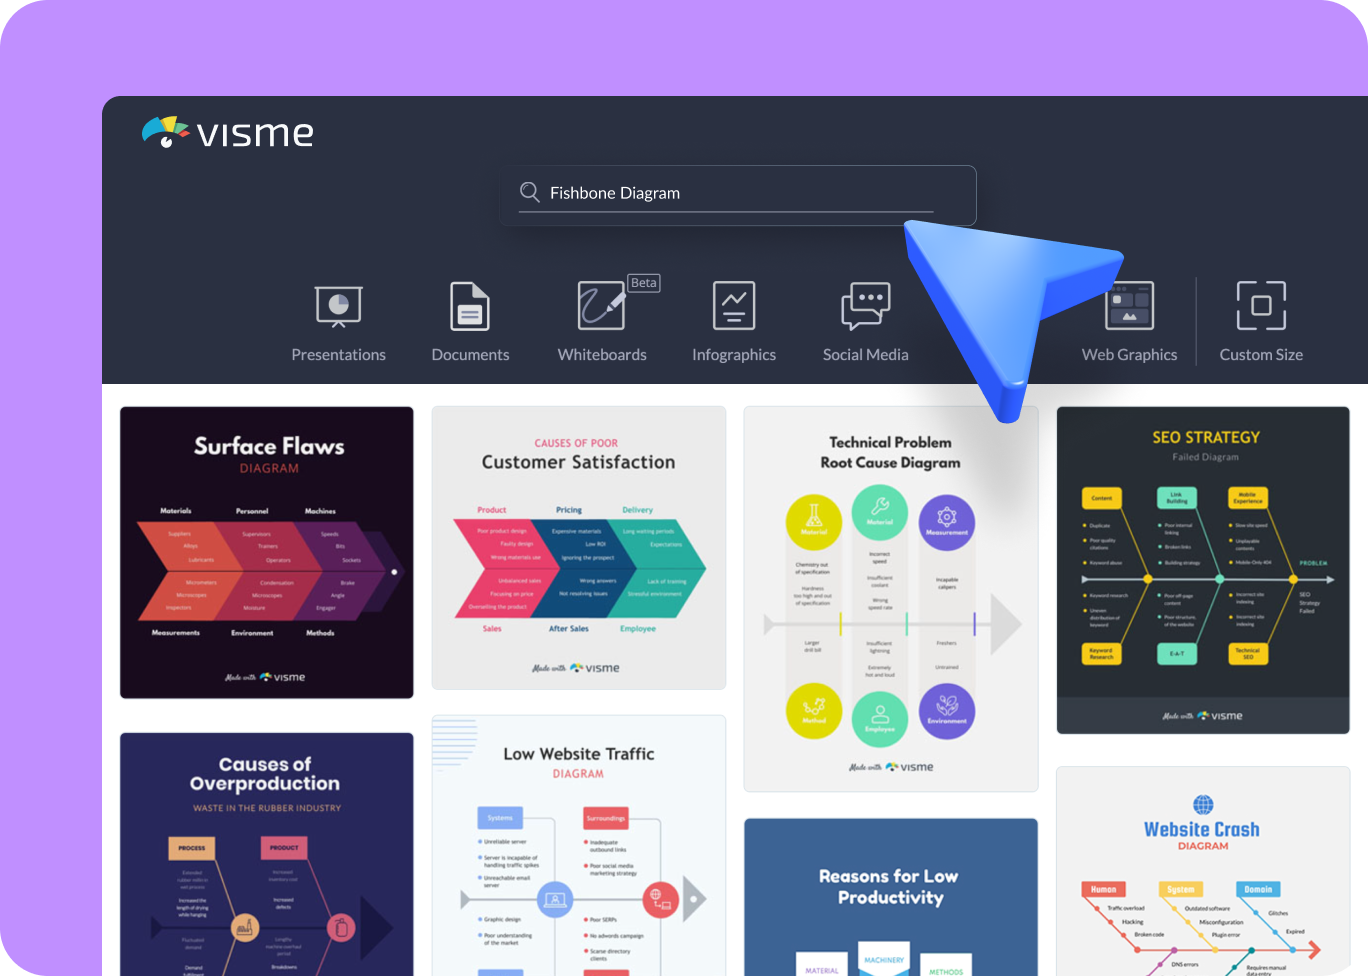
Kickstart your root cause analysis with Visme's fishbone diagram templates. Select a template with pre-structured cause categories, allowing you to dive into brainstorming quickly. Customize elements to reflect your situation and gain valuable insights faster. Whether your focus is quality management or process improvement, you'll find a template that resonates with your problem or branding needs.
Fishbone Diagram Features
User-Friendly Design Interface
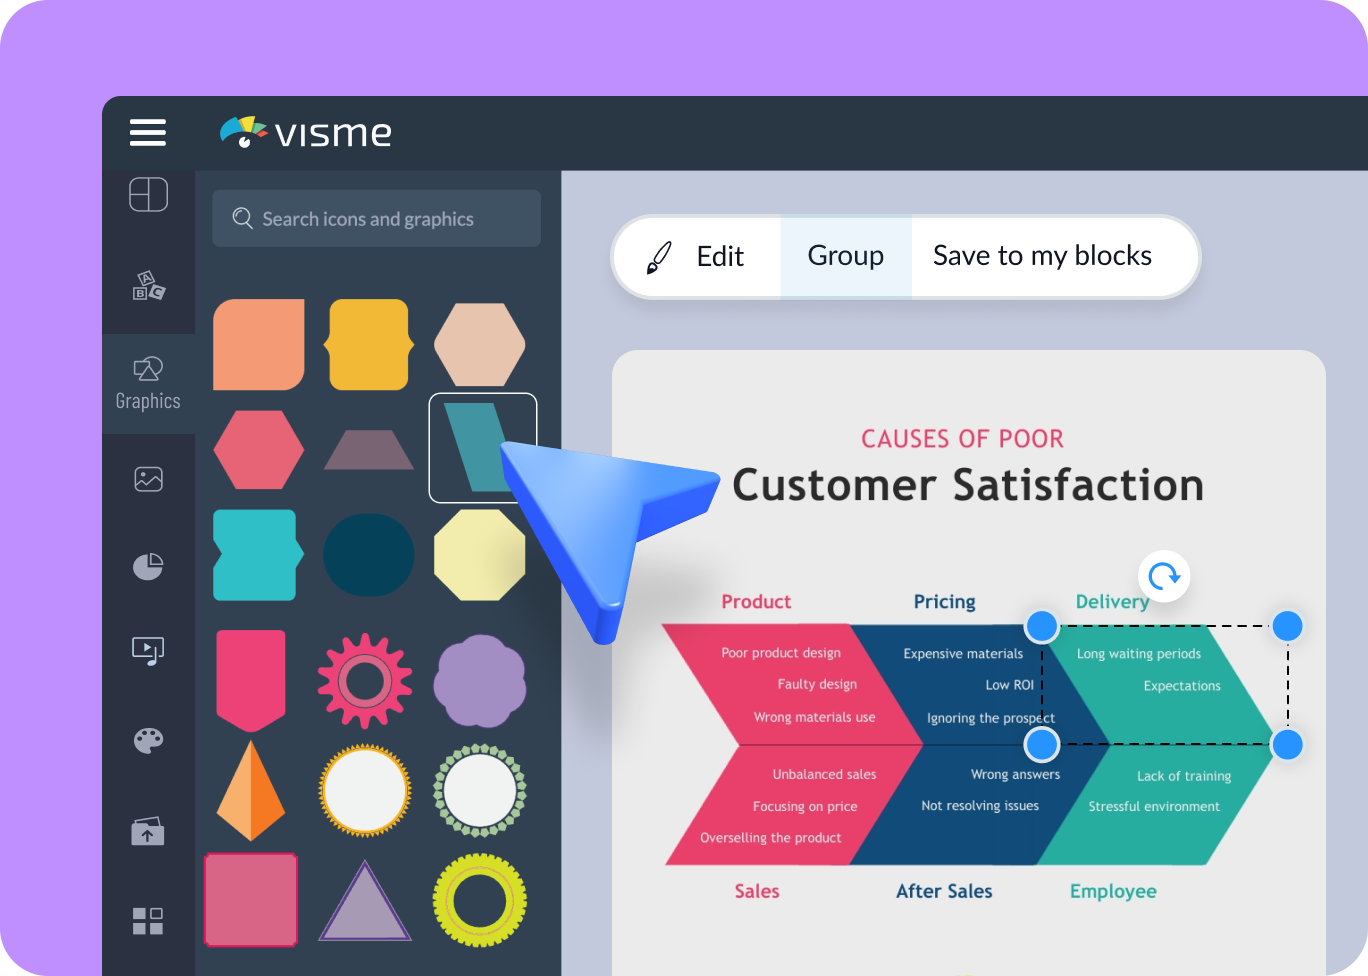
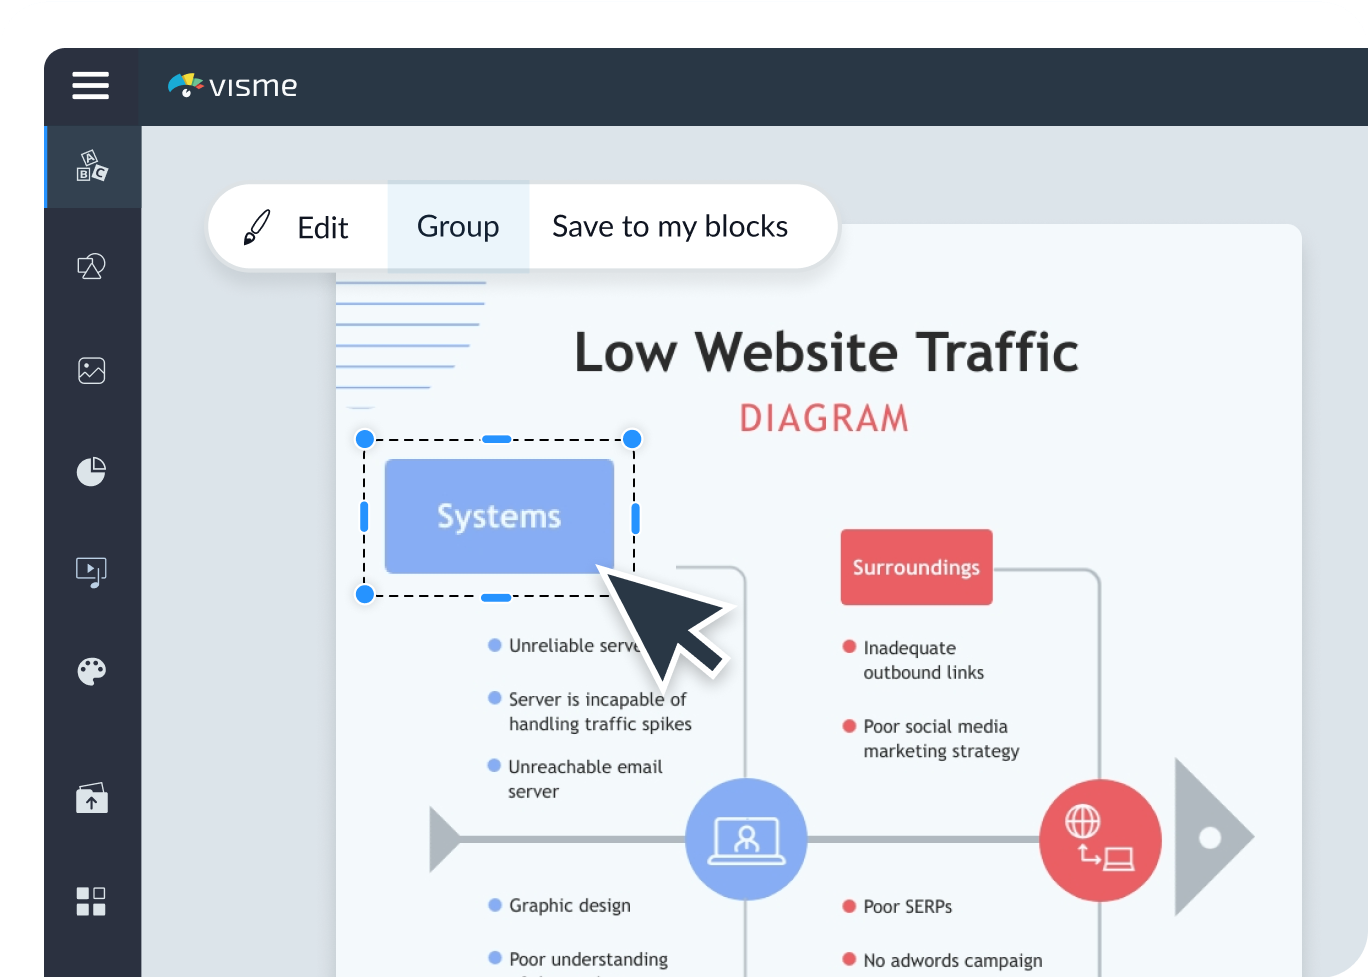
Visme’s Fishbone Diagram Maker features a user-friendly, responsive, intuitive interface. It allows you to easily create, modify and finalize your diagrams using a simple drag-and-drop mechanism. Whether you are a beginner or an experienced analyst, this design interface will be enjoyable and productive.
Real-time Collaboration
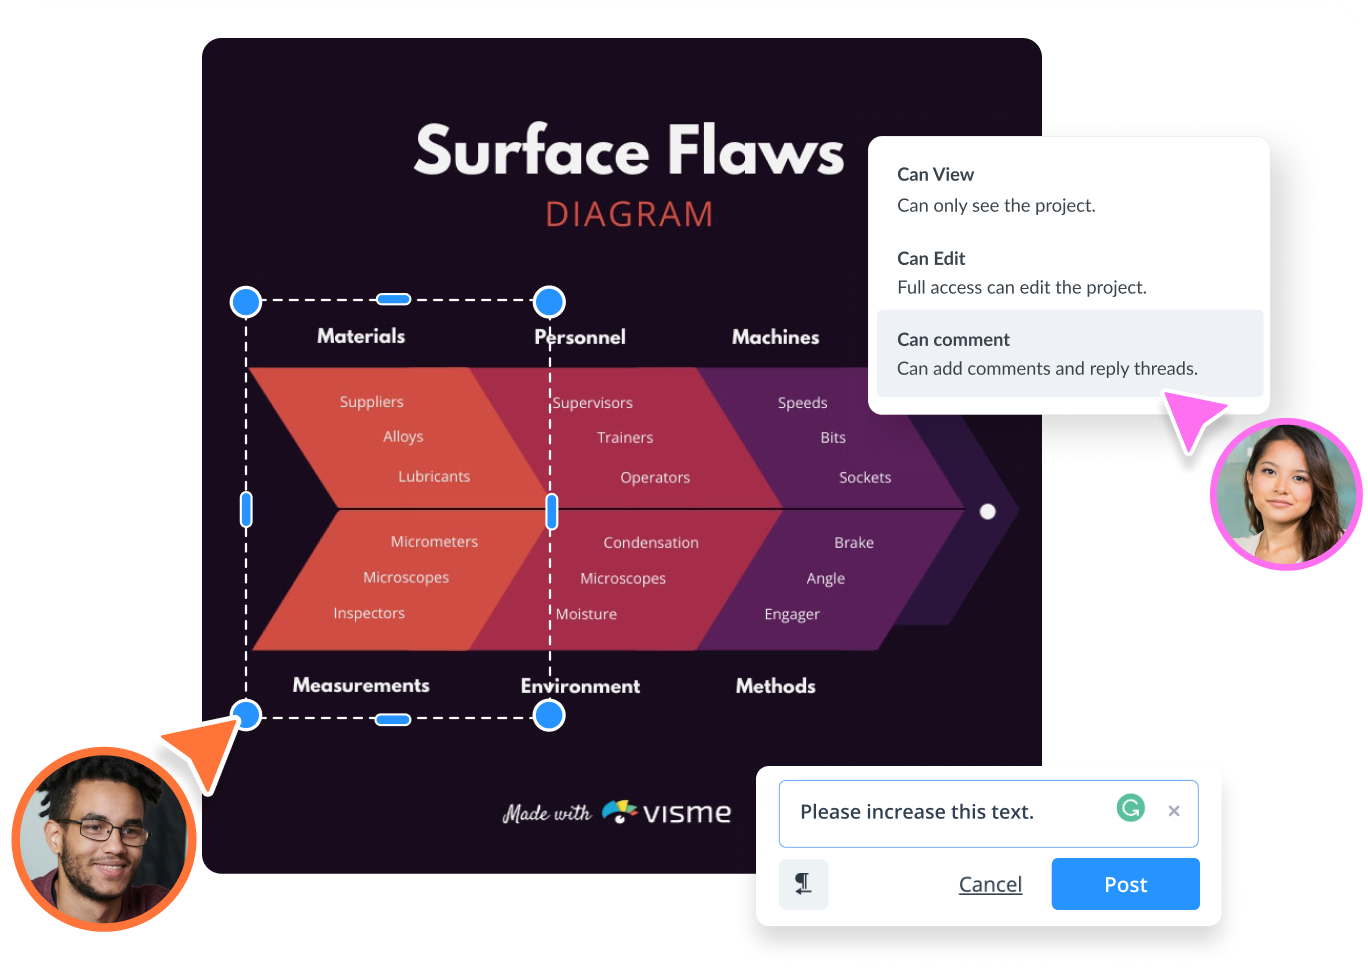
Visme’s Fishbone Diagram Maker allows multiple users to work on the same diagram simultaneously. It promotes teamwork by enabling team members to add their inputs, share views via comments, and edit in real time. This collaborative environment can bring different perspectives together, resulting in a more comprehensive final output.
Complete Customization Control
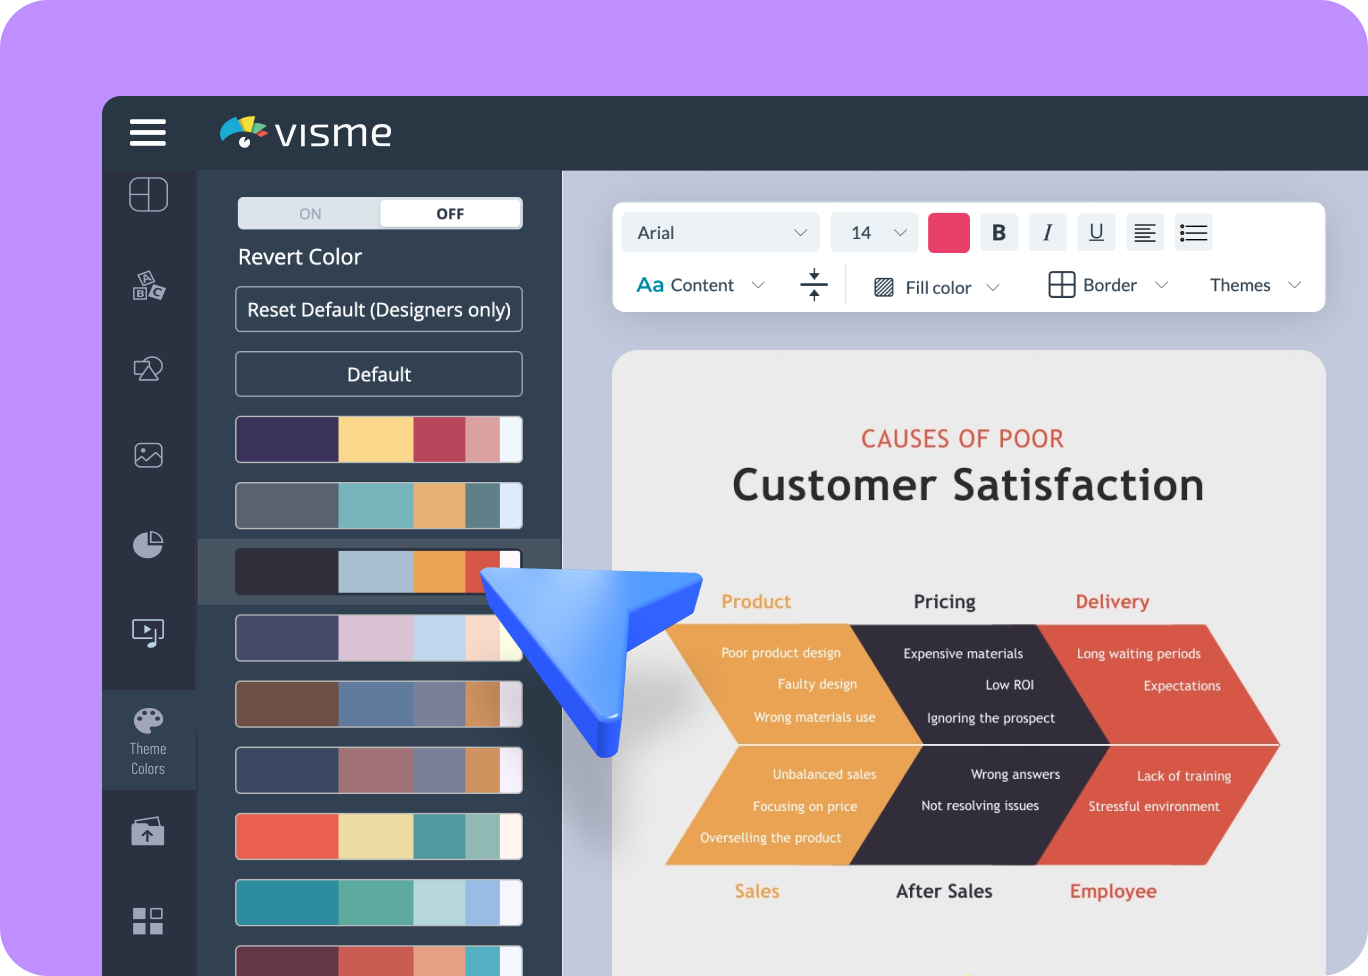
Visme allows you to control the look and feel of your fishbone diagram. You can change colors, fonts, the arrangement of bones and branches and the overall layout. This ensures that every diagram is unique and accurately conveys its intended analysis and insights.

More Great Features
of the Fishbone Diagram Maker
Drag-and-Drop Editor
Use our easy-to-use tools to design your ideal fishbone diagram, even if you're not an expert.
Completely Customizable Templates
Construct the precise visualization you imagine with our flexible fishbone diagram templates.
Instant Sharing
Upgrade to share your fishbone diagrams on your social channels or embed them on your site with a code snippet.
Vast Design Assets
Enhance your diagram with our design assets, including vector icons, illustrations, 3D animated graphics and more.
Real-Time Collaboration
Collaborate on your projects instantly. Invite team members to edit, comment, annotate and more live.
Interactive & Animated Features
Enhance your fishbone diagram with interactive buttons, hotspots and hover effects for a dynamic, engaging user experience.
Data Widgets
Simplify data representation and visually engage the diagram with various data visualization tools.
Object List
Easily organize and navigate through various elements in your diagram with a handy object list.
Advanced Analytics
Track diagram engagement and get insights into viewer interactions for continuous improvement.
Revision History
Access and restore previous diagram versions with a comprehensive revision history.
Over 25 Charts and Graphs
Discover our broad collection with more than 25 types of diagrams and charts to browse from.
Learn More
What is a Fishbone Diagram?
A fishbone diagram, also called an Ishikawa diagram or a cause-and-effect diagram, is a visual representation tool that helps identify, categorize and analyze the various causes that lead to a particular problem or effect. The diagram layout resembles a fish’s skeleton, with the main problem or effect at the head and potential causes extending as ribs.
Fishbone diagrams are extremely useful tools for breaking down complex issues into smaller, more manageable parts. They are widely used in quality management and organizational process improvements, helping teams thoroughly investigate and address a problem’s root causes rather than just its symptoms.
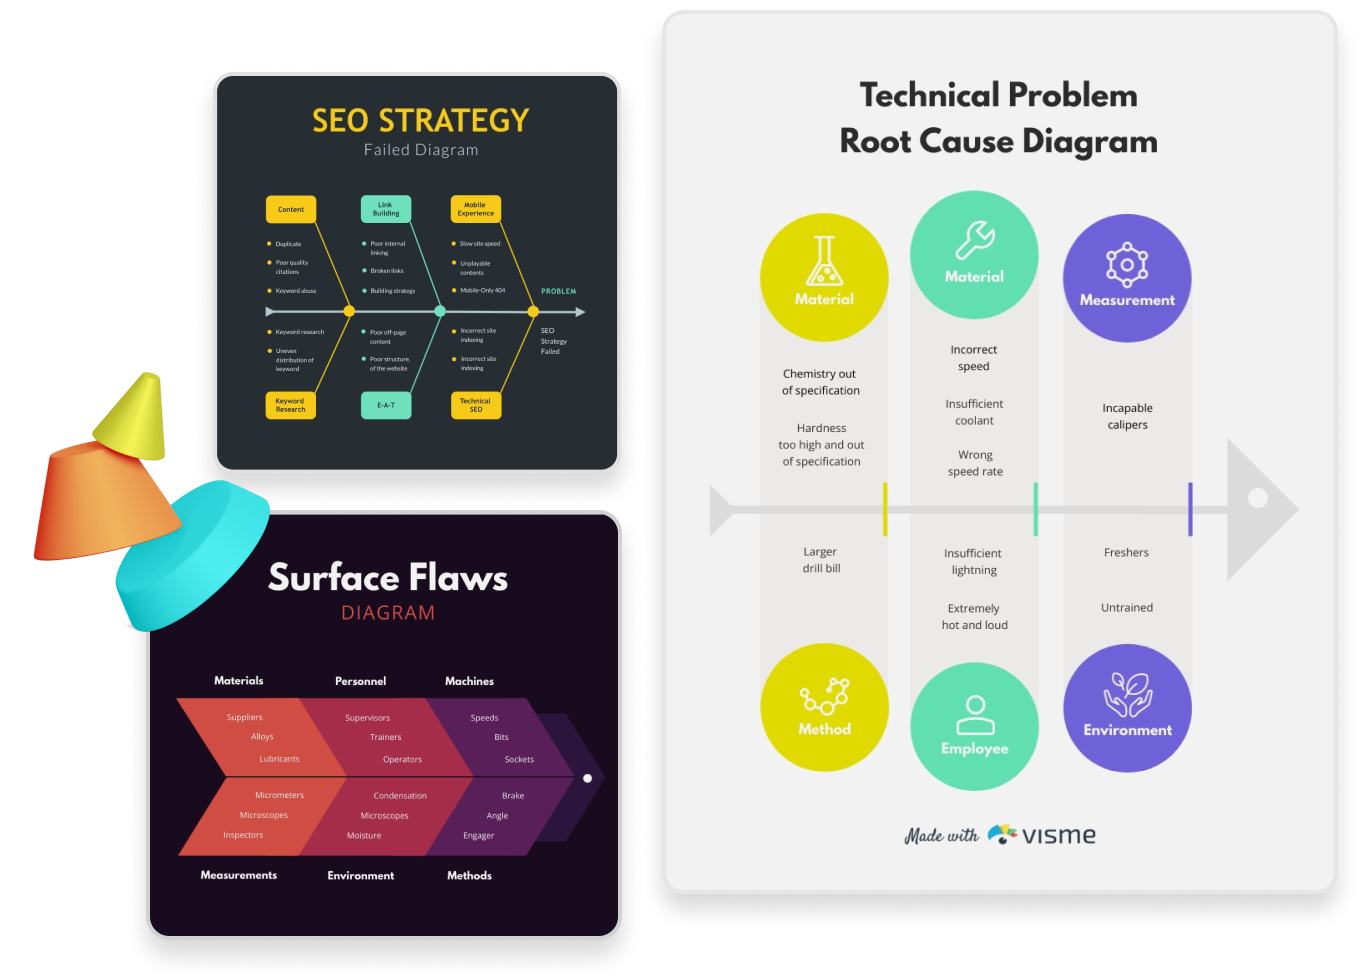
Use Visme’s Fishbone Diagram Maker to Analyze and Pinpoint the Root Causes of Complex Problems
Sketch out complex problems and identify underlying issues that affect your processes or outcomes. Customize your fishbone diagram with just a few clicks to differentiate causes with various color codes, line styles and text options, ensuring your diagram is informative and visually appealing.
Everything you need + more
More than a Fishbone Diagram Maker
Make it engaging
Interactivity
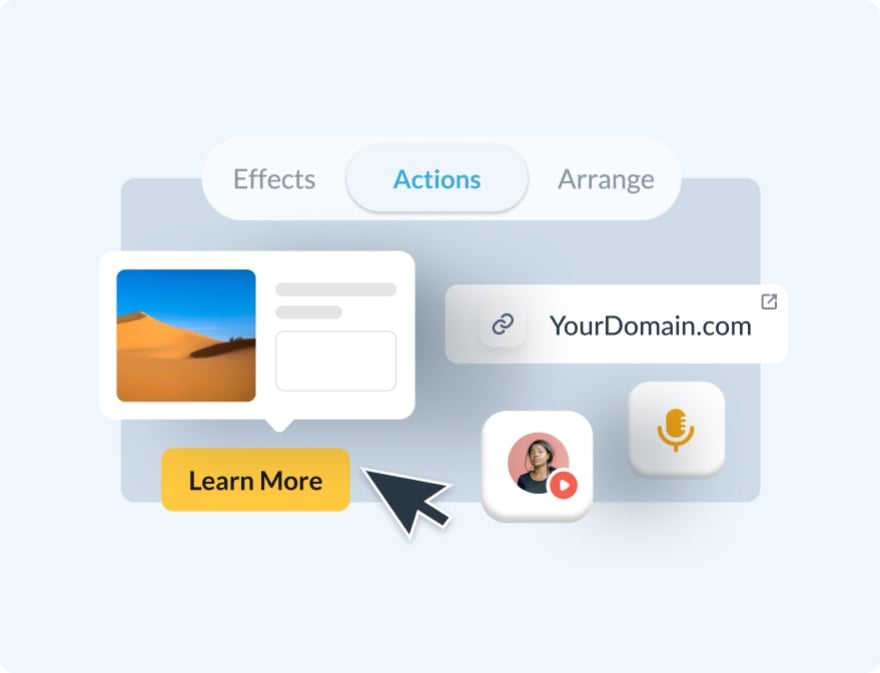
Create interactive reports with popup and rollover effects that allow your viewer to interact with your design to learn more information.

Visualize your data
Charts & Graphs
Showcase sales, marketing, website data and more in your reports with Visme’s easy-to-use charts, graphs and other data visualization tools.

Beautify your content
Video & Animation
Choose from over a million stock photos, icons, illustrations, characters, lines, shapes and more to create a completely unique report.
How it works
How to Create a Fishbone Diagram in 5 Easy Steps
Creating fishbone diagrams with Visme is straightforward and productive. Thanks to Visme's intuitive interface, creating detailed fishbone diagrams that break down complex problems into manageable parts is a breeze. Ideal for identifying root causes in processes or systems, you can select from various templates, input your causes and effects, and personalize the diagram to suit your analysis needs.
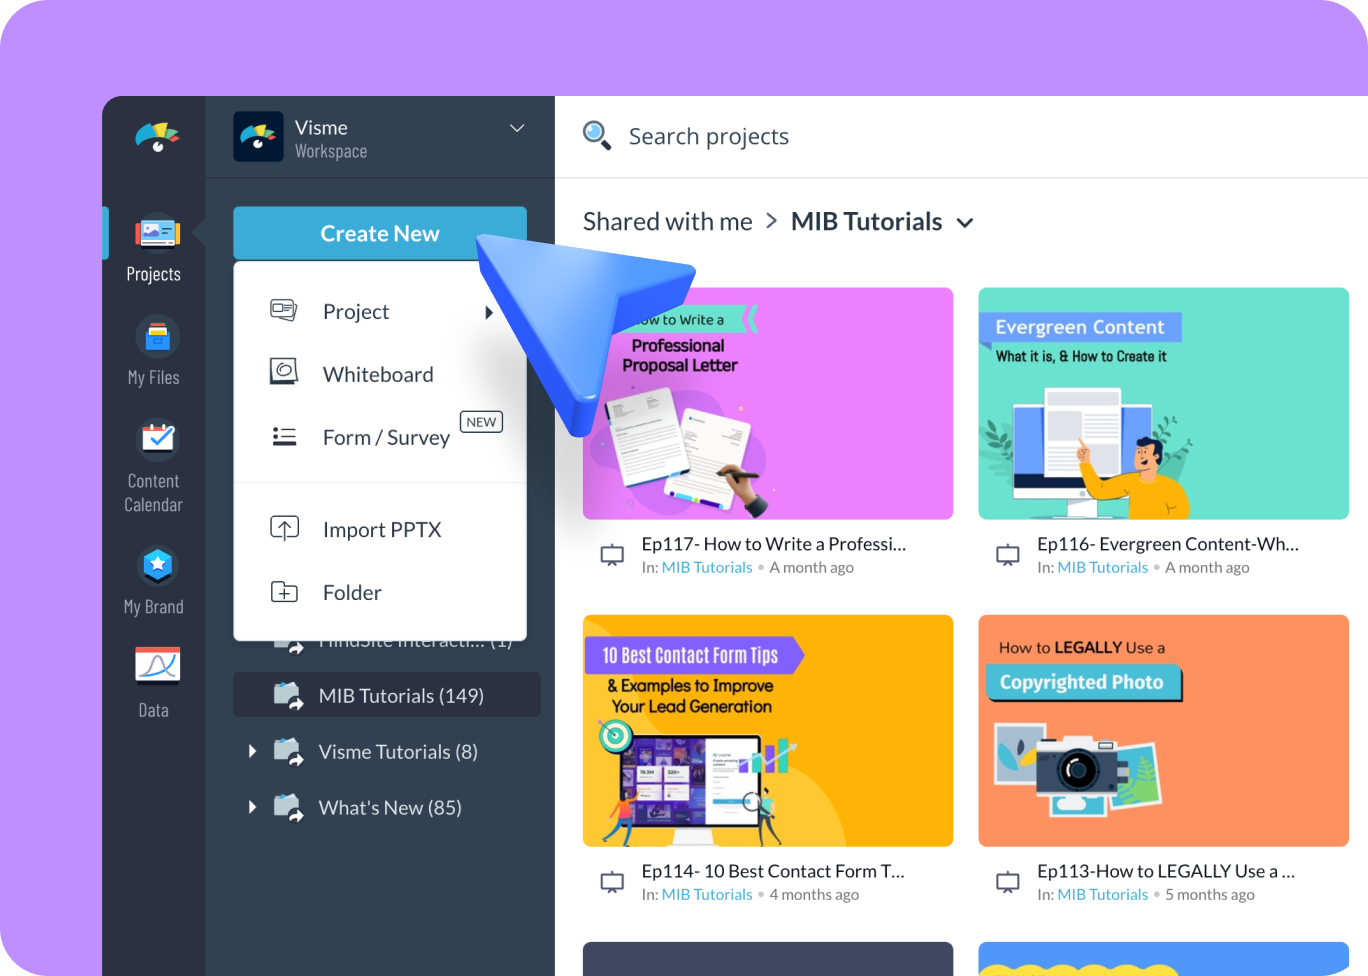
- Log in to your Visme account and hit “Create New” to begin a fresh project from your dashboard.
- Type “Fishbone Diagram” into the search bar and select the appropriate category from the results to see available templates.
- Pick the fishbone diagram template that meets your analysis requirements and start adding your specific causes leading to the effect.
- Customize your diagram by changing the colors, text styles, and shapes to match the theme of your project or organization.
- Upgrade to download the diagram in PDF, JPG or PNG format, share it directly using a link, or embed it onto a web page.
Quick tips
Power Up Your Root Cause Analysis with Fishbone Diagrams
For structured analysis, group potential causes into logical categories such as "People," "Process," and "Equipment."
Add icons, illustrations or other graphics to enhance clarity and emphasize critical relationships within your diagram.
Include a clear title and, if necessary, a brief explanatory subtitle for your fishbone diagram.
Add subtle animations to emphasize specific elements when presenting your fishbone diagram.
Adapt colors and fonts to match your brand or the document's style where you will use the fishbone diagram.
Use the fishbone diagram to identify the root causes of a problem by exploring the contributing factors and delving deeper into the "why."
Break down larger cause categories into more granular sub-causes for in-depth analysis using Visme's flexible template structure.
Link causes to additional information, supporting documents or relevant web pages to turn your fishbone diagram into an interactive resource.
Frequently Asked Questions (FAQs)
Here's the basic process:
- Define the problem: Clearly state the issue you're analyzing.
- Choose categories: Identify common cause categories (e.g., People, Process, Equipment).
- Brainstorm causes: List potential factors within each category.
- Ask "why?" Dig deeper to uncover root causes.
- Create the diagram: Use a tool like Visme's Fishbone Diagram Maker or draw it manually.
Yes! Visme offers a variety of fishbone diagram templates to streamline your analysis. Choose one that fits your problem or industry, then customize it to your needs.
Absolutely! Visme's Fishbone Diagram Maker allows you to:
- Change colors, fonts and layout.
- Add icons, illustrations and other visuals.
- Adjust cause categories ("bones") and their positions.
- Include interactive elements like links and hotspots.
Fishbone diagrams are versatile and used in various fields, including:
- Quality management: Identifying defects in manufacturing processes.
- Project management: Analyzing risks or delays.
- Healthcare: Improving patient safety and outcomes.
- Business process improvement: Streamlining operations and reducing errors.
Both are problem-solving tools, but they have different uses:
- Fishbone diagram: Focuses on identifying potential causes of a problem.
- Pareto chart: Helps prioritize causes by showing which factors have the greatest impact.
Absolutely! You can search online or explore Visme's template library for fishbone diagram examples tailored to different industries and problem types.
Yes, you can find blank fishbone diagrams online. However, for ease of use and customization, Visme offers a variety of fishbone diagram templates that provide a basic structure for you to start your analysis.
Visme's free plan allows you to create fishbone diagrams and access other design tools. Paid options are available for advanced feature and extensive download and export options


