1. Home
  2. Create Infographics
  3. Infographic Templates
  4. Waterfall Process Circle Diagram Template

Waterfall Process Circle Diagram Template

Use This Template

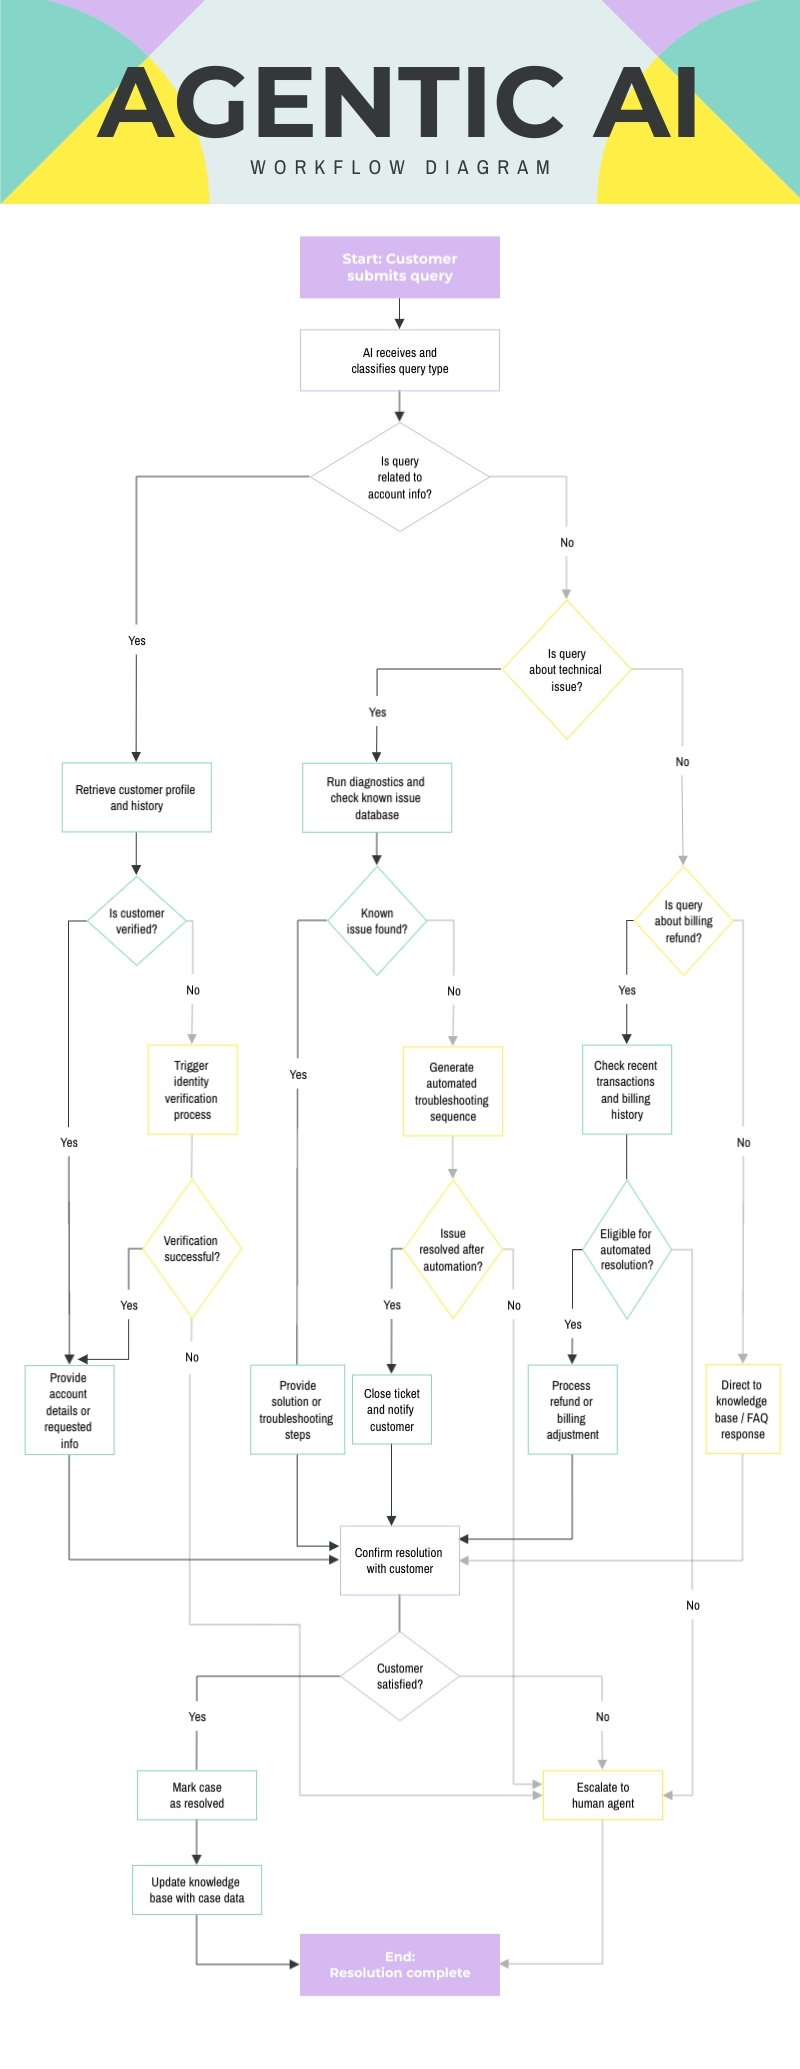
Understand the waterfall process with this circular diagram infographic template.

This template defines the waterfall process methodically in a visually engaging and coherent circular diagram format. With its simple graphics and vivid colors, it is designed to provide clear insights while keeping the learning process engaging.

Utilize this template to describe any linear process or customize it with your corporate colors and language with Visme’s easy-to-use editor.

  • Change colors, fonts and more to fit your branding
  • Access free, built-in design assets or upload your own
  • Visualize data with customizable charts and widgets
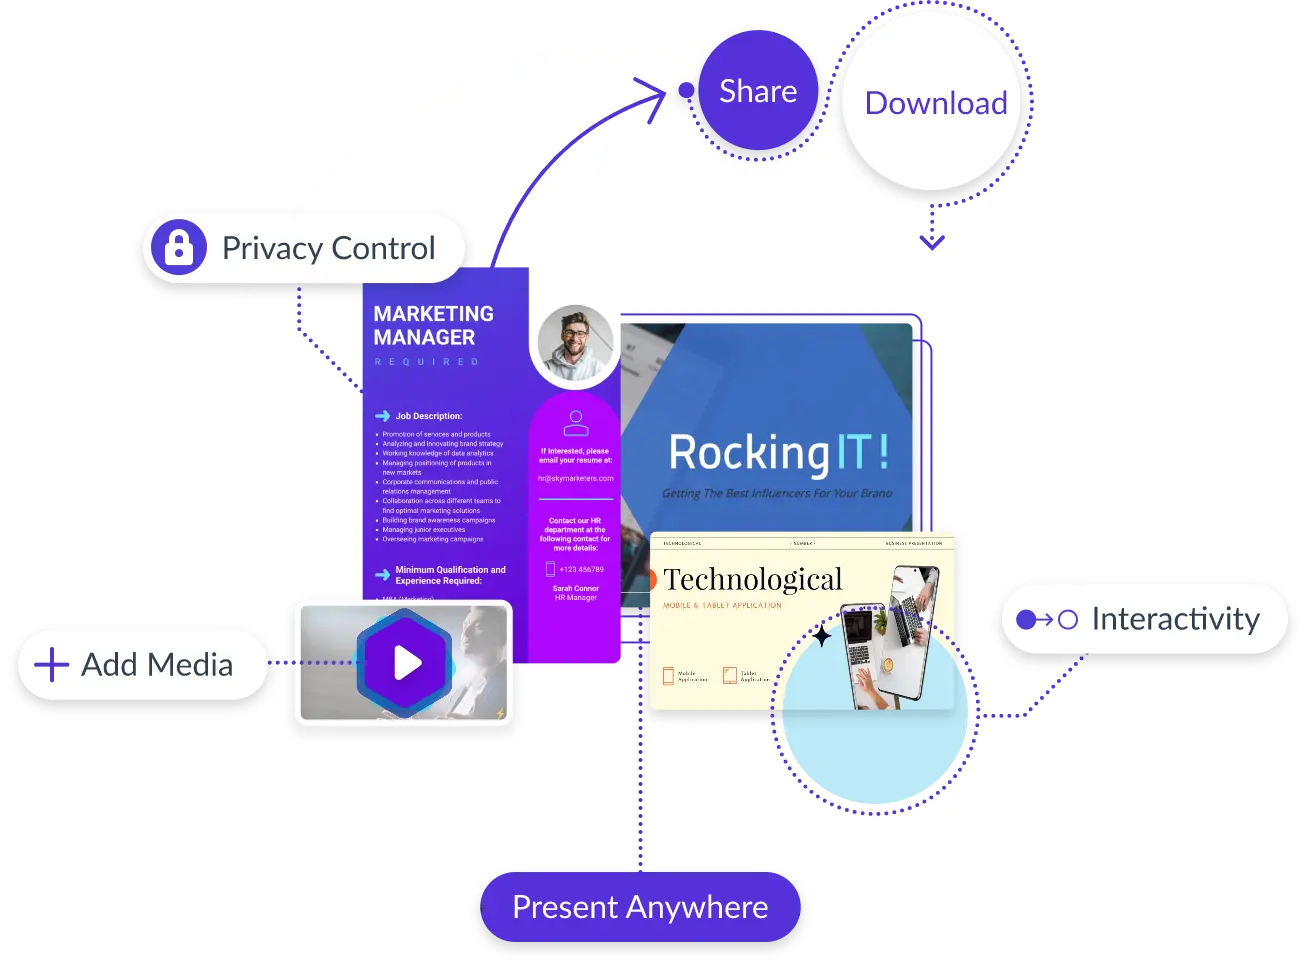
  • Add animation, interactivity, audio, video and links
  • Download in PDF, JPG, PNG and HTML5 format
  • Create page-turners with Visme’s flipbook effect
  • Share online with a link or embed on your website

Edit this template now, or check out more of Visme's diagram infographic templates to find the one that fits your needs best.

Edit this template with our infographic maker!

Waterfall Process Circle Diagram Template
Template Specifications
  • Dimensions

    All infographic templates are 800 pixels wide with varying lengths. These dimensions can be easily changed and the length adjusted with a slider.

  • Customizable

    This template can be fully customized. You can edit content, change image(s), apply custom colors, input your own fonts and logo, and more.

  • Formats

    Download as a high resolution JPEG, PNG, PDF or HTML5, embed into a blog post or webpage, or generate a shareable link for online use.

Compatibility

Related Infographics

Marketing Campaign Circle Diagram Template
Marketing Campaign Circle Diagram Streamline your marketing campaigns with this comprehensive circle diagram template.
Machine Learning Circle Diagram Template
Machine Learning Circle Diagram Demystify the complex world of machine learning with this comprehensive circle diagram template.
Product Launch Circle Diagram Template
Product Launch Circle Diagram Manage your product launches confidently with this detailed circle diagram template.
Problem-Solving Cycle Circle Diagram Template
Problem-Solving Cycle Circle Diagram Take on challenges more effectively with this problem-solving cycle diagram template.
Business Incubation Circle Diagram Template
Business Incubation Circle Diagram Grasp the process of business incubation with this accessible circular diagram infographic.
Design Thinking Circle Diagram Template
Design Thinking Circle Diagram Streamline your design process with this easy-to-understand circle diagram template.
Sales Cycle Circle Diagram Template
Sales Cycle Circle Diagram Visualize your sales process with this intuitive circle diagram template.
Analytics Company SIPOC Diagram Template
Analytics Company SIPOC Diagram Showcase your analytics processes with this explanatory SIPOC diagram template.
Waste Management Workflow Diagram Template
Waste Management Workflow Diagram Visualize the waste management workflow with this customizable diagram template.
ERP System Integration Workflow Diagram Template
ERP System Integration Workflow Diagram Visualize the process workflow of an ERP system integration with this customizable diagram template.
Business Model Infographic Template
Business Model Infographic Create a visual list of business model types with this colorful and customizable infographic template.
Team Productivity Fishbone Diagram Template
Team Productivity Fishbone Diagram Analyze and optimize your team’s productivity using this seven-topic fishbone diagram template.
Inventory Management Fishbone Diagram Template
Inventory Management Fishbone Diagram Analyze the problems in your business’s inventory management with this fishbone diagram infographic template.
Manufacturing Fishbone Diagram Template
Manufacturing Fishbone Diagram Visually analyze the quality control issues in your business with this fishbone diagram infographic template.
Sales Performance Fishbone Diagram Template
Sales Performance Fishbone Diagram Identify the root causes of low sales performance with this customizable fishbone diagram template.
Ecommerce Database ERD Infographic Template
Ecommerce Database ERD Infographic Create an entity relationship diagram for your e-commerce database with this ERD infographic template.