Project Management Gantt Chart Template
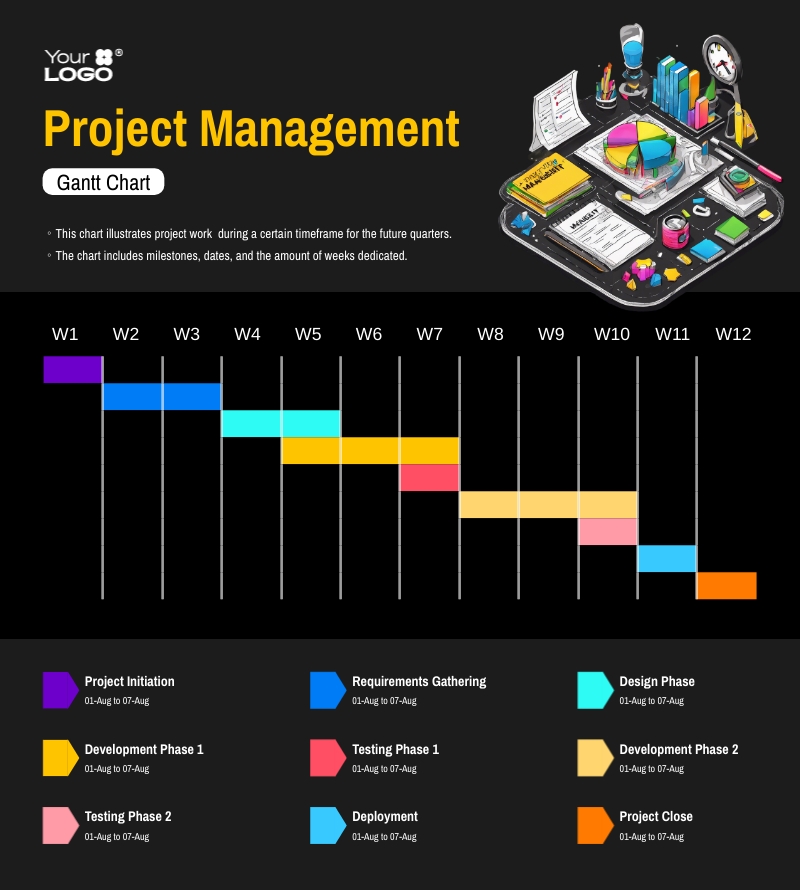
Use This TemplateUse this customizable Gantt Chart to manage your project's nine concurrent phases over twelve weeks.
This Gantt chart illustrates work timelines for a project over twelve weeks. Each column is a week, and each color rectangle is the time it will take to complete that phase. Below the chart is a legend with color labels explaining what each color rectangle refers to. Using Visme’s editor, you’ll have no trouble adjusting this Gantt chart to suit your particular project. Invite team members to the project workspace and collaborate on the chart's upkeep and maintenance. Share outside your team with a live link that refreshes automatically after every change.
- Change colors, fonts and more to fit your branding
- Access free, built-in design assets or upload your own
- Visualize data with customizable charts and widgets
- Add animation, interactivity, audio, video and links
- Download in PDF, JPG, PNG and HTML5 format
- Create page-turners with Visme’s flipbook effect
- Share online with a link or embed on your website
Customize this infographic to plan out your project, or look at several other roadmap infographic templates in Visme’s vast template library.
Edit this template with our infographic maker!
Template Specifications
-
Dimensions
All infographic templates are 800 pixels wide with varying lengths. These dimensions can be easily changed and the length adjusted with a slider.
-
Customizable
This template can be fully customized. You can edit content, change image(s), apply custom colors, input your own fonts and logo, and more.
-
Formats
Download as a high resolution JPEG, PNG, PDF or HTML5, embed into a blog post or webpage, or generate a shareable link for online use.
Compatibility
Related tags
Related Infographics


