1. Home
  2. Create Infographics
  3. Infographic Templates
  4. Business Expenses Pie Chart Infographic Template

Business Expenses Pie Chart Infographic Template

Edit This Template

Bring all your business expenses and present it using a pie chart with this business expenses pie chart infographic template.

Business expenses are often used in reports and presentations. Next time you’re gathering all of this information, instead of just placing the raw data in your report, use this business expenses pie chart infographic template to summarize large data and present it in a visually comprehensive way.

Add your own creative ideas, use your brand’s custom colors, fonts and icons to customize this infographic template.

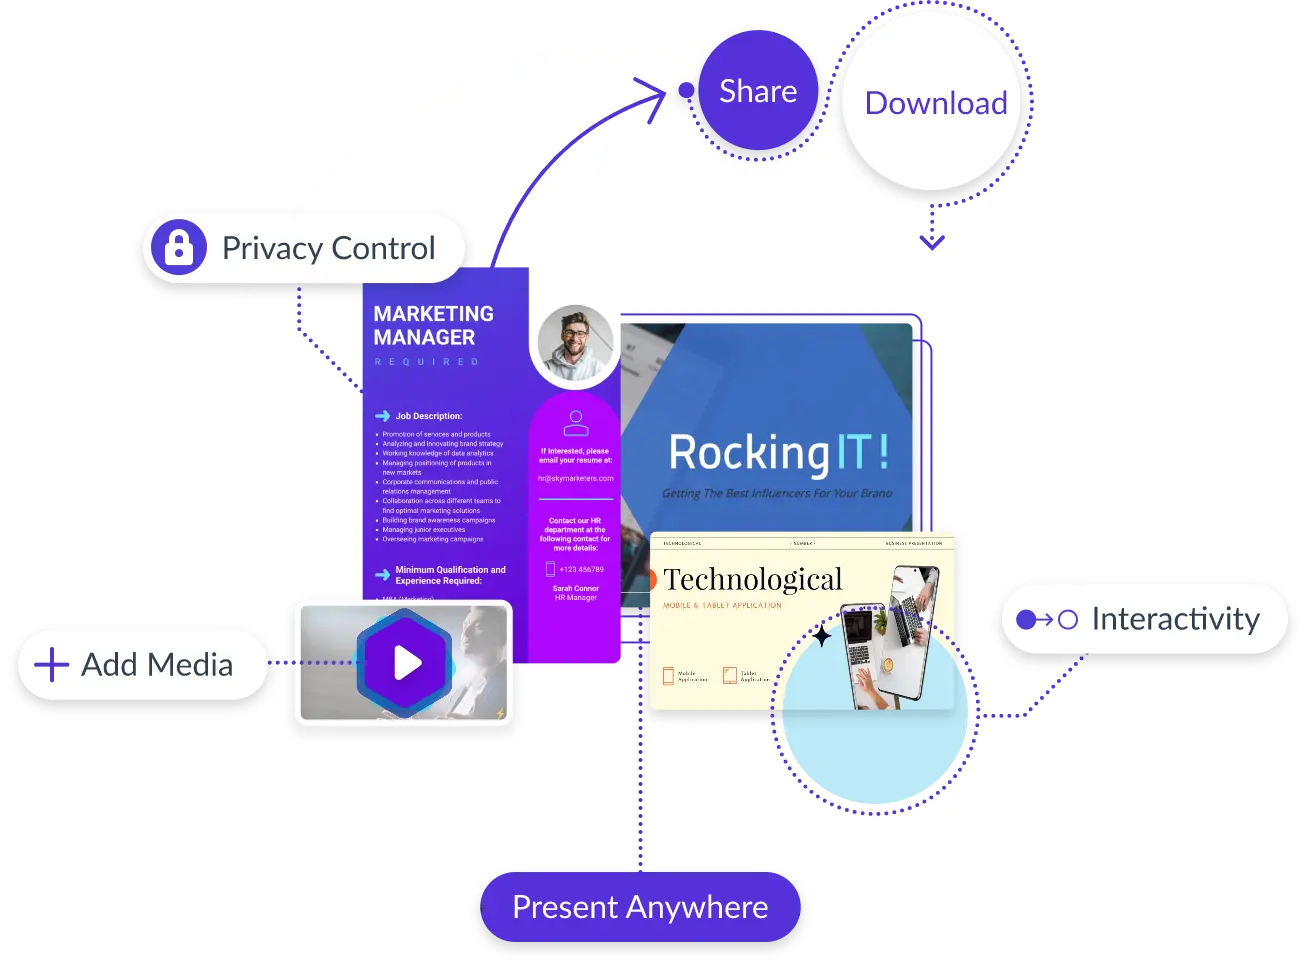
  • Change color themes and font styles with a few clicks
  • Access millions of free graphics from inside the editor
  • Visualize data with custom widgets, maps and charts
  • Add interactivity like animation, hover effects and links
  • Download in JPG, PNG, PDF and HTML5 format
  • Share online with a link or embed it on your website

Click the button below to start using this infographic template or explore more design options by checking out our collection of professional infographic templates.

Edit this template with our infographic maker!

Business Expenses Pie Chart Infographic Template
Template Specifications
  • Dimensions

    All infographic templates are 800 pixels wide with varying lengths. These dimensions can be easily changed and the length adjusted with a slider.

  • Customizable

    This template can be fully customized. You can edit content, change image(s), apply custom colors, input your own fonts and logo, and more.

  • Formats

    Download as a high resolution JPEG, PNG, PDF or HTML5, embed into a blog post or webpage, or generate a shareable link for online use.

Compatibility

Related Infographics

Brands Support Bite-Sized Infographic Template
Brands Support Bite-Sized Infographic Bring your research to life with the help of this creative bite-sized infographic template.
Most Popular Undergraduate Courses Pie Chart Template
Most Popular Undergraduate Courses Pie Chart Summarize and present your findings in a creative way using this popular undergraduate courses pie chart template.
Population in Different States in the US Pie Chart Template
Population in Different States in the US Pie Chart Illustrate your research in an visually appealing manner using this pie chart template.
Daily Calories Pie Chart Infographic Template
Daily Calories Pie Chart Infographic Customize this nutrition pie chart template to illustrate data in a creative and visually appealing way.
Biggest Industries in the United States Pie Chart Template
Biggest Industries in the United States Pie Chart Present data in an organized and appealing way using this customizable pie chart template.
Global Visits to Spain Infographic Template
Global Visits to Spain Infographic Bring your data to life with this creative pie chart infographic template. Add it to your reports and presentations.
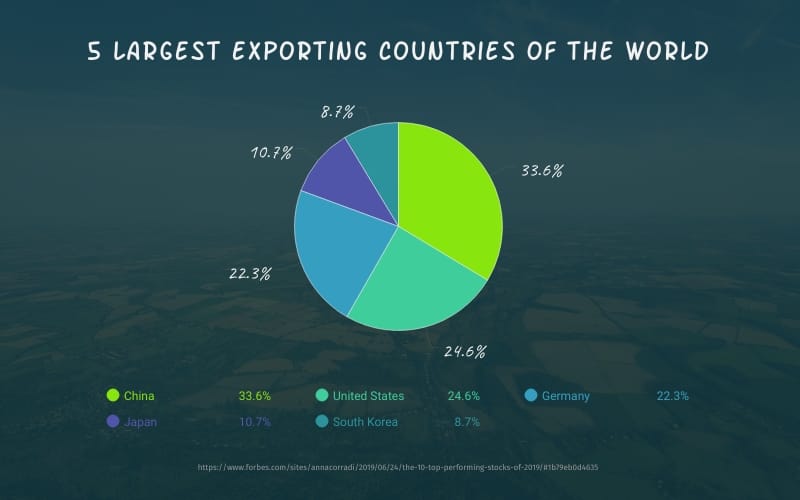
5 Largest Exporting Countries of the World Pie Chart Template
5 Largest Exporting Countries of the World Pie Chart Present boring data in a creative and appealing way using this multicolor pie chart template.
Chemical Composition of Diesel Pie Chart Template
Chemical Composition of Diesel Pie Chart Share your findings in an engaging manner using this pie chart infographic template.
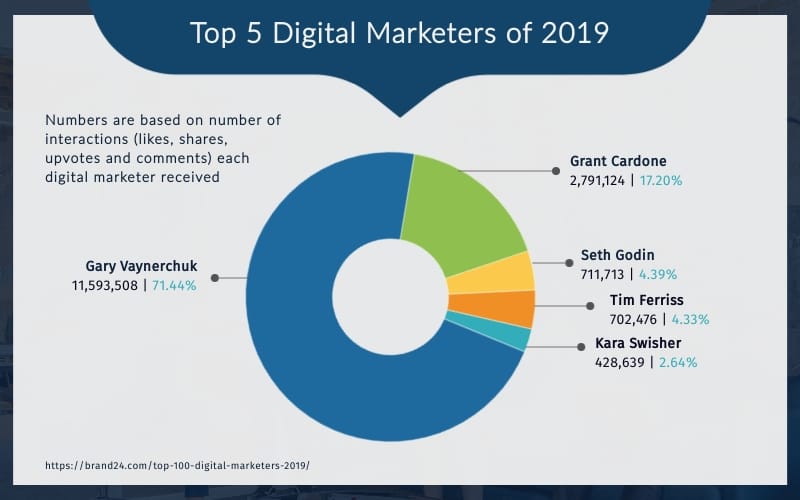
Top 5 Digital Marketers of 2019 Pie Chart Template
Top 5 Digital Marketers of 2019 Pie Chart Use this sleek and professional pie chart template to illustrate and summarize your findings in a visually appealing way.
Sales of a Clothing Brand Pie Chart Template
Sales of a Clothing Brand Pie Chart Highlight your findings and present them in a creative way using the sales of a clothing brand pie chart.
Goodreads Reading Challenge Participants Pie Chart Template
Goodreads Reading Challenge Participants Pie Chart Present proportions in different numerical datasets in a visually appealing way using this multicolor pie chart template.
Demographics of Tinder Users Pie Chart Template
Demographics of Tinder Users Pie Chart Compare and contrast different datasets using this demographics of tinder users pie chart.
Instagram Profile Pie Chart Infographic Template
Instagram Profile Pie Chart Infographic Illustrate your findings in a visual way using this Instagram profile pie chart infographic template.
Domain Pie Chart Infographic Template
Domain Pie Chart Infographic Present proportions in datasets in a visually appealing manner using this colorful domain pie chart.
Time Spend on Web vs Apps Pie Chart Template
Time Spend on Web vs Apps Pie Chart Bring life to your data and present it in an appealing and comprehensive way using this professional pie chart template.
Most Frequently Used Visuals Pie Chart Template
Most Frequently Used Visuals Pie Chart Illustrate data creatively by combining visuals and texts using this pie chart template.
Smartphone Daily Time Spend - Infographic Template
Smartphone Daily Time Spend - Infographic Visualize your data and break it down into portions in an engaging way using this smartphone pie chart template.
Budget Pie Chart Infographic Template
Budget Pie Chart Infographic Visualize your business’s monthly or quarterly estimated expenses using this budget pie chart infographic.
B2B Organizations Bite-Sized Infographic Template
B2B Organizations Bite-Sized Infographic Breathe life into your articles and blogs by using this engaging bite-sized infographic template.
Business Goals Bite-Sized Infographic Template
Business Goals Bite-Sized Infographic Present your business goals in front of your readers and key stakeholders using this bite-sized infographic template.