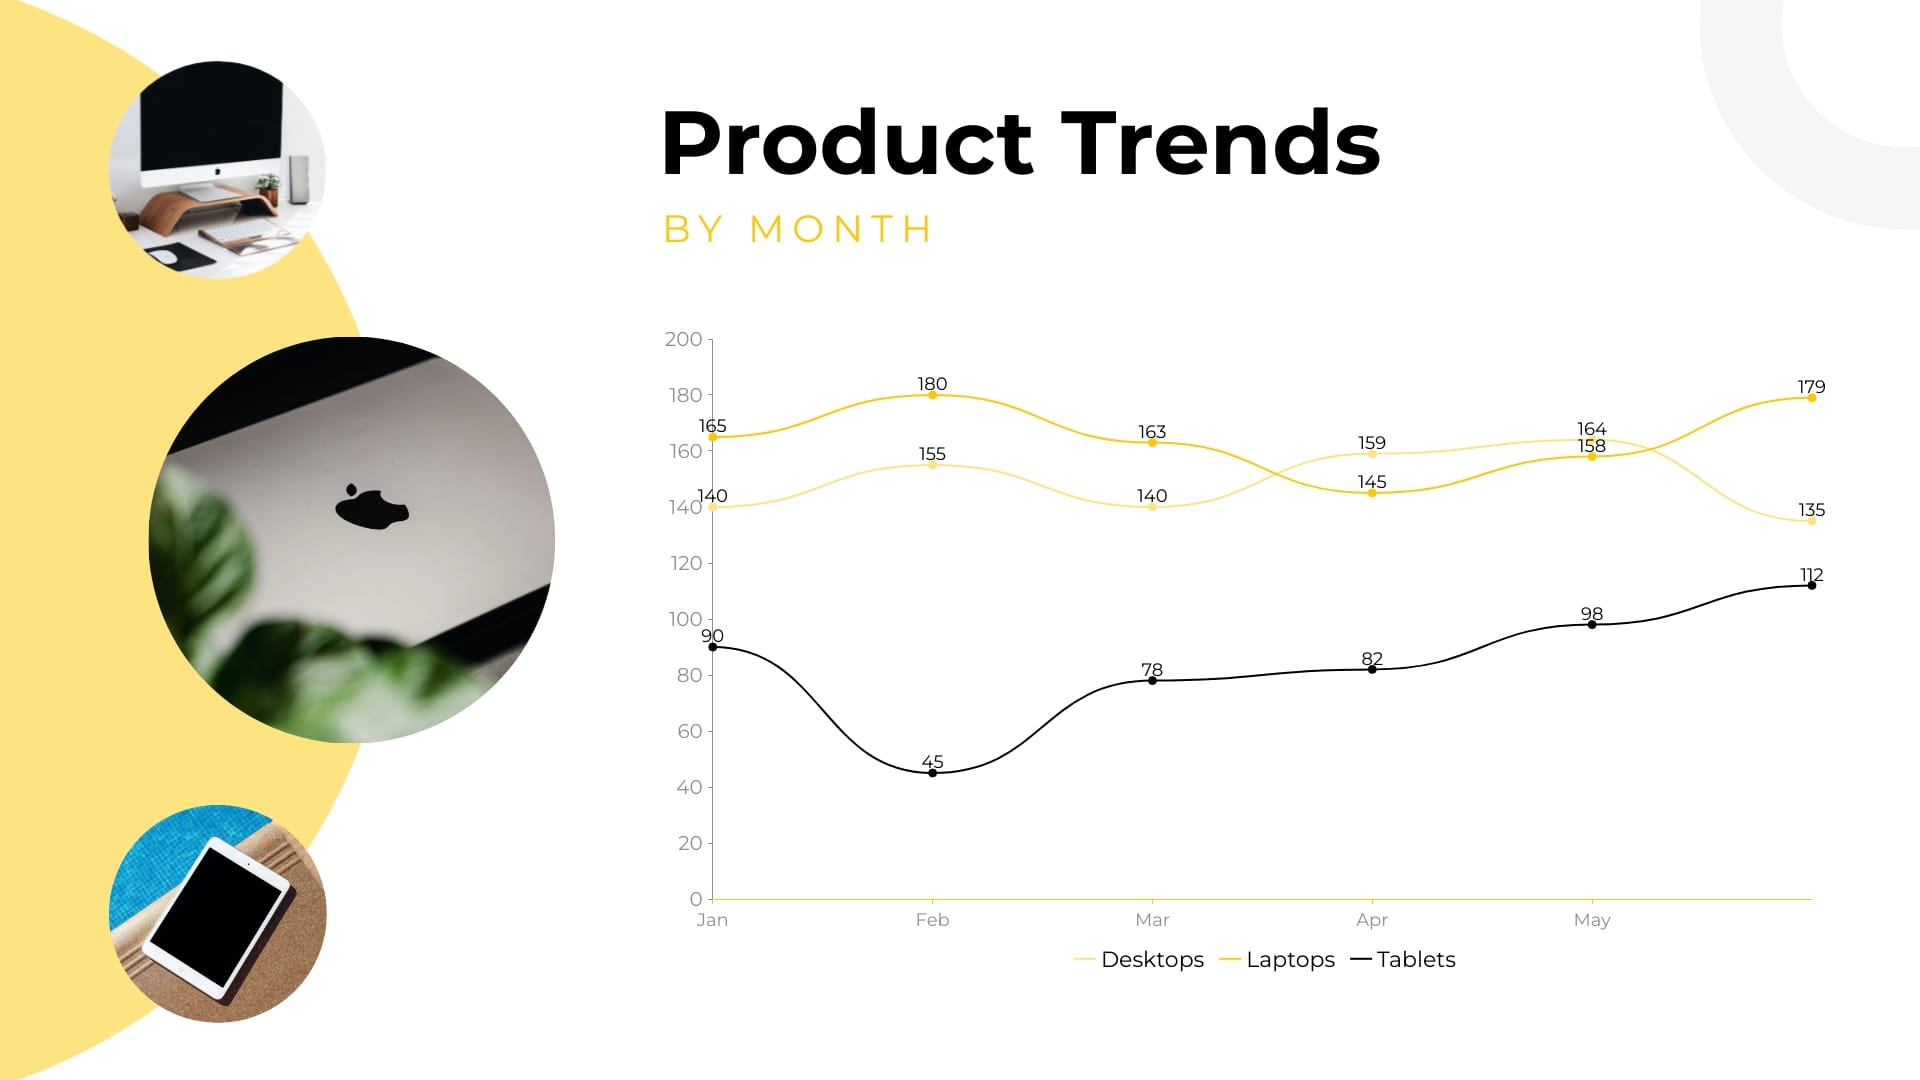
Sleek Product Trends Line Graph Template
Use This TemplateEdit this template with our pie chart maker!
Template Specifications
-
Dimensions
All chart templates come in two sizes: horizontal (1920 x 1080 pixels) and square (800 x 800 pixels)
-
Customizable
This chart template can be fully customized. You can edit content, change image(s), apply custom colors, add or subtract pages and more.
-
Formats
Can be shared as public or private link online, embedded to a site or blog, or downloaded as JPG, PNG, PDF or HTML5. If downloaded as an image, you can also insert into other documents and presentations.
Compatibility
Related tags
Related Charts & Graphs
Health Care Cost Bar Graph
Illustrate expenses and costs and compare between different datasets using this healthcare cost bar graph template.

Brand Guidelines Document
Share everything related to your brand personality and win over your audience using this style guide template.
Site Traffic Infographic
Break down your site traffic in a way that's easy to comprehend using this infographic template.
Monthly Sales Area Chart
Find and illustrate trends in your company’s financial data using this monthly sales area chart template.
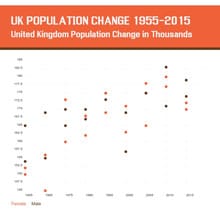
UK Population Change Scatter Plot
Make your reports and proposals impactful with this UK population change scatter plot template.
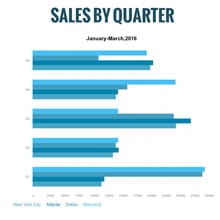
Sales by Quarter Bar Graph
Use this sales bar chart template to present data obtained from your company’s quarterly sales.

Business Information Pie Chart
Present data and proportions in a visually appealing way using this business information pie chart template.

Top 10 Products By Revenue Bar Graph
Illustrate different proportions in data using colorful stacked bars with this revenue bar graph template.
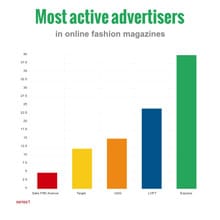
Most Active Advertisers Bar Graph
Use this simple bar graph template to help visualize your analytics and other data in a digestible way.
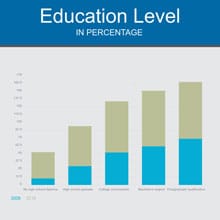
Educational Level Bar Graph
Present comparison between different datasets using this educational level bar graph template.

Revenues by Region Line Graph
Explain trends in data in a visually engaging way using this financial line graph template.
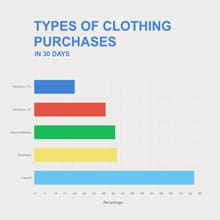
Clothing Purchases Bar Graph
Visualize your store’s purchase data and statistics using this 30 days purchase bar graph template.
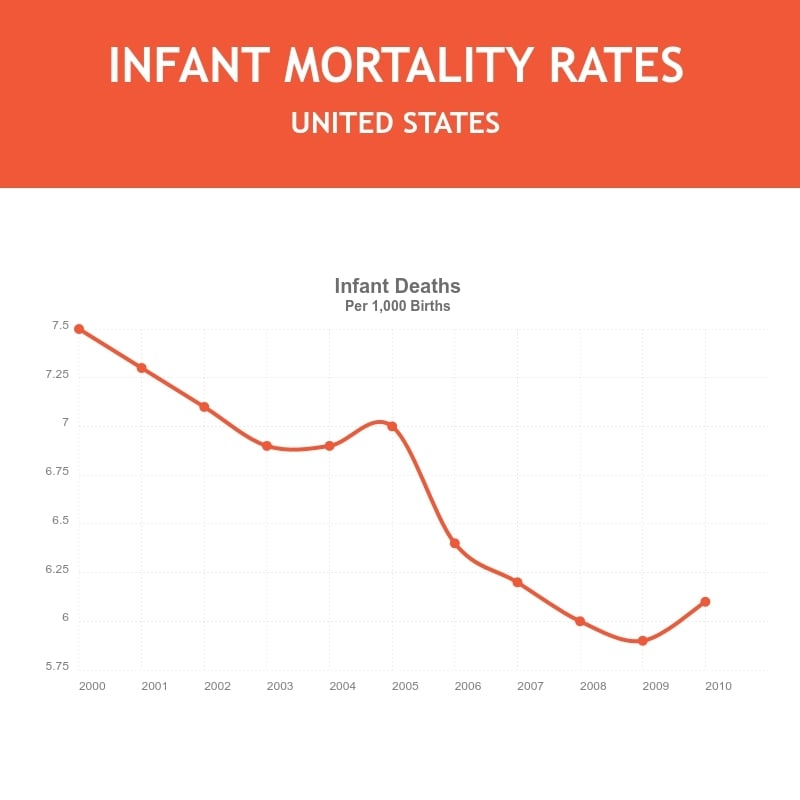
Infant Mortality Rate Line Graph
Visualize data and illustrate trends in an appealing way using this infant mortality rate line graph template.
E-Books Set to Surpass Print Area Chart
Customize this colorful area chart template to compare and contrast between different data sets.
Mobile is the New Media Star Line Graph
Use this line graph template to present and compare trends in multiple datasets.
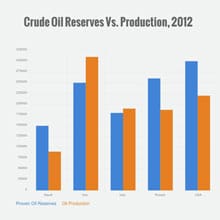
Crude Oil Reserve vs Production Bar Graph
Compare different datasets and present them in a visual way using this production bar graph template.

Fashion Designer
Introduce your fashion brand in style with this simple but classy template.

Photo Studio
Get the word out about your photography business using this professionally designed graphics template.

Photography
Showcase your creative photography work and attract more clients with this attractive poster design.

Vintage Photography
Showcase your vintage photography brand with this elegant and stylish social media template.
