1. Home
  2. Create Charts & Graphs
  3. Chart Templates
  4. Regional Sales Comparison Pie Chart Template

Regional Sales Comparison Pie Chart Template

Use This Template

Track and compare regional sales with this pie chart template.

Built specifically for businesses, sales managers, and data analysts looking to gauge regional market performance, this template allows detailed insights into your company's regional sales data.

With vibrant visuals and clear segments, this pie chart simplifies complex sales information, making it easy to understand. Tailor this pie chart to fit your requirements using Visme's easy-to-use editor.

  • Change colors, fonts and more to fit your branding
  • Access free, built-in design assets or upload your own
  • Visualize data with customizable charts and widgets
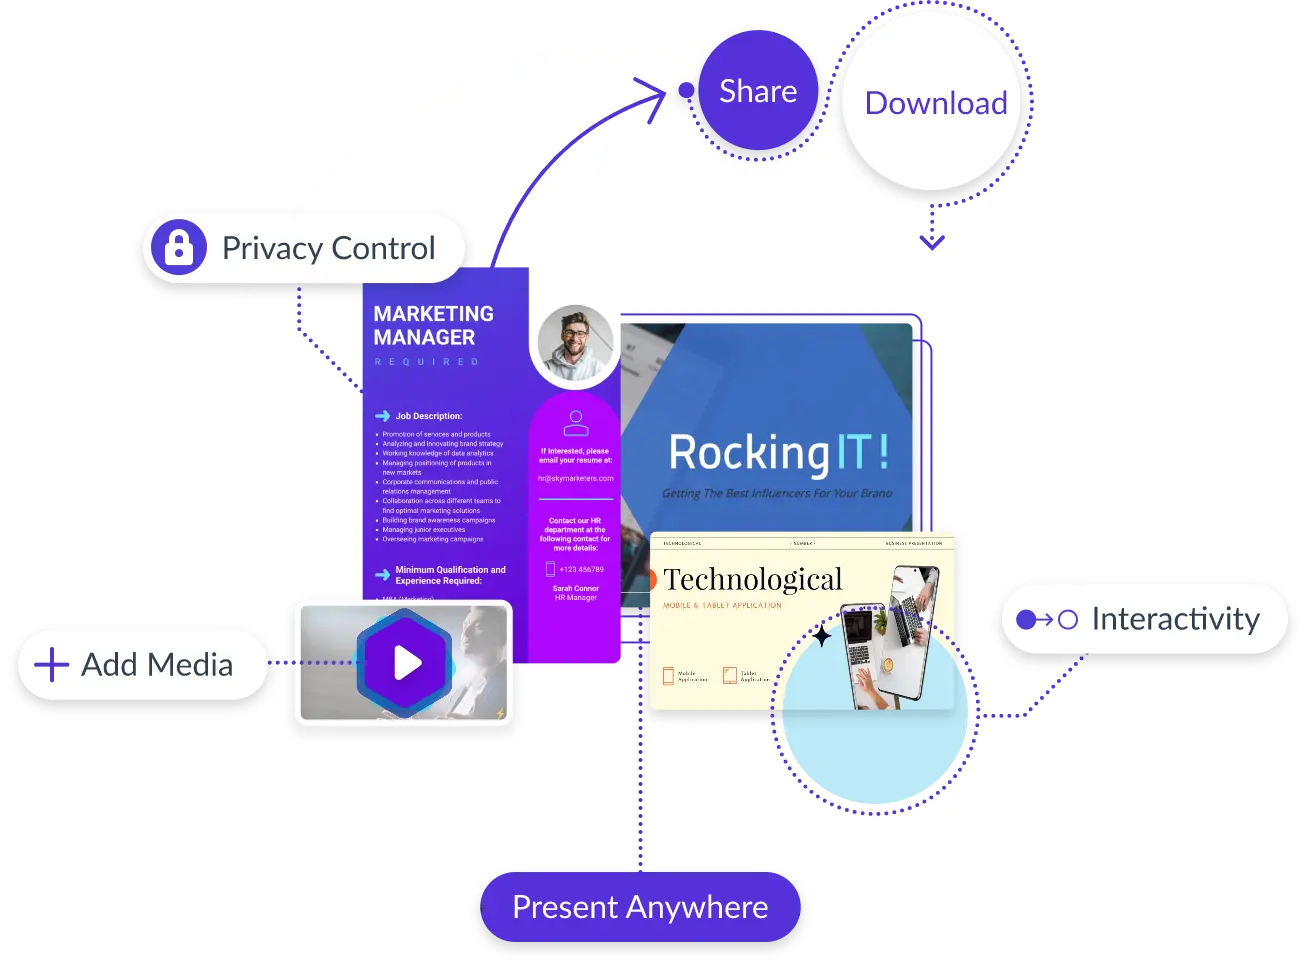
  • Add animation, interactivity, audio, video and links
  • Download in PDF, JPG, PNG and HTML5 format
  • Create page-turners with Visme’s flipbook effect
  • Share online with a link or embed on your website

Feel free to modify this template as per your needs, or explore more options in Visme pie chart templates designed for a variety of business needs.

Edit this template with our pie chart maker!

Regional Sales Comparison Pie Chart Template
Template Specifications
  • Dimensions

    All chart templates come in two sizes: horizontal (1920 x 1080 pixels) and square (800 x 800 pixels)

  • Customizable

    This chart template can be fully customized. You can edit content, change image(s), apply custom colors, add or subtract pages and more.

  • Formats

    Can be shared as public or private link online, embedded to a site or blog, or downloaded as JPG, PNG, PDF or HTML5. If downloaded as an image, you can also insert into other documents and presentations.

Compatibility

Related Charts & Graphs

Camera Companies Sales Pie Chart Template
Camera Companies Sales Pie Chart Gain insights into the camera sales of different companies with this alluring pie chart template.
Type of Transportation Pie Chart Template
Type of Transportation Pie Chart Get an overview of various transportation options with this intuitive pie chart template.
Program Participants Age Group Pie Chart Template
Program Participants Age Group Pie Chart Visualize the age distribution of your program participants with this easy-to-understand pie chart template.
Popular Internet Browsers Pie Chart Template
Popular Internet Browsers Pie Chart Analyze usage data for popular internet browsers using this informative pie chart template.
Popular Ride Sharing Apps Pie Chart Template
Popular Ride Sharing Apps Pie Chart Present a comparison of different ride-sharing apps usage using this detailed pie chart template.
Beverage Consumption Pie Chart Template
Beverage Consumption Pie Chart Monitor your beverage consumption with this visually appealing pie chart template.
Personal Expense Report Pie Chart Template
Personal Expense Report Pie Chart Track your personal expense reports effortlessly with this convenient pie chart template.
Successful Sports Teams Pie Chart Template
Successful Sports Teams Pie Chart Showcase your favorite sports team's success with this irresistible pie chart template.
Expenditure Summary Report Pie Chart Template
Expenditure Summary Report Pie Chart Decode your company's expenses easily with this expenditure summary report pie chart template.
Customer Feedback Pie Chart Template
Customer Feedback Pie Chart Harness valuable customer opinions with this customer feedback pie chart template.
Car Sales Distribution Pie Chart Template
Car Sales Distribution Pie Chart Leverage this pie chart template to graphically display your car sales data distribution.
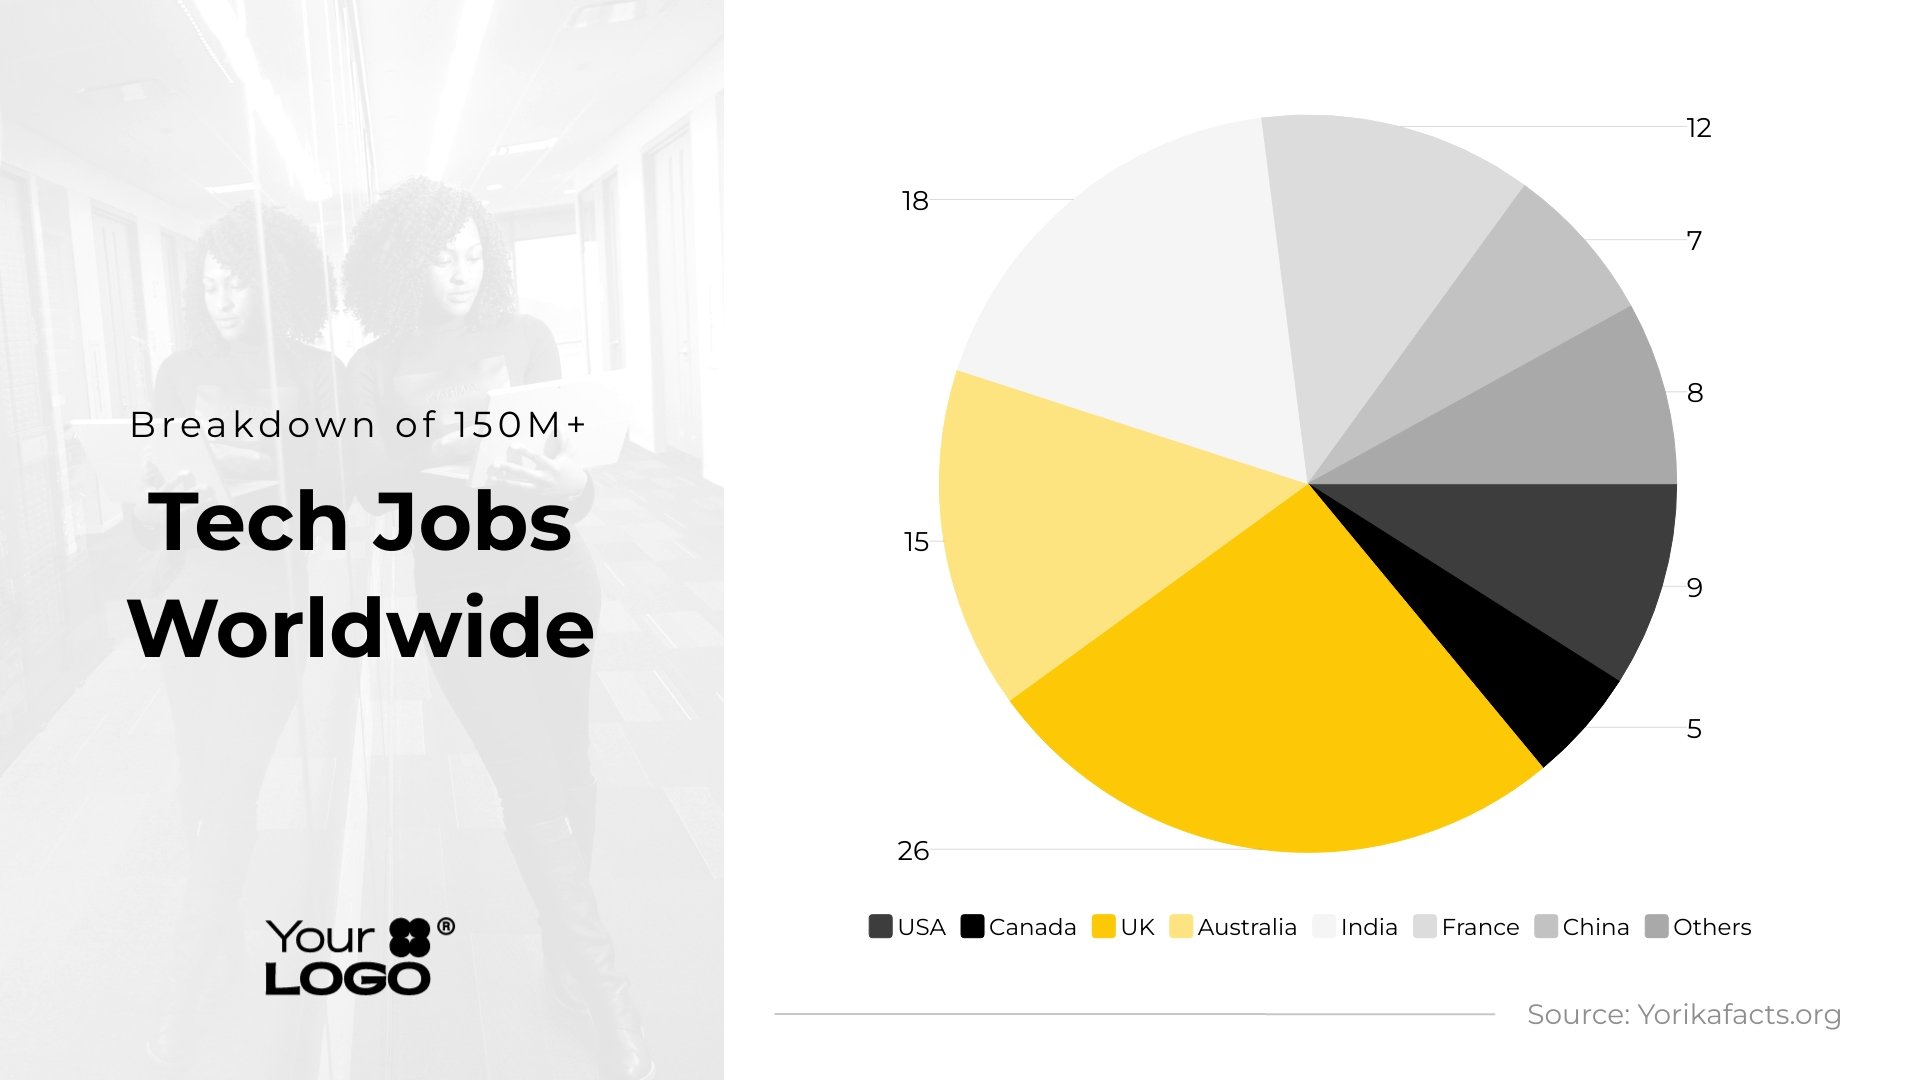
Global Breakdown of Tech Jobs Pie Chart Template
Global Breakdown of Tech Jobs Pie Chart Present a global overview of tech jobs with this modern pie chart template.
Impact Of Content Marketing Pie Chart Template
Impact Of Content Marketing Pie Chart Get a holistic view of the impact of your content marketing with this modern pie chart template.