Template Specifications
-
Dimensions
All chart templates come in two sizes: horizontal (1920 x 1080 pixels) and square (800 x 800 pixels)
-
Customizable
This chart template can be fully customized. You can edit content, change image(s), apply custom colors, add or subtract pages and more.
-
Formats
Can be shared as public or private link online, embedded to a site or blog, or downloaded as JPG, PNG, PDF or HTML5. If downloaded as an image, you can also insert into other documents and presentations.
Compatibility
Related tags
Related Charts & Graphs


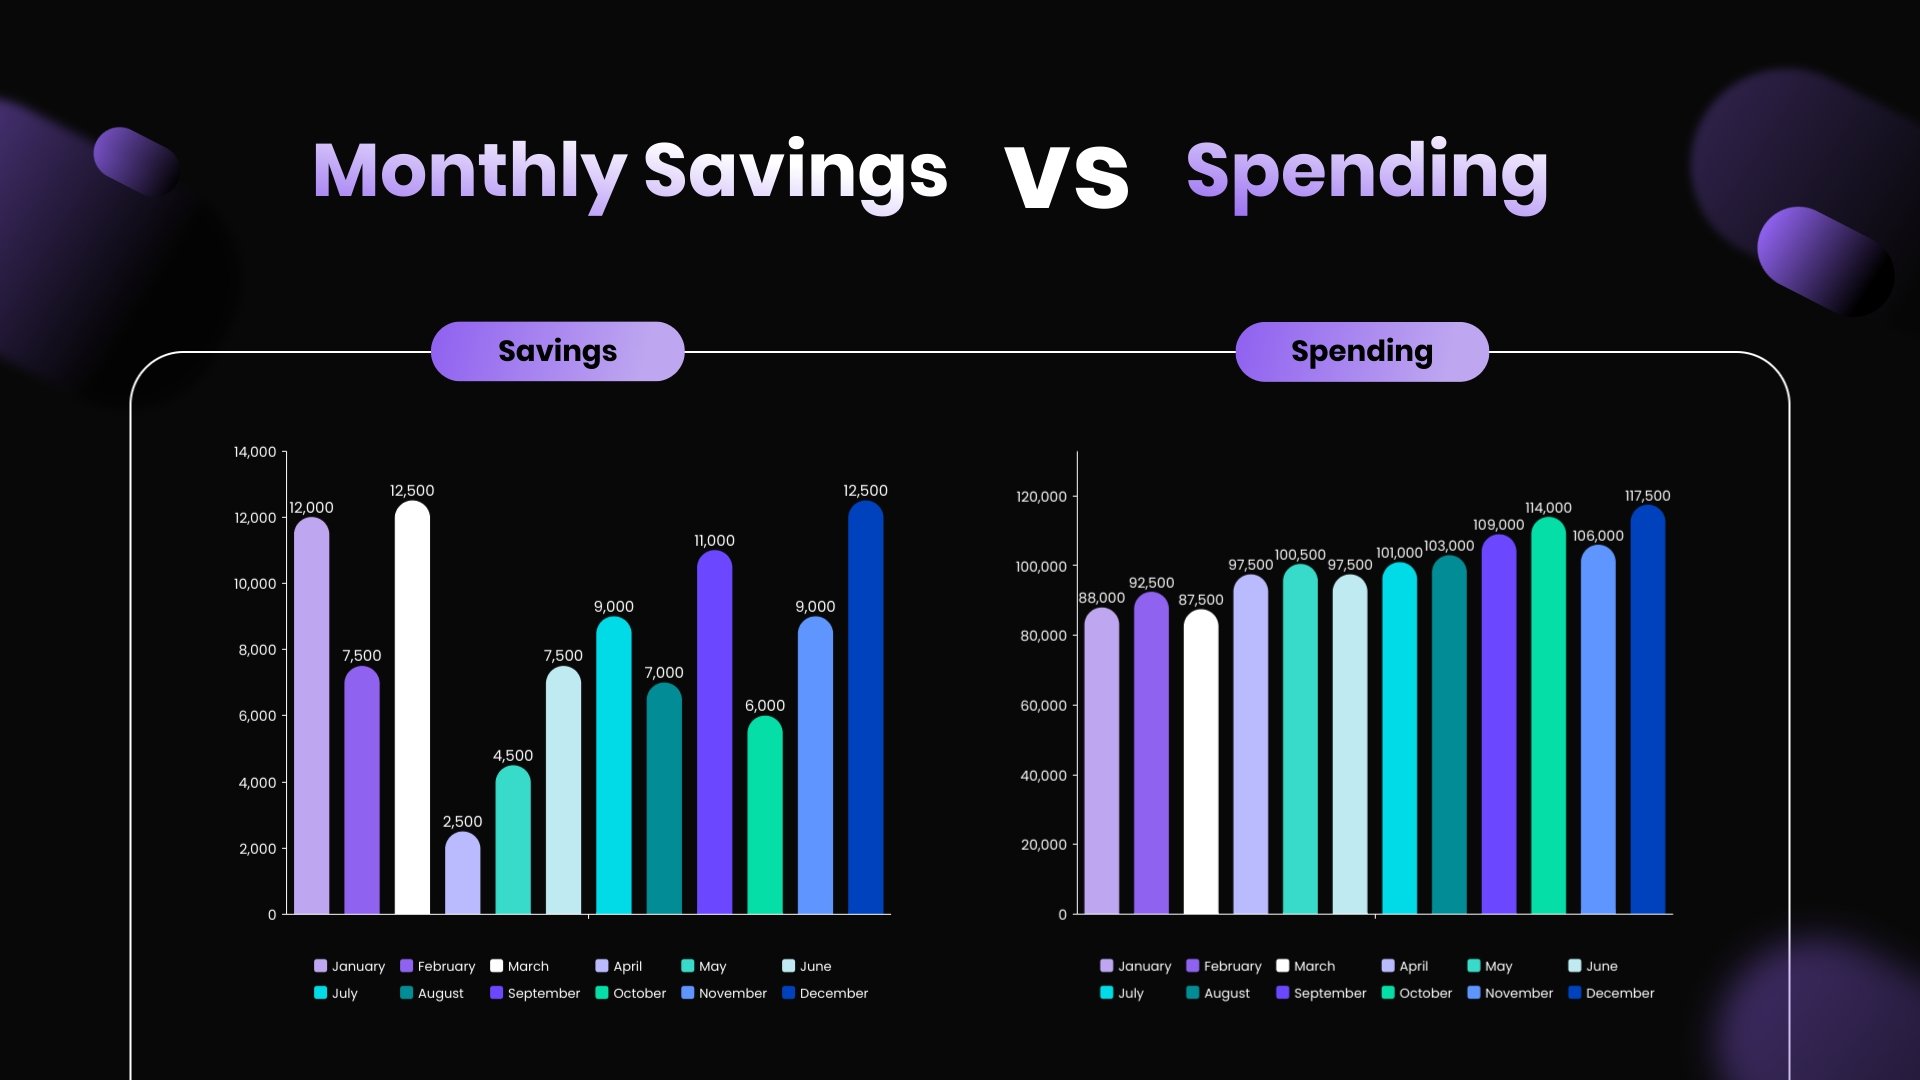
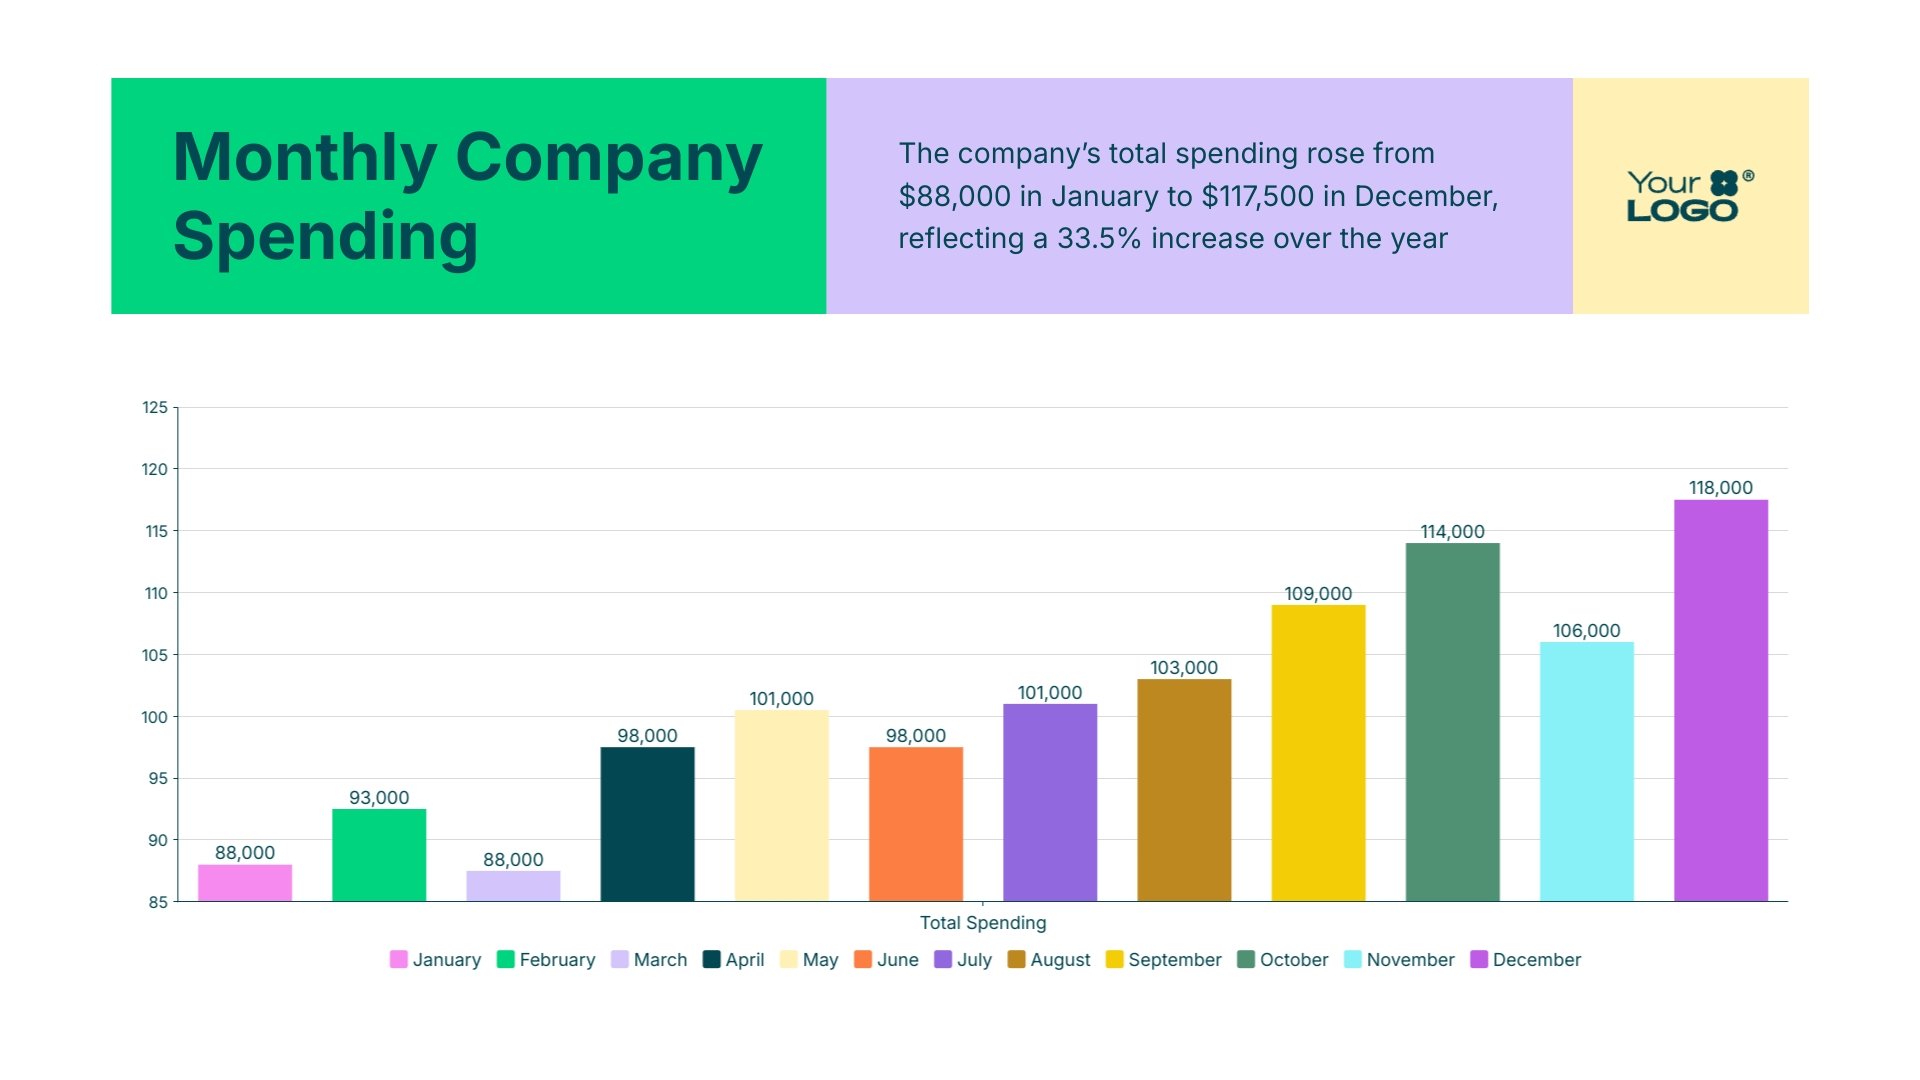
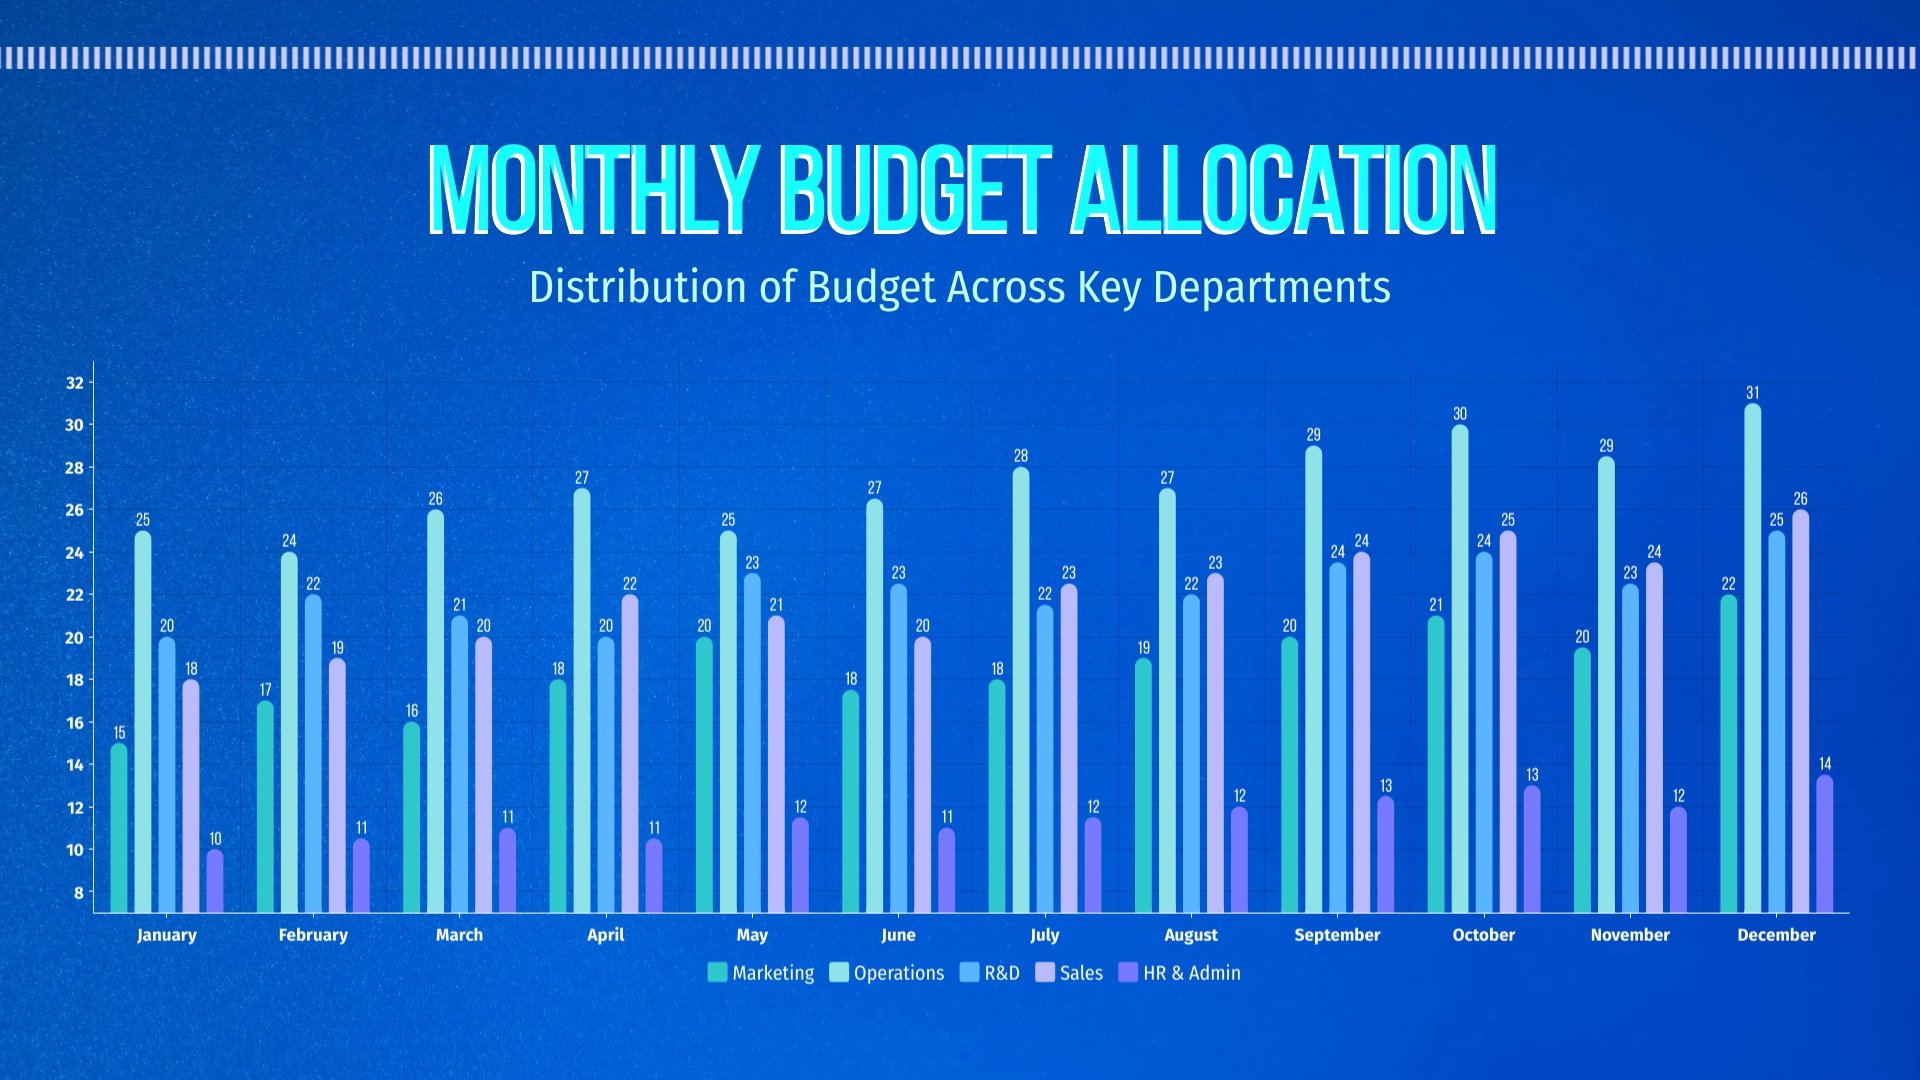
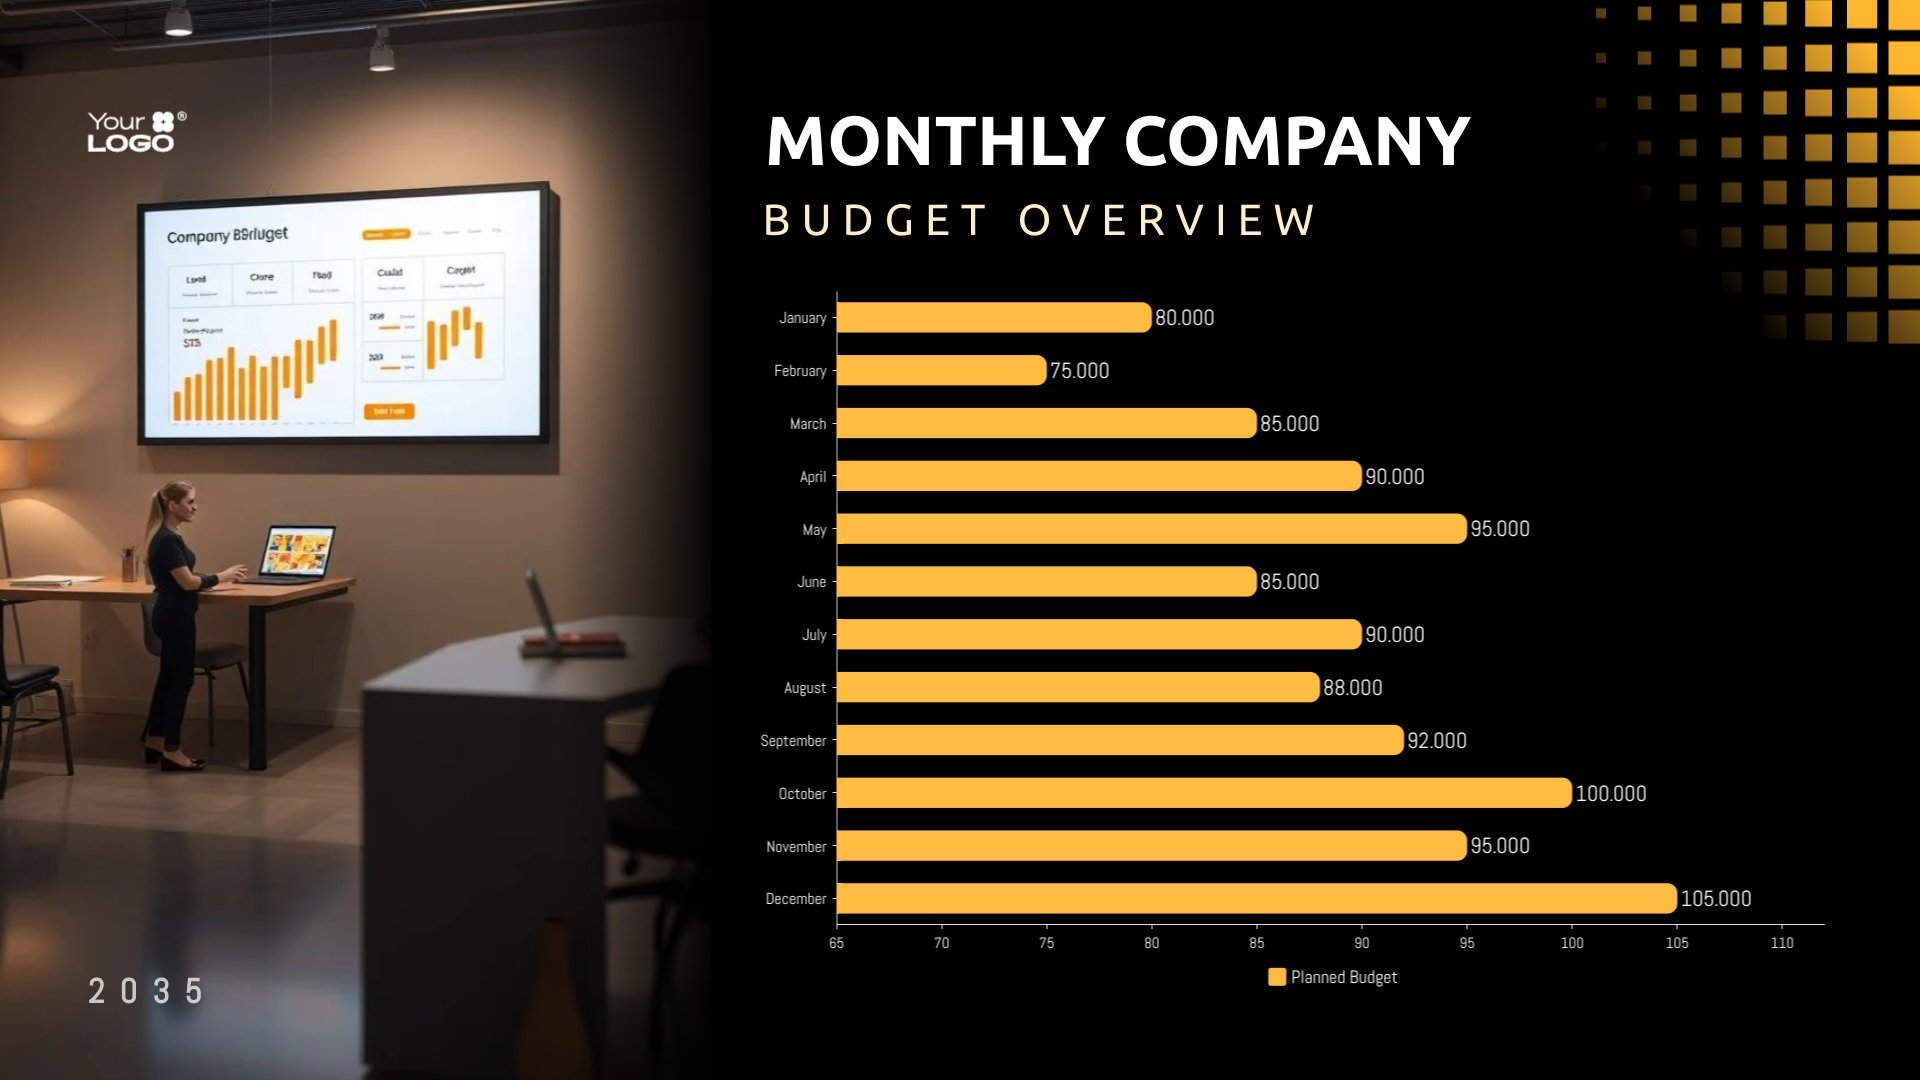

How Long to Keep Documents Bar Graph
Create a visual guide on how long to retain different types of documents using this horizontal bar graph template, which features a 3D icon.
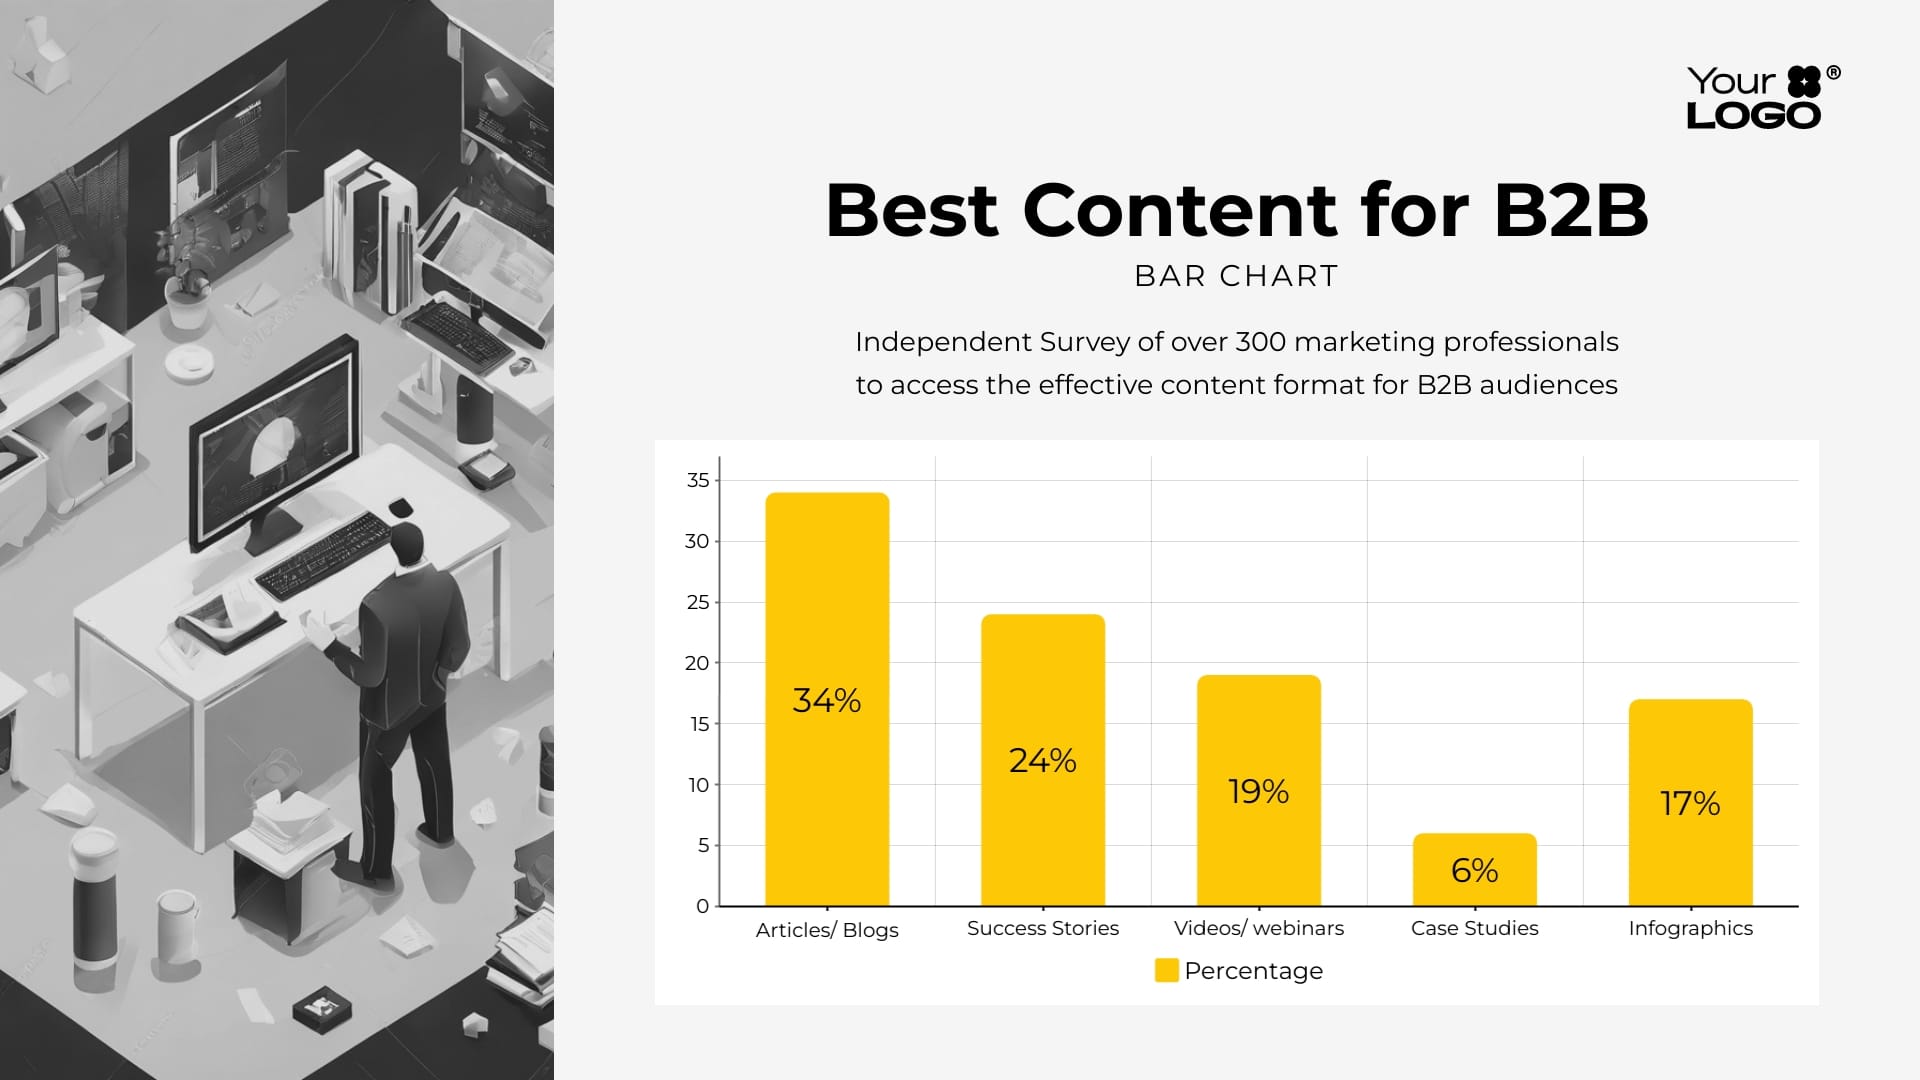

Online Vs Classroom Learning in COVID-19 Bar Graph
Compare the trends in earning during the COVID-19 pandemic with this versatile bar graph template.

Associate Professor to Professor Bar Graph
Highlight the promotion journey from associate professor to professor with this informative bar graph template.

Investment in Bangladesh Bar Graph
Showcase a comprehensive view of investments in Bangladesh using this detailed bar graph template.

Departmental Budget Sheet Bar Chart
Manage and visualize your department's budget with this clear and straightforward bar chart template.

Percentage Rise In Home Prices Bar Graph
Analyze and present the fluctuation in home prices with this bar graph template.
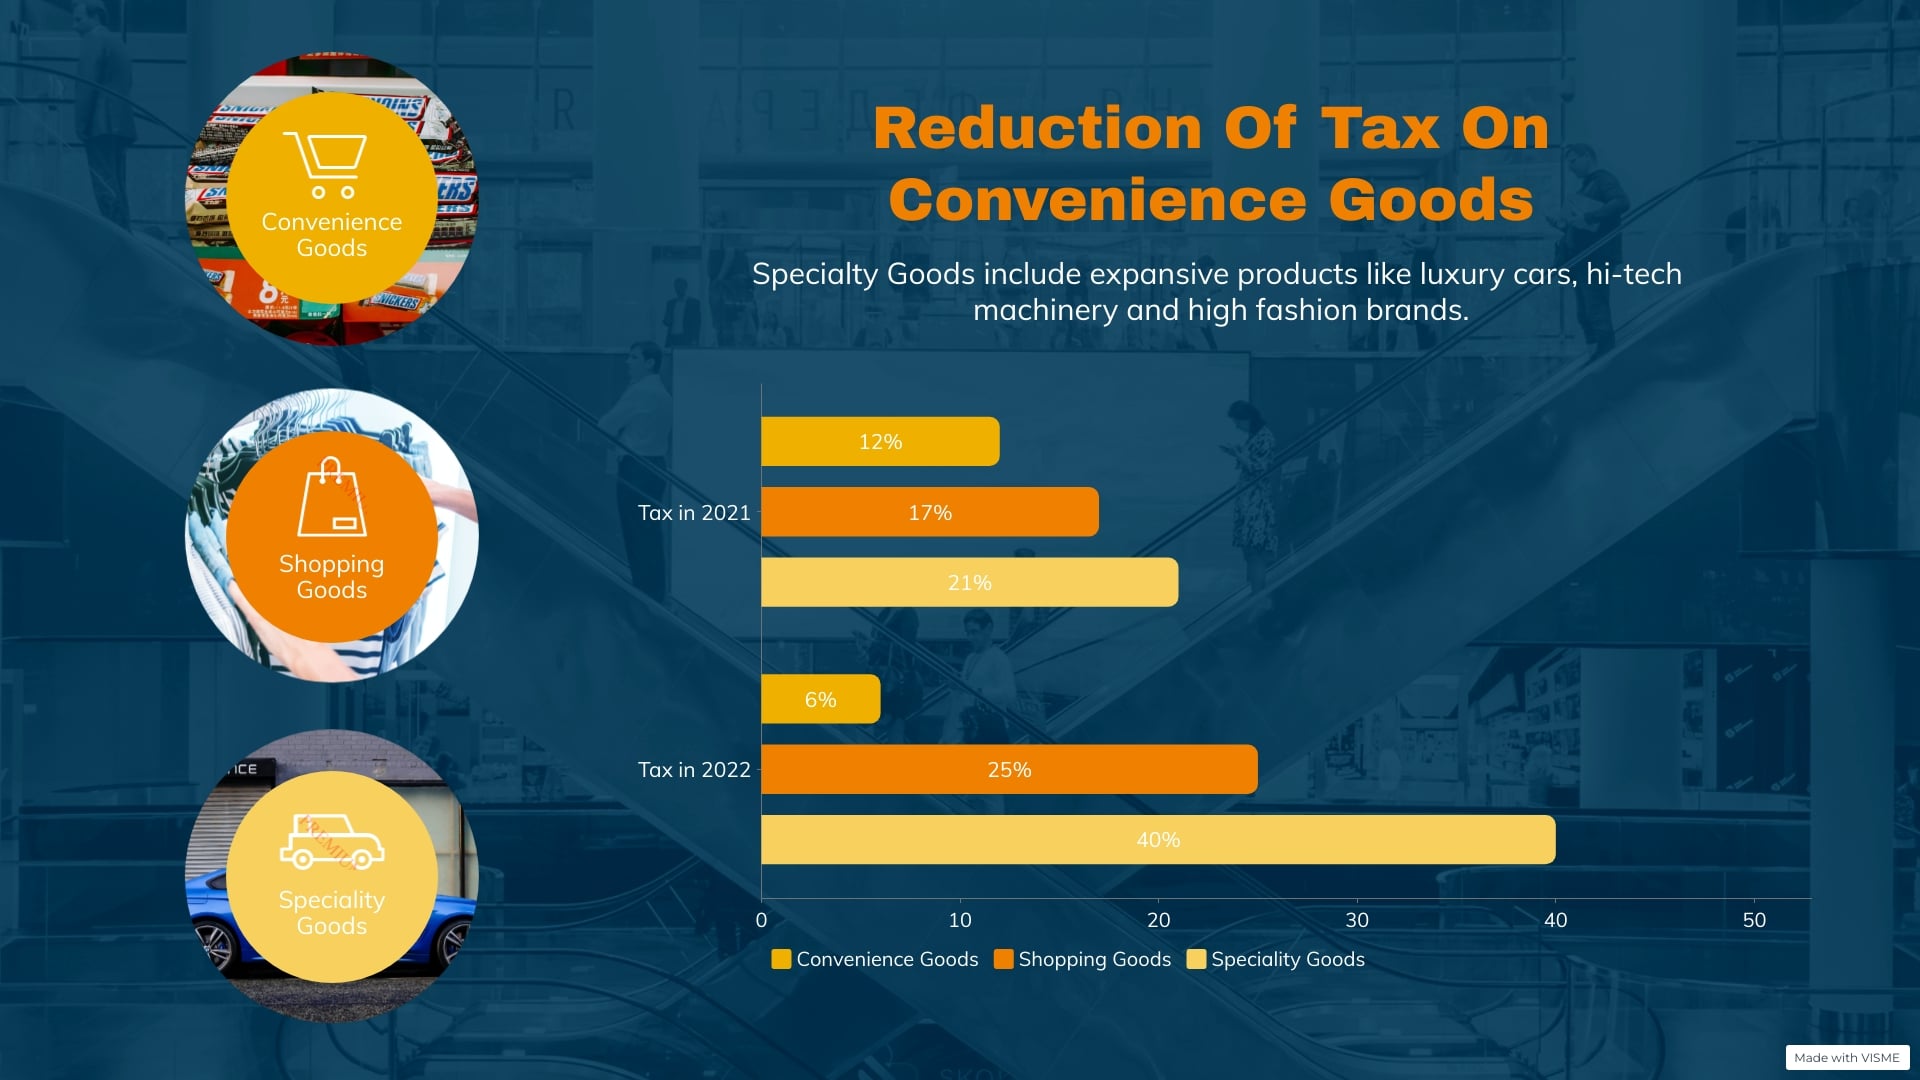
Sales Tax Change on Goods Bar Graph
Visualize the impact of sales tax changes on goods prices with this informative bar graph template.

Smart Gadgets Annual Sales Turnover Bar Graph
Illustrate the yearly sales of smart gadgets with this brilliant bar graph template.
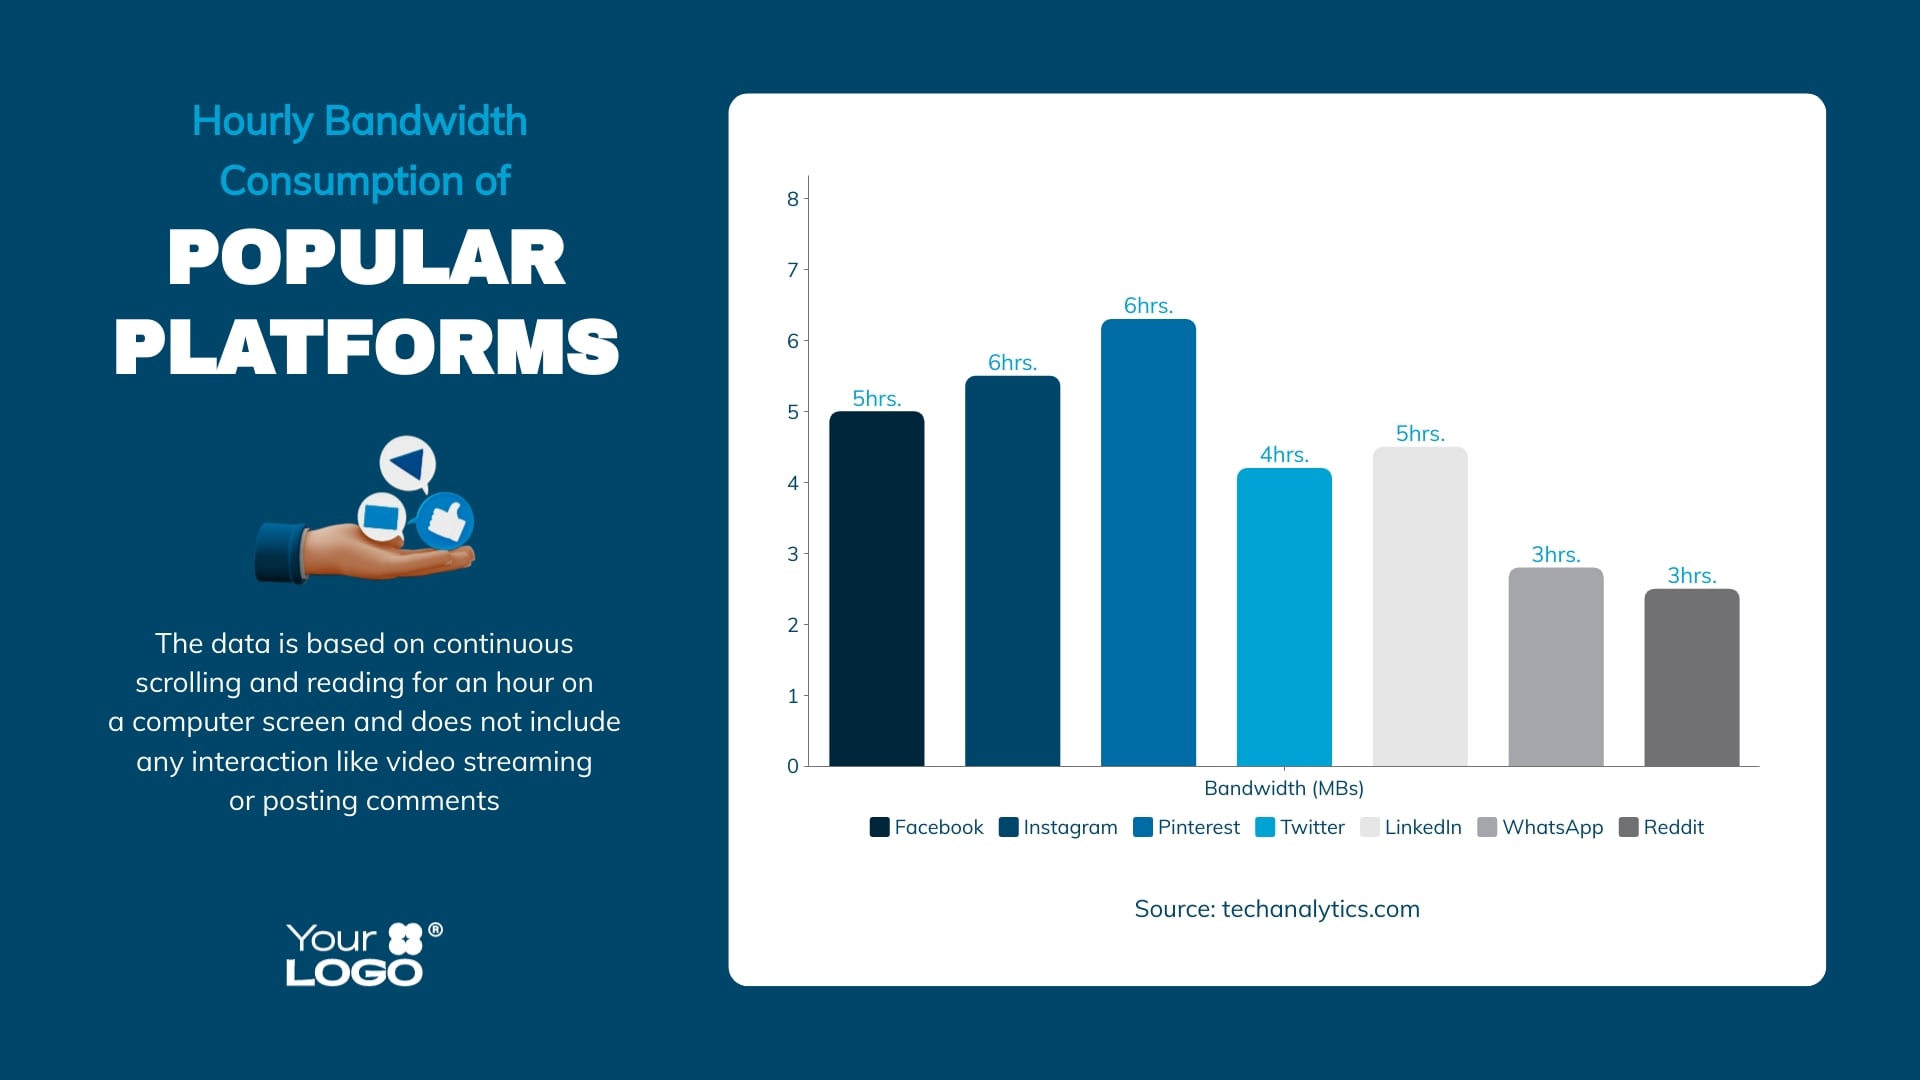
Bandwidth Consumption by Social Media Platform Bar Graph
Help your audience understand how different social media platforms consume bandwidth using this bar graph template.

Blockchain Technology Adoption Bar Chart
Track the adoption of blockchain technology across diverse sectors with this dynamic bar chart template.