Visualize Complex Data Easily with
Our AI Pie Chart Generator

It's free to sign up and easy to use.
Provide a prompt with your requirements and choose a preferred style from the options.
Visme's AI will generate a pie chart instantly, including images, colors, text and data.
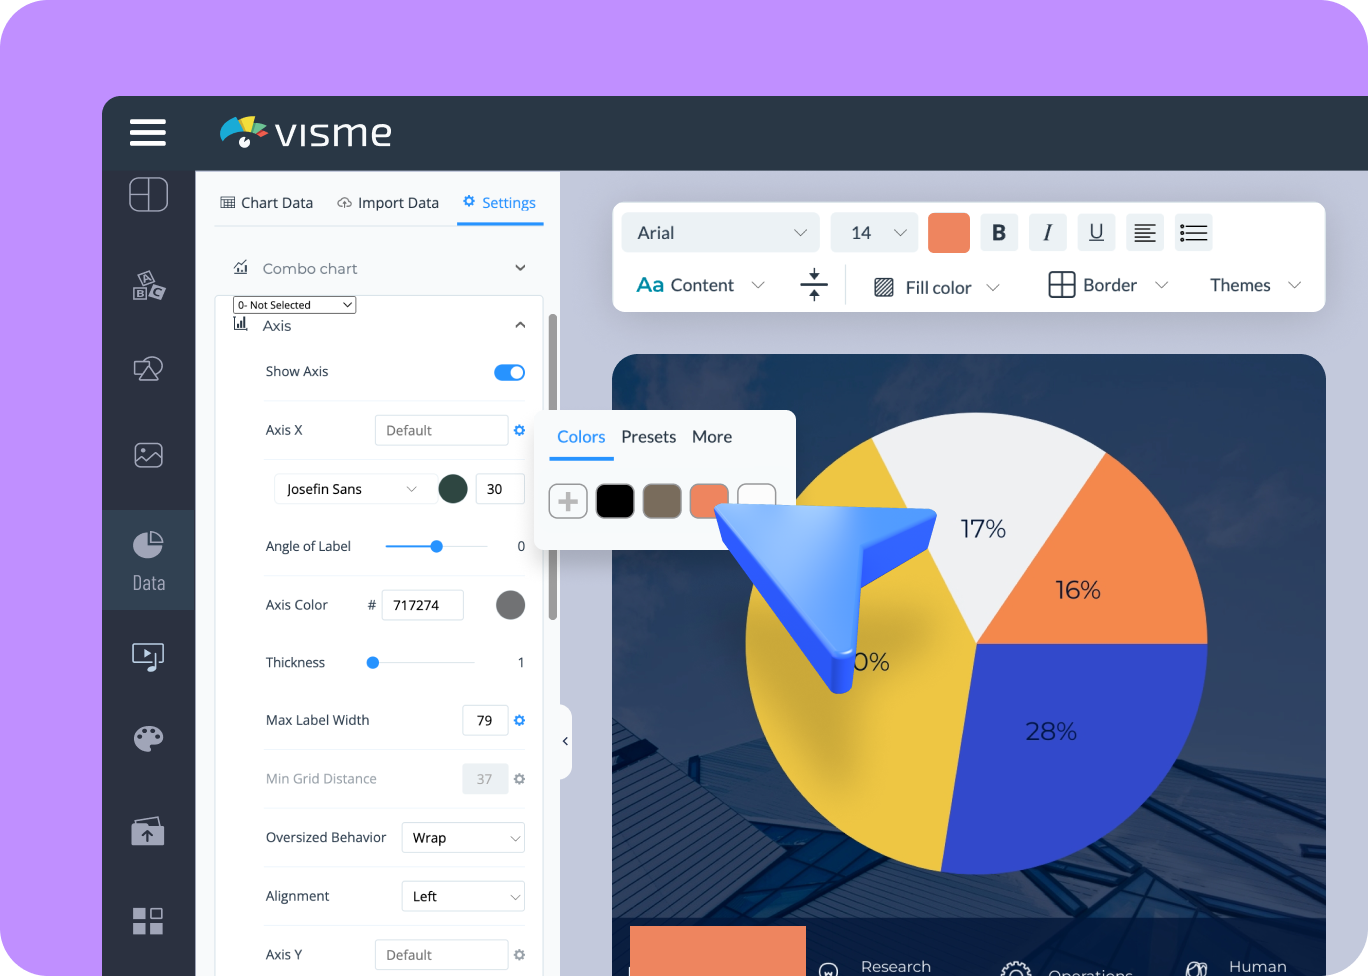
Customize your pie chart easily in Visme's editor to match your unique style.
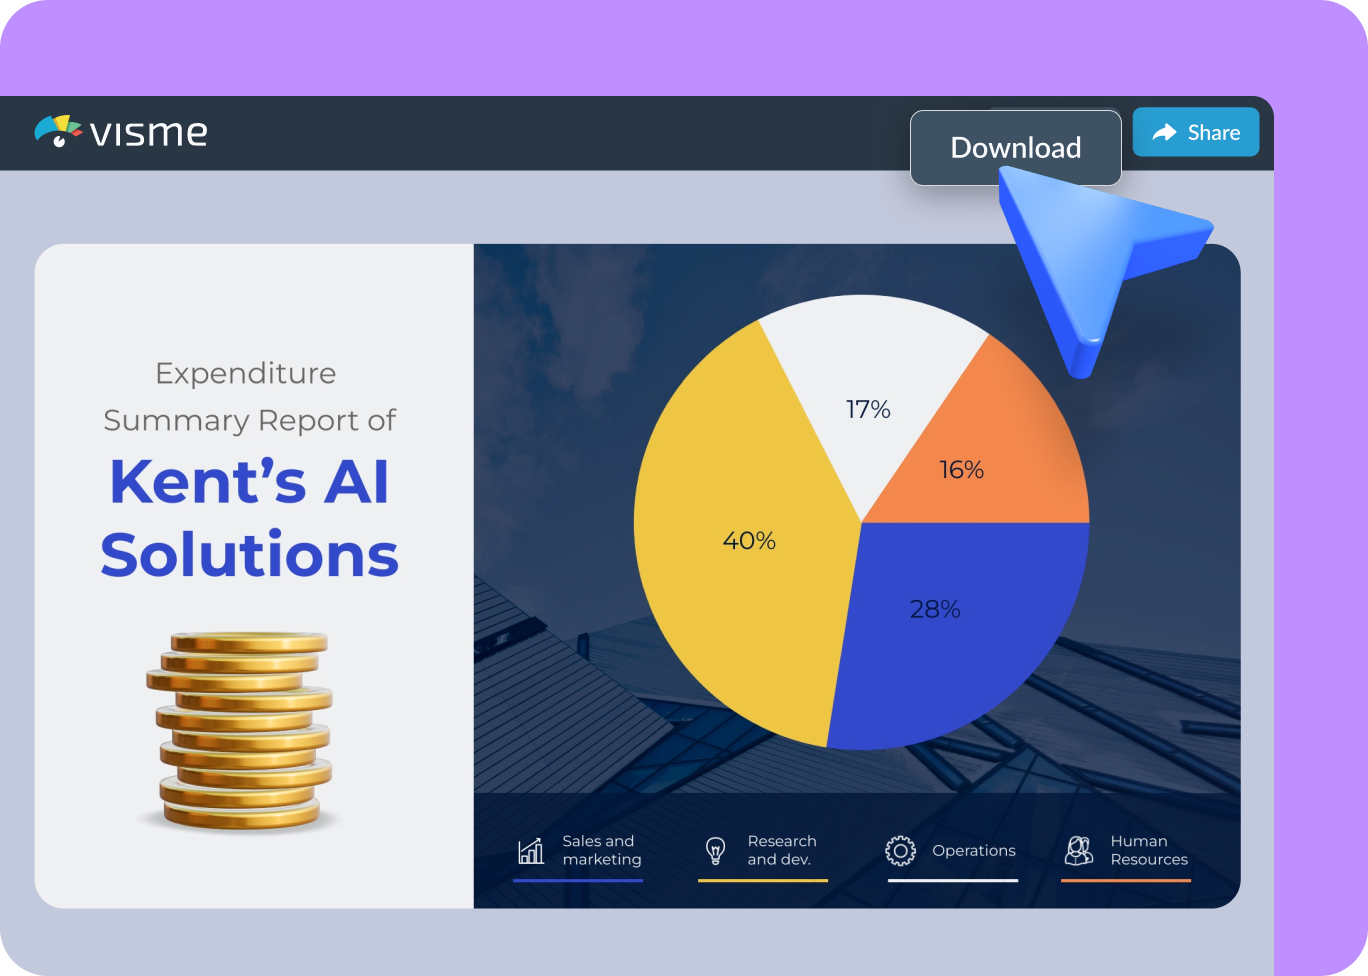
Upgrade to download your pie chart in PNG, JPG or PDF format, or share it online with a public or private link.
The leading visual communication platform empowering 34,300,000 users and top brands.
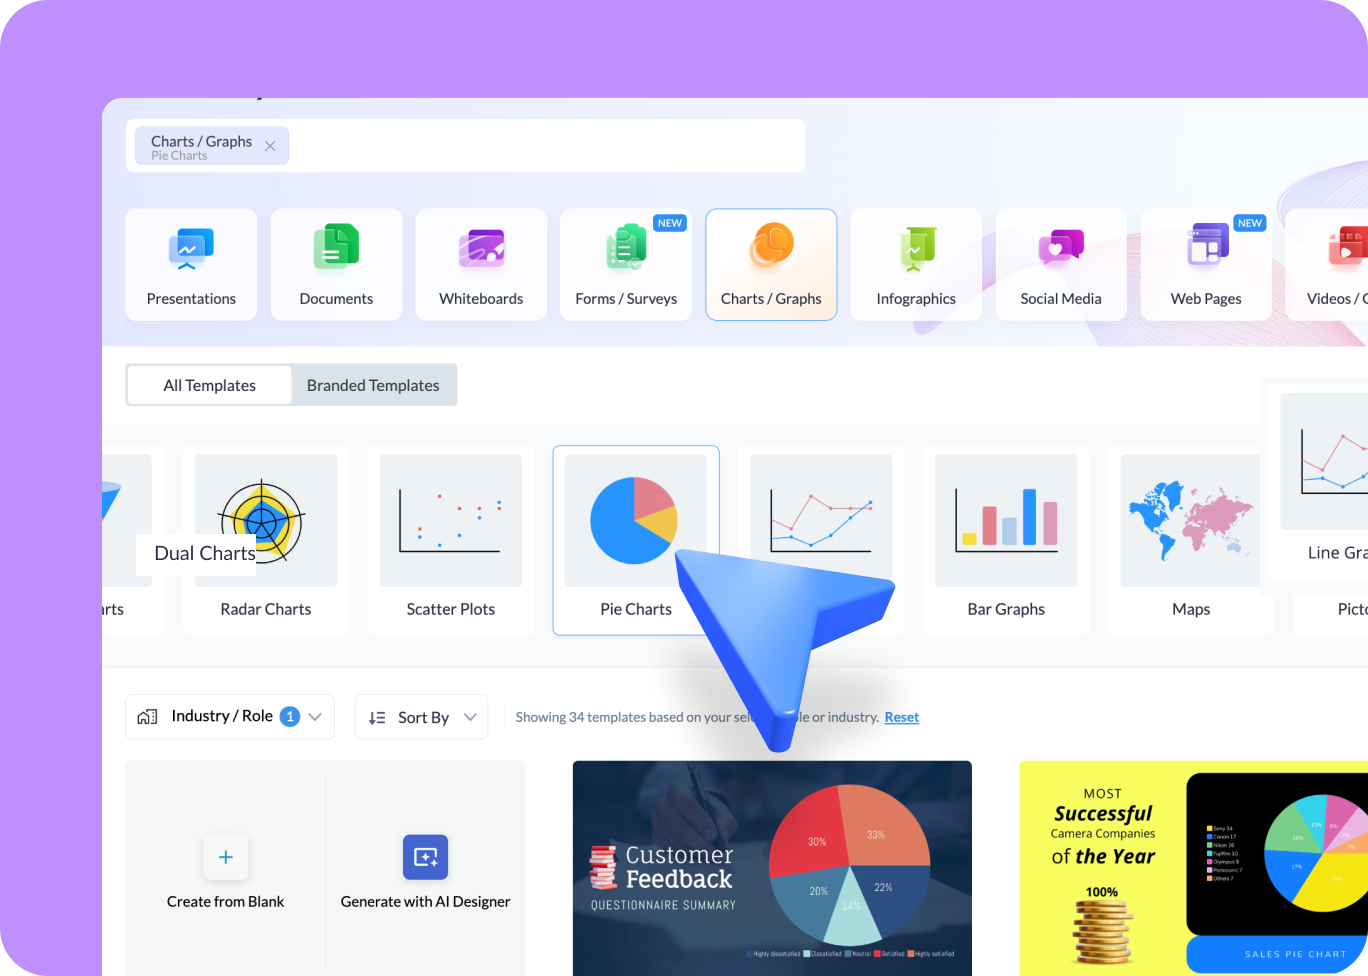
Easily Customizable
Pie Chart Templates
Visme comes with a huge library of pre-designed pie chart templates. These templates offer a solid start, allowing you to input your data seamlessly. They are fully customizable, so you can add labels, adjust color, integrate data and customize the visual elements to present your data insights.


Pie Chart Generator Features
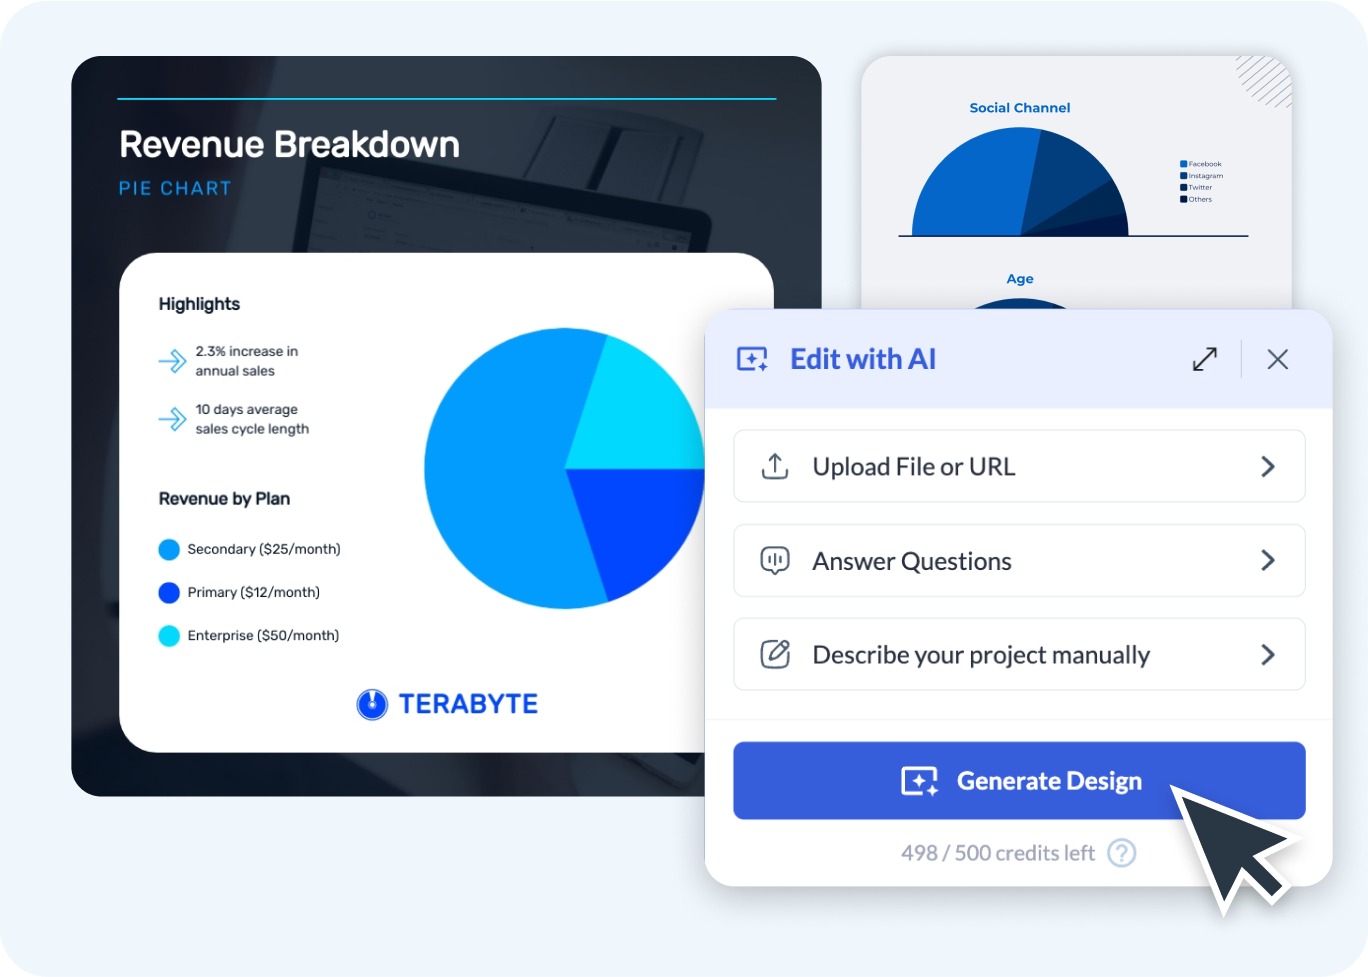
AI-Powered Design Tools
Visme offers a suite of AI tools that simplify the creation of pie charts. Give a prompt to the AI tool explaining your requirements and it will generate a complete pie chart for you in seconds. Additionally, you can use the AI search bar to find and integrate design elements, ensuring your pie chart is both accurate and visually compelling. You can also use Visme’s AI image generator to create unique and relevant visuals supporting your pie chart’s data.
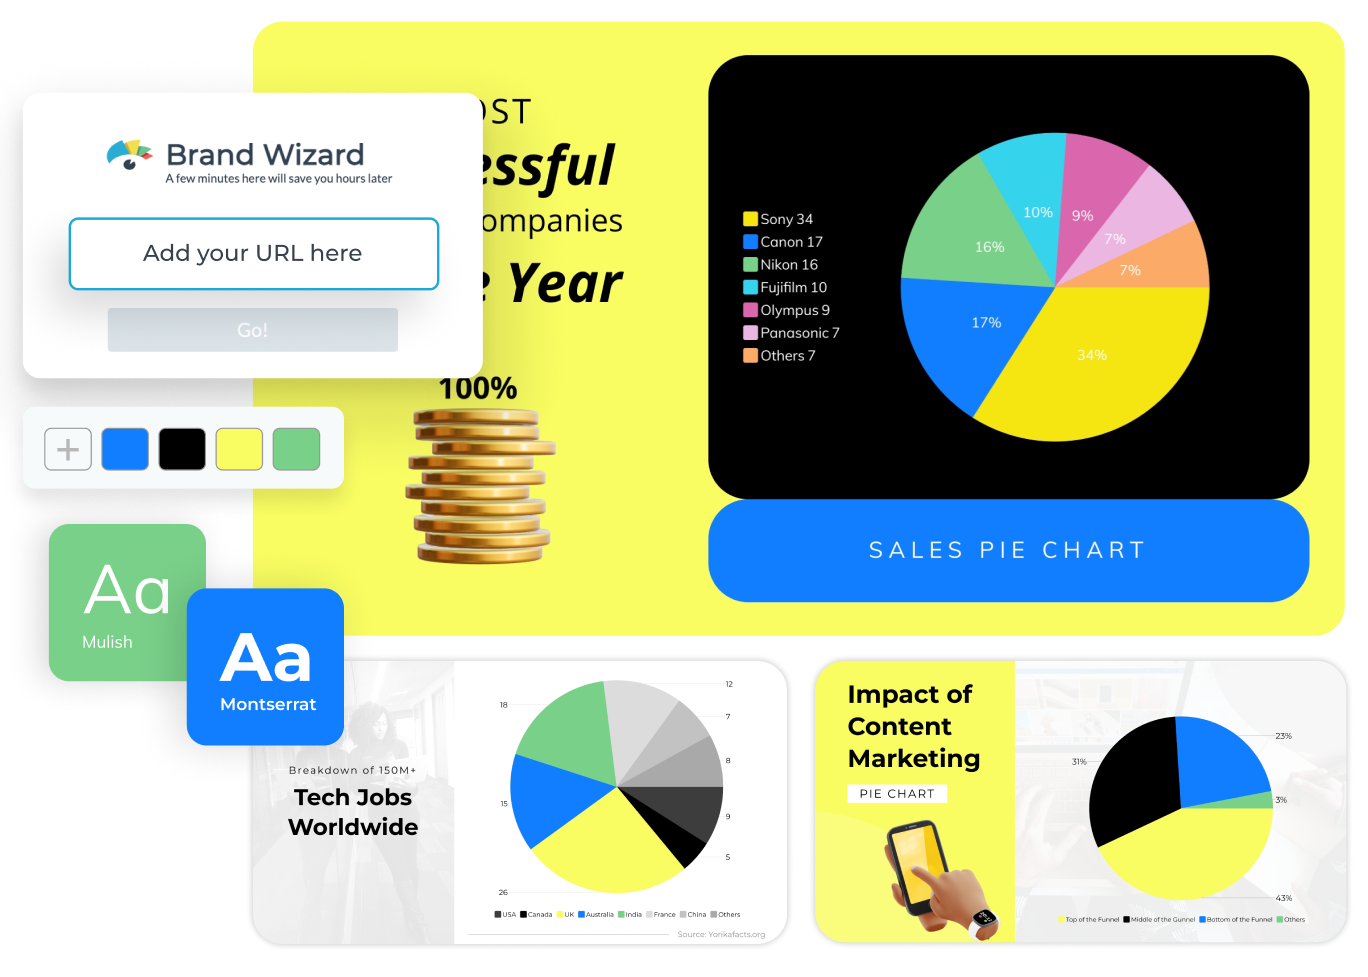
Brand Design Tool
Maintain a consistent brand identity across all your pie charts using Visme’s brand design tool. All you have to do is enter your website URL and the brand wizard will automatically extract your brand colors, fonts, and logo and save them to your account. You can apply these elements to any design in Visme with a single click. This ensures that all your visuals align with your brand guidelines, reinforcing your brand identity and making your charts instantly recognizable.
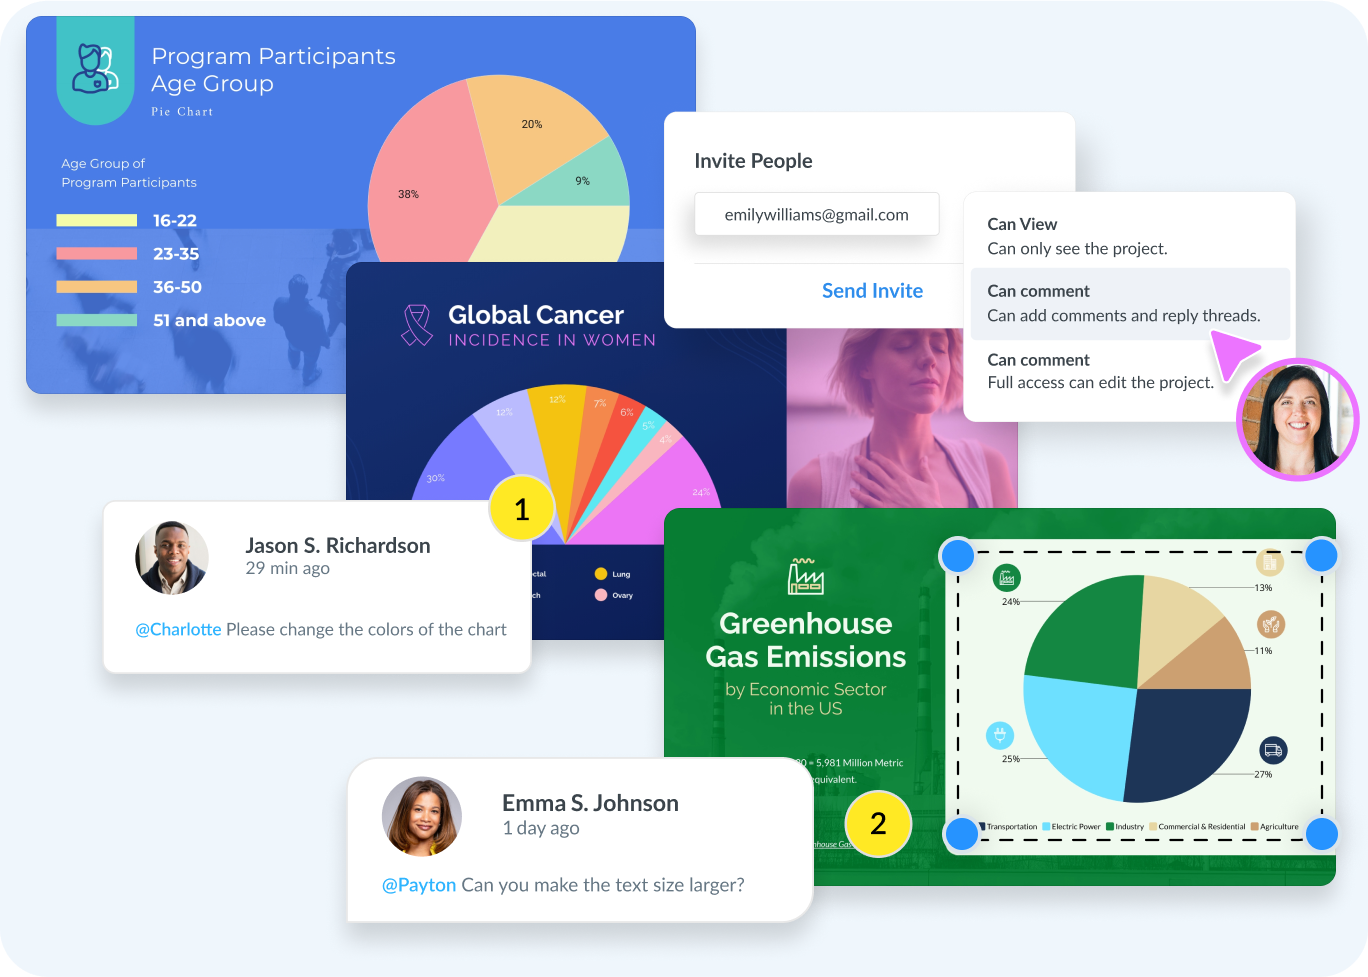
Real-Time Collaboration Features
Visme’s real-time collaboration tools allow teams to collaborate easily on pie charts. You can invite team members to your project using email or a shareable link. Once they join, multiple users can edit the chart simultaneously, leave comments and make notes directly on the pie chart. This collaborative approach keeps everyone updated, making it easier to create polished, professional-quality charts.
More Great Features of the Pie Chart Generator
Drag-and-Drop Editing
Modify your pie chart effortlessly with Visme’s drag-and-drop interface—perfect for beginners and professionals alike.
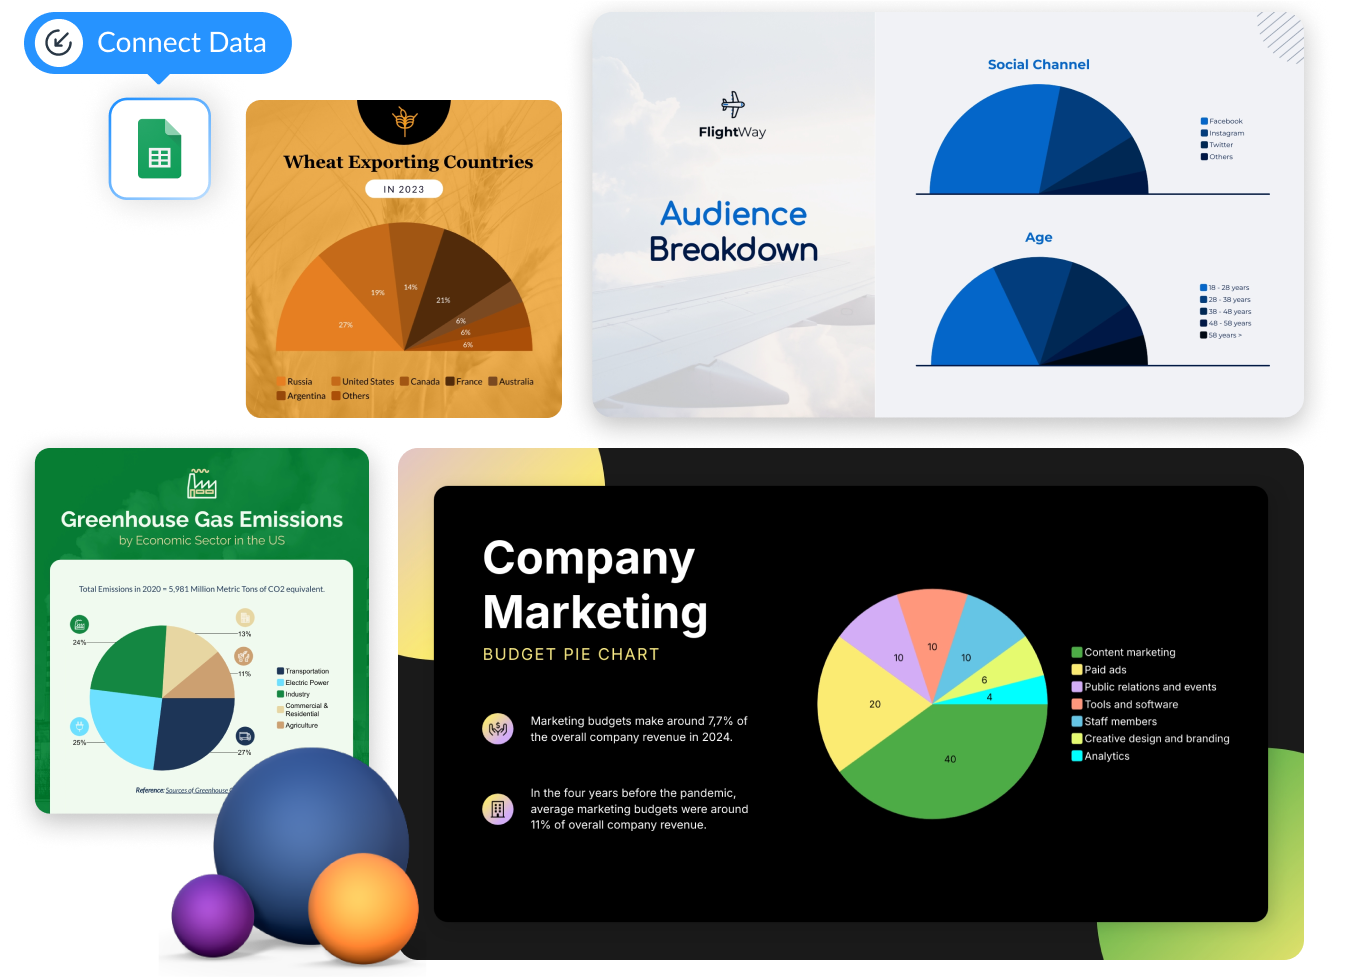
Live Data Integration
Connect with Google Sheets or MS Excel to automatically update your pie chart with the most current data.
Pie Chart Templates
Use a variety of customizable templates to tailor your pie chart to meet your specific data visualization needs.
Color Coding
Apply preset color themes or use your own brand colors to make your pie chart visually distinct and engaging.
Engaging Graphics
Access a range of graphics, including vector icons and illustrations, to add more context and detail to your charts.
Multimedia Enhancements
Enhance your pie charts by embedding videos or screenshots to make them more engaging for viewers.
Real-Time Collaboration
Work with your team live to edit, comment and refine your pie chart collaboratively.
Interactive Elements
Add hover effects, clickable elements, or animations to make your pie chart more engaging for your audience.
Analytics Insights
Use analytics to understand viewer interactions, such as time spent on the chart and the number of unique views.
Version Control
Access and restore previous versions of your pie charts, allowing you to manage changes.
Easy Sharing Options
Upgrade to download your pie chart in PNG, JPG, PDF, or GIF formats, or share it online with a link or an embed code.
One-Click Chart Switch
Easily transform your pie chart into 25+ other chart types—bar, line, or donut charts—with a single click.

Learn More
What is a Pie Chart?
A pie chart is a visual tool that shows how different pieces of a whole compare with each other. It uses slices to represent data points, making it easy to see which parts are bigger or smaller. Pie charts are great for displaying proportions and percentages in a simple, easy-to-understand format.
You can use pie charts to quickly show important information and help your audience understand how your data is distributed.
Use Visme's Pie Chart Generator to Present Data Effectively
Create clear and attractive pie charts that show your data effectively with Visme's pie chart creator. Simply enter your prompt, and your pie chart will come to life. Visme offers customizable templates, easy design tools and real-time collaboration features to help you make eye-catching pie charts in a few clicks.
Everything you need + more
More Than Just Pie Charts

Make it engaging
Interactivity
Create interactive reports with popup and rollover effects that allow your viewer to interact with your design to learn more information.

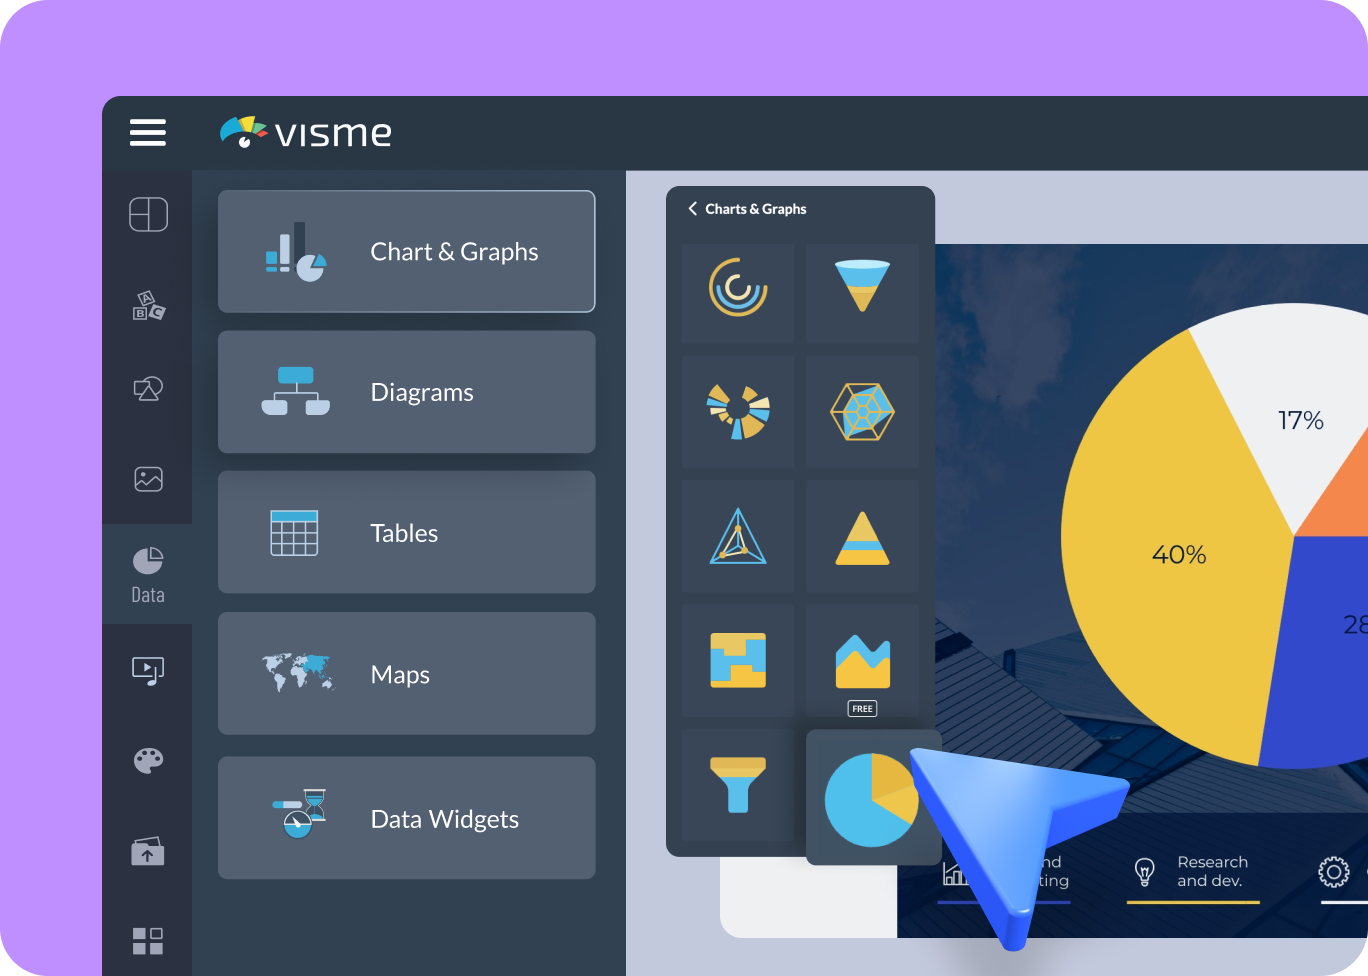
Visualize your data
Charts & Graphs
Showcase sales, marketing, website data and more in your reports with Visme’s easy-to-use charts, graphs and other data visualization tools.

Beautify your content
Video & Animation
Choose from over a million stock photos, icons, illustrations, characters, lines, shapes and more to create a completely unique report.
How it works
How to Create Pie Charts in 5 Simple Steps
Visme's AI pie chart generator makes it easy to turn numbers into engaging pie charts. Simply give your prompt, pick a style and our tool will quickly create a neat pie chart for you. You can use it to illustrate complex information and improve your reports and presentations. Visme ensures that every step is simple and efficient.
Here's your guide to creating a pie chart in Visme:
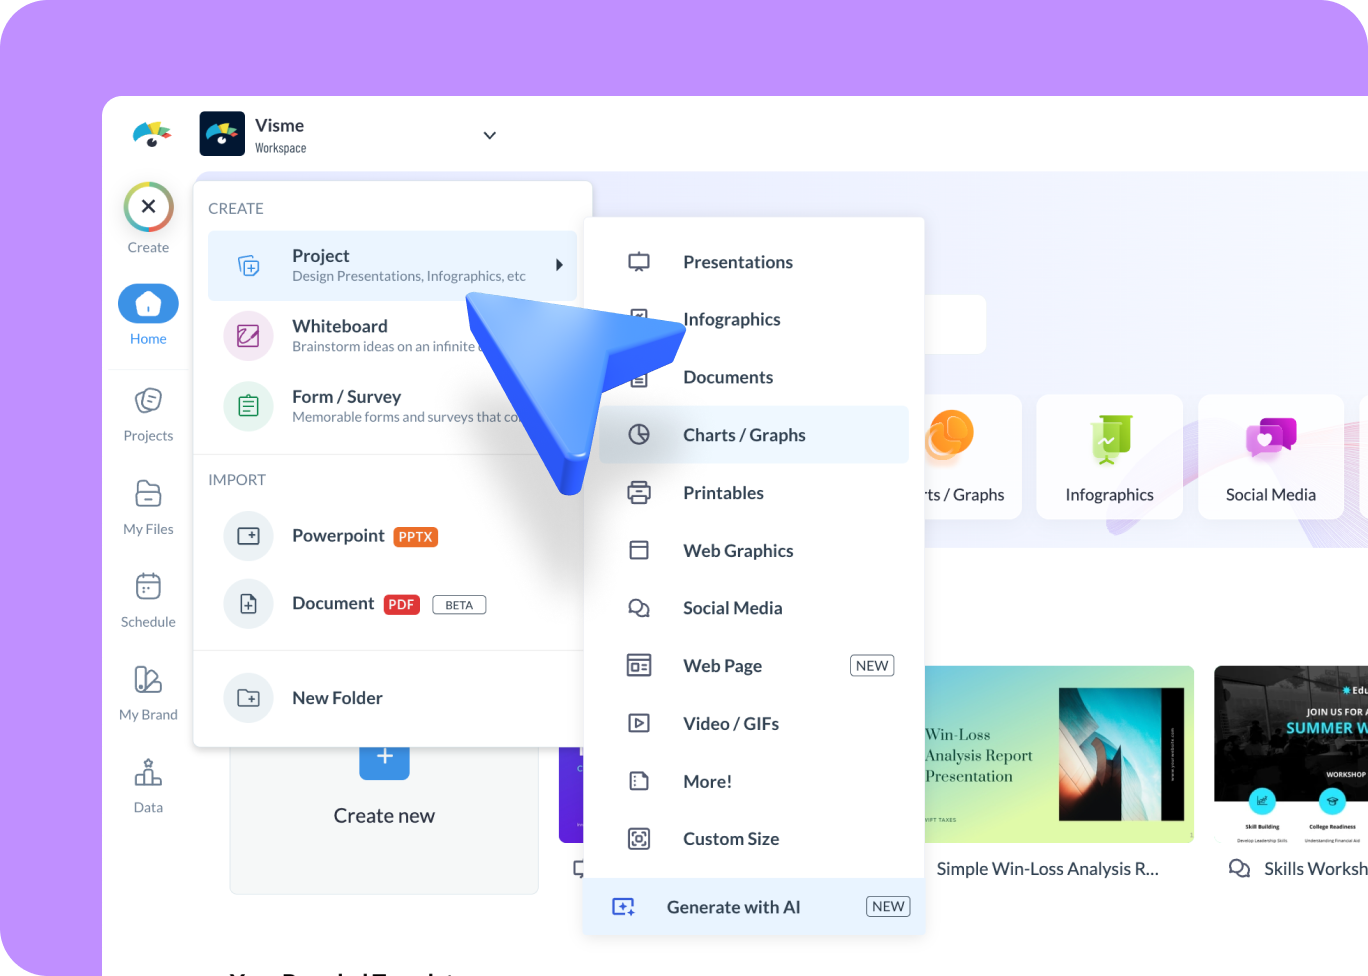
- Sign up using your email and password to create a free account in Visme and start your design process.
- Prompt Visme’s AI pie chart generator to describe your data clearly and how you want the chart to look. The AI will then generate the first version of the chart based on your input.
- Pick a style from the options available, and our AI will create a pie chart based on your chosen style, complete with images, colors, text and data.
- Use Visme’s powerful editor to customize your pie chart by adjusting data points, modifying design elements and more.
- Upgrade to download your pie chart in JPG, PNG or PDF formats, or share it online with a public or private link.
Quick tips
Make the Most Out of Your Pie Charts
Use simple labels and clear titles to make your pie chart easy to understand.
Don't overload your pie chart with too many slices. Limit the number of categories for better clarity.
Choose colors that make the chart easy to read and fit your brand style.
Try to keep the overall design simple and minimal to make it easy on the eyes.
Use fonts that are simple and easy to read. Stick to one or two fonts to keep it clean.
Make sure your pie chart is large enough to show important details without being overwhelming.
If possible, add a short description or label to explain what the pie chart shows.
Use Visme's interactive features to make your pie chart even more engaging and dynamic.
Frequently Asked Questions (FAQs)
To generate a pie chart with Visme, simply enter your prompt into the AI pie chart generator, pick a style and customize it to make it your own.
Yes, Visme offers a free version of its ai pie chart tool, with basic features available to create simple charts. Advanced features, storage options and download options come with premium plans.
An AI-generated pie chart uses artificial intelligence to analyze your data and create an optimized, visually appealing chart. Visme’s online pie chart generator offers AI-powered options for quick and easy chart creation.
Yes, Visme’s pie chart tool is perfect for creating professional charts for business presentations, reports, and visual data storytelling.
Visme’s pie chart tool offers customizable templates, a user-friendly interface, and the ability to create both static and interactive pie charts, making it a powerful tool for data visualization.
Visme allows you to customize the colors, labels, size, and fonts of your pie chart to match your brand or presentation style.
Yes, Visme enables you to easily embed your pie chart on websites or blogs using a simple embed code or by downloading it as an image or interactive format.