1. Home
  2. Create Infographics
  3. Infographic Templates
  4. GDP Per Capita Choropleth Map Template

GDP Per Capita Choropleth Map Template

Use This Template

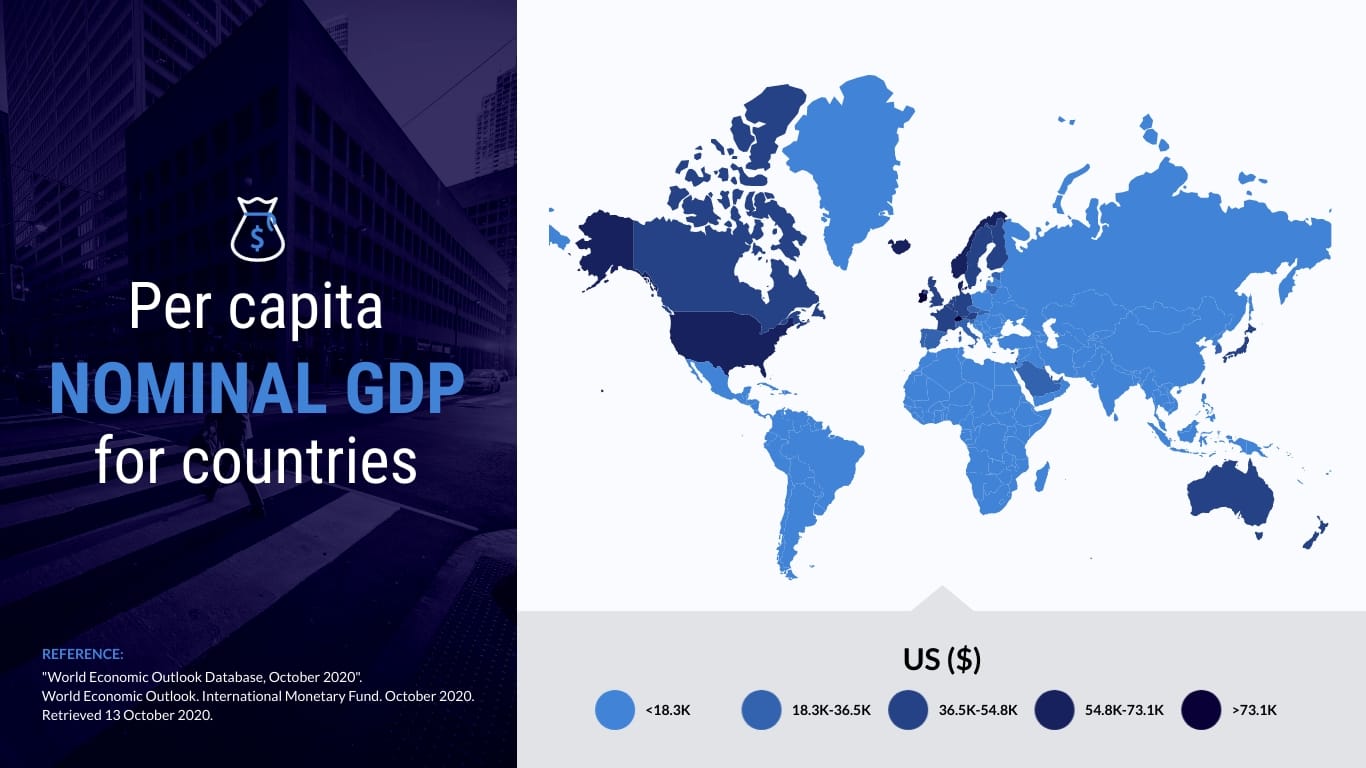
Illustrate the disparity in GDP per capita across regions with this comprehensive Choropleth map template.

Spice up your reports, projects, or website content by adding your data to the regional sections of the world map. Boasting stunning colors, it is perfect for economists, political scientists, cultural research analysts — or any student studying global development disparities. 

Personalize this template using Visme's convenient editor, and instantly transform complex economic data into an engaging, informative visual experience.

  • Change colors, fonts and more to fit your branding
  • Access free, built-in design assets or upload your own
  • Visualize data with customizable charts and widgets
  • Add animation, interactivity, audio, video and links
  • Download in PDF, JPG, PNG and HTML5 format
  • Create page-turners with Visme’s flipbook effect
  • Share online with a link or embed on your website

Edit this template or explore our map templates for your data visualization and presentation needs.

Edit this template with our infographic maker!
GDP Per Capita Choropleth Map Template
Template Specifications
  • Dimensions

    All infographic templates are 800 pixels wide with varying lengths. These dimensions can be easily changed and the length adjusted with a slider.

  • Customizable

    This template can be fully customized. You can edit content, change image(s), apply custom colors, input your own fonts and logo, and more.

  • Formats

    Download as a high resolution JPEG, PNG, PDF or HTML5, embed into a blog post or webpage, or generate a shareable link for online use.

Compatibility

Related Infographics

Agriculture Choropleth Map Template
Agriculture Choropleth Map Use this choropleth map template to display agricultural data across various regions.
Covid19 Vaccine Choropleth Map Template
Covid19 Vaccine Choropleth Map Present a geographical representation of COVID-19 vaccination rates or coverage with this choropleth map template.
Lung Cancer Cases Choropleth Map Template
Lung Cancer Cases Choropleth Map Use this choropleth map template to illustrate the geographical distribution of lung cancer cases.
Startup Population Choropleth Map Template
Startup Population Choropleth Map Use this choropleth map template to present data on startup population distribution.
Coronavirus Map Template
Coronavirus Map Use this map template to illustrate the spread of the Coronavirus (COVID-19) across different regions.
Highest Valued Export Map Template
Highest Valued Export Map Leverage this map template to illustrate the highest valued exports from different countries around the world.
World Forecast Map Template
World Forecast Map Utilize this map template to display weather forecasts for different regions around the globe.
Top Social Networks Map Template
Top Social Networks Map Use this map template to showcase the dominance of different social networks in various countries around the world.
World's Best Countries Map Template
World's Best Countries Map Use this map template to show the ranking of the best countries in the world.
Top 10 Countries Map Template
Top 10 Countries Map Use this map template to visualize ranking data for the top 10 countries.
Most Popular US Attraction Map Template
Most Popular US Attraction Map Use this map template to highlight the most popular attractions across the United States.
Smart Device Penetration in Europe Map Template
Smart Device Penetration in Europe Map Illustrate the proliferation of smart devices across Europe using this informative map template.
Paid For Daily Newspaper Map Template
Paid For Daily Newspaper Map Use this map template to visualize the distribution and popularity of paid newspapers in different regions.
Megabrew Latin Roots Map Template
Megabrew Latin Roots Map Use this map template to showcase the popularity and origins of different breweries in Latin countries.