1. Home
  2. Templates
  3. Web Graphics Templates
  4. Facebook Boost Optimization Blog Graphic Medium Template

Facebook Boost Optimization Blog Graphic Medium Template

Use This Template

Teach your audience to optimize smarter, not harder, with this bold template.


This template is a great visual resource for breaking down ad performance strategies in a clear, engaging way. Featuring a vibrant colour palette of warm browns, oranges, and muted peach tones, it instantly draws attention. The interactive animation style makes it even more engaging and easy to grasp. Use it for your blog graphics, social media explainers, client strategy decks, or internal marketing training materials. Customize any other part of this template using Visme’s easy-to-use editor.


  • Change colors, fonts and more to fit your branding
  • Access free, built-in design assets or upload your own
  • Visualize data with customizable charts and widgets
  • Add animation, interactivity, audio, video and links
  • Download in PDF, JPG, PNG and HTML5 format
  • Create page-turners with Visme’s flipbook effect
  • Share online with a link or embed on your website


Modify this template to fit your needs or take a look at Visme’s extensive range of stunning social media templates.

Edit this template with our web graphics creator!

Facebook Boost Optimization Blog Graphic Medium Template

Template Specifications

  • Dimensions

    8.5” X 11” (US Letter) - Can also be customized to any desired dimension.

  • Customizable

    Yes. This template can be fully customized. You can edit content, change image(s), apply custom colors, add or sub-tract pages.

  • Formats

    Can be shared as public or private link, embedded to a site or blog, download as JPG, PNG, PDF or HTML5.

Compatibility

More like this

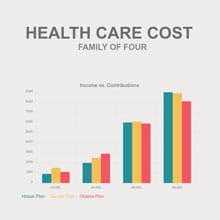
Health Care Cost Bar Graph Template
Health Care Cost Bar Graph Illustrate expenses and costs and compare between different datasets using this healthcare cost bar graph template.
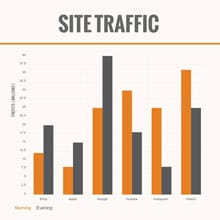
Site Traffic Infographic Template
Site Traffic Infographic Break down your site traffic in a way that's easy to comprehend using this infographic template.
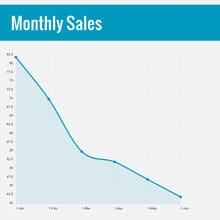
Monthly Sales Area Chart Template
Monthly Sales Area Chart Find and illustrate trends in your company’s financial data using this monthly sales area chart template.
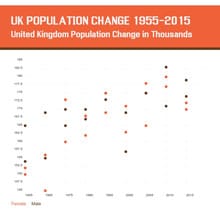
UK Population Change Scatter Plot Template
UK Population Change Scatter Plot Make your reports and proposals impactful with this UK population change scatter plot template.
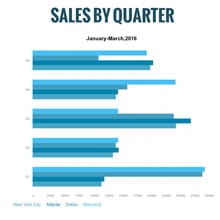
Sales by Quarter Bar Graph Template
Sales by Quarter Bar Graph Use this sales bar chart template to present data obtained from your company’s quarterly sales.
Business Information Pie Chart Template
Business Information Pie Chart Present data and proportions in a visually appealing way using this business information pie chart template.
Monthly Expenses Pie Chart Template
Monthly Expenses Pie Chart Visually illustrate expenses in a given time using this colorful monthly expenses pie chart template.
Top 10 Products By Revenue Bar Graph Template
Top 10 Products By Revenue Bar Graph Illustrate different proportions in data using colorful stacked bars with this revenue bar graph template.
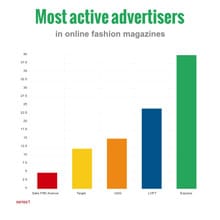
Most Active Advertisers Bar Graph Template
Most Active Advertisers Bar Graph Use this simple bar graph template to help visualize your analytics and other data in a digestible way.
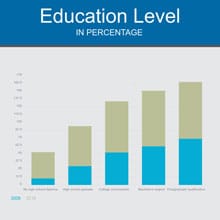
Educational Level Bar Graph Template
Educational Level Bar Graph Present comparison between different datasets using this educational level bar graph template.
Nonprofit Organizations Pie Chart Template
Nonprofit Organizations Pie Chart Present different quantities according to proportion by customizing this nonprofit pie chart template.
Revenues by Region Line Graph Template
Revenues by Region Line Graph Explain trends in data in a visually engaging way using this financial line graph template.
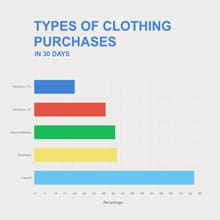
Clothing Purchases Bar Graph Template
Clothing Purchases Bar Graph Visualize your store’s purchase data and statistics using this 30 days purchase bar graph template.
Technology Use Pie Chart Template
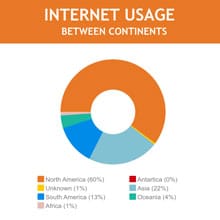
Technology Use Pie Chart Illustrate quantities and proportions in data visually using this customizable technology pie chart template.
Experience Level of Marketing Managers Pie Chart Template
Experience Level of Marketing Managers Pie Chart Edit this colorful pie chart template to visually present different proportions of data.
U.S Food Consumption Template
U.S Food Consumption Visualize U.S. food consumption at a glance with this sleek web graphic template.
Cost to Start a Small Business Template
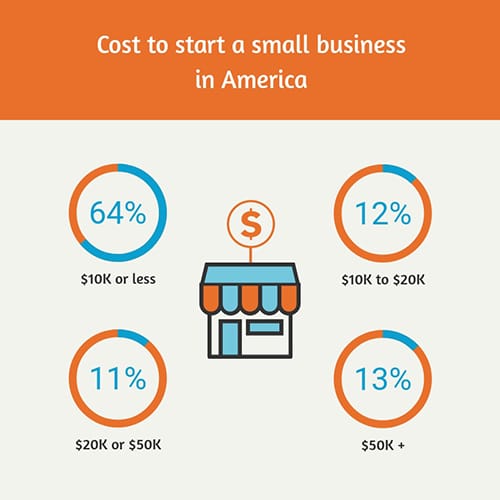
Cost to Start a Small Business Share survey results on the cost to start a small business with this sleek web graphic template.
Company Timeline Template
Company Timeline Explain your company history in style with the help of this visually engaging company timeline template.
Views on President Survey Template
Views on President Survey Share public sentiment and support towards presidential candidates with this survey template.