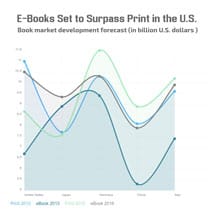
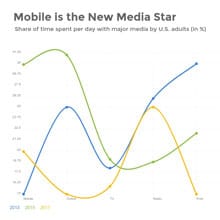
Mobile is the New Media Star Line Graph Template
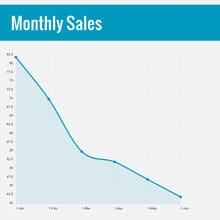
Use This TemplateUse this line graph template to present and compare trends in multiple datasets.
Combine this line graph with professional presentations, reports and proposals or use it solo. Manually insert your data replacing the placeholders or use the import data option to link Google sheets or for uploading Excel workbooks. You can change the colors of each line and follow a monochromatic theme or contrasting colors to ease differentiation between data.
You also have the option to select between a variety of other charts and graphs within the same editor to check how your data looks in other categories of charts to compare multiple data sets. Add important facts and figures in this template using a variety of interactive data widgets and adjust more information by combining vector icons, stock photos and videos.
Download the line chart in different formats including JPG, GIF and also as a video for offline use. You can also link this chart in your social media posts or embed it in emails or websites.
Start editing this line chart template by clicking the button below. Check out our collection of other professional templates to explore more types of chart templates.
Edit this template with our pie chart maker!
-
Dimensions
All chart templates come in two sizes: horizontal (1920 x 1080 pixels) and square (800 x 800 pixels)
-
Customizable
This chart template can be fully customized. You can edit content, change image(s), apply custom colors, add or subtract pages and more.
-
Formats
Can be shared as public or private link online, embedded to a site or blog, or downloaded as JPG, PNG, PDF or HTML5. If downloaded as an image, you can also insert into other documents and presentations.
Related Charts & Graphs
