1. Home
  2. Create Charts & Graphs
  3. Chart Templates
  4. England rates Line Graph Template Template

England rates Line Graph Template Template

Use This Template

Monitor England's economic or social dynamics with accuracy using this sophisticated line graph template.

This creative template is perfect for breaking down complicated economic rates, social trends, or any other statistical information pertaining to England's current state. Its intelligently designed layout, coupled with striking colors, makes understanding crucial data a breeze. With Visme's flexible editor, you can quickly make changes based on your brand guidelines and needs.

  • Change colors, fonts and more to fit your branding
  • Access free, built-in design assets or upload your own
  • Visualize data with customizable charts and widgets
  • Add animation, interactivity, audio, video and links
  • Download in PDF, JPG, PNG and HTML5 format
  • Create page-turners with Visme’s flipbook effect
  • Share online with a link or embed on your website

Start editing this template today, or find plenty more line graph templates in Visme's impressive selection to match your data visualization needs.


Edit this template with our pie chart maker!

England rates Line Graph Template Template
Template Specifications
  • Dimensions

    All chart templates come in two sizes: horizontal (1920 x 1080 pixels) and square (800 x 800 pixels)

  • Customizable

    This chart template can be fully customized. You can edit content, change image(s), apply custom colors, add or subtract pages and more.

  • Formats

    Can be shared as public or private link online, embedded to a site or blog, or downloaded as JPG, PNG, PDF or HTML5. If downloaded as an image, you can also insert into other documents and presentations.

Compatibility

Related Charts & Graphs
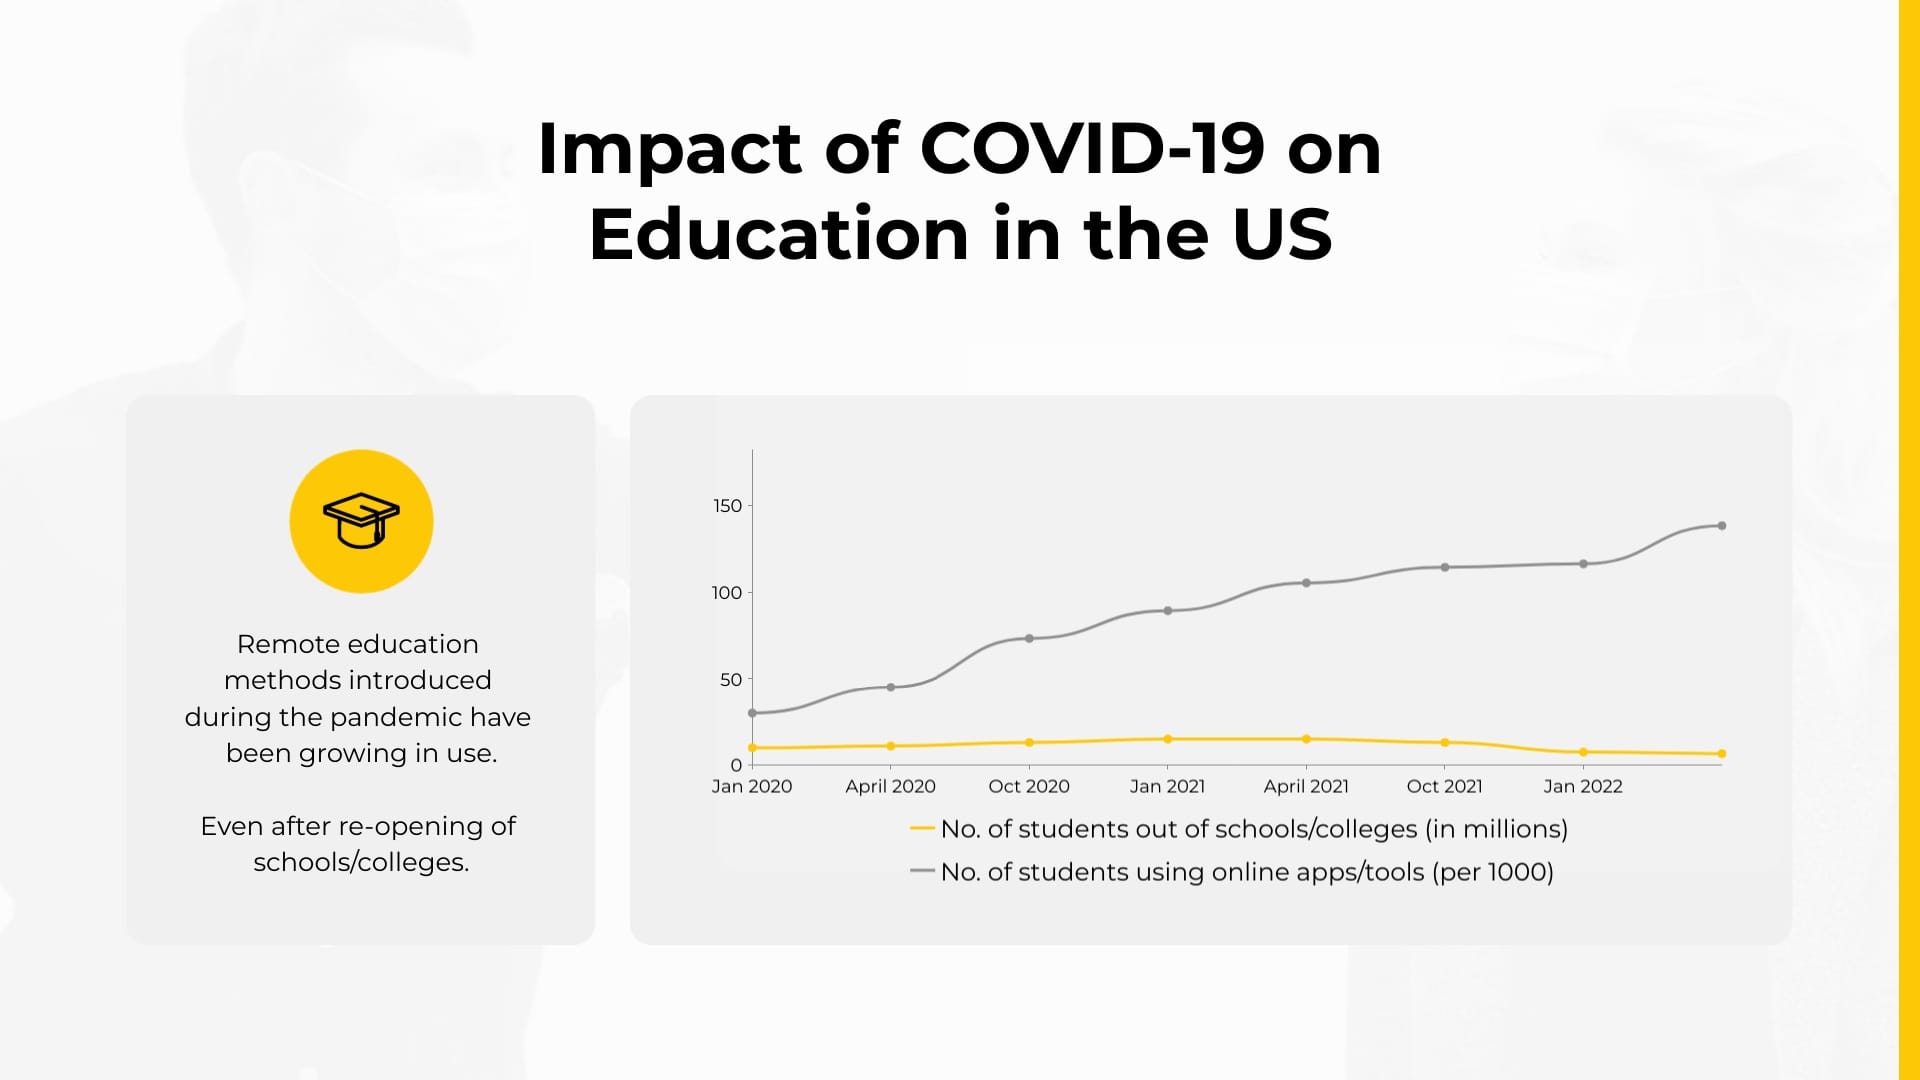
Beverage Consumed Line Graph Template
Beverage Consumed Line Graph Monitor beverage consumption trends with this engaging and straightforward line graph template.
Interest in Digital Marketing Line Graph Template
Interest in Digital Marketing Line Graph Track the rise and fall of interest in digital marketing over time with this captivating line graph template.
Monthly Climate Trend in Japan Line Graph Template
Monthly Climate Trend in Japan Line Graph Chart out the climate variations across Japan's various regions with this feature-rich line graph template.
Bowling Stats in a Cricket Match Line Graph Template
Bowling Stats in a Cricket Match Line Graph Analyze individual and team bowling patterns in a cricket match with this interactive line graph template.
Sulfur Dioxide Emissions Worldwide Line Graph Template
Sulfur Dioxide Emissions Worldwide Line Graph Survey global sulfur dioxide emissions levels over the years using this line graph template.
10 Years Sales Overview Line Graph Template
10 Years Sales Overview Line Graph Dissect your sales performance over a decade with ease using this detailed line graph template.
Soccer Line Graph Template
Soccer Line Graph Illustrate soccer stats creatively with this engaging and versatile line graph template.
Monthly Active Users Line Graph Template Template
Monthly Active Users Line Graph Template Visualize your monthly active users' data effortlessly with this effective line graph template.
Graduation Rate In Different Years Line Graph Template
Graduation Rate In Different Years Line Graph Understand the ebb and flow of graduation rates across different years with this crisp line graph template.
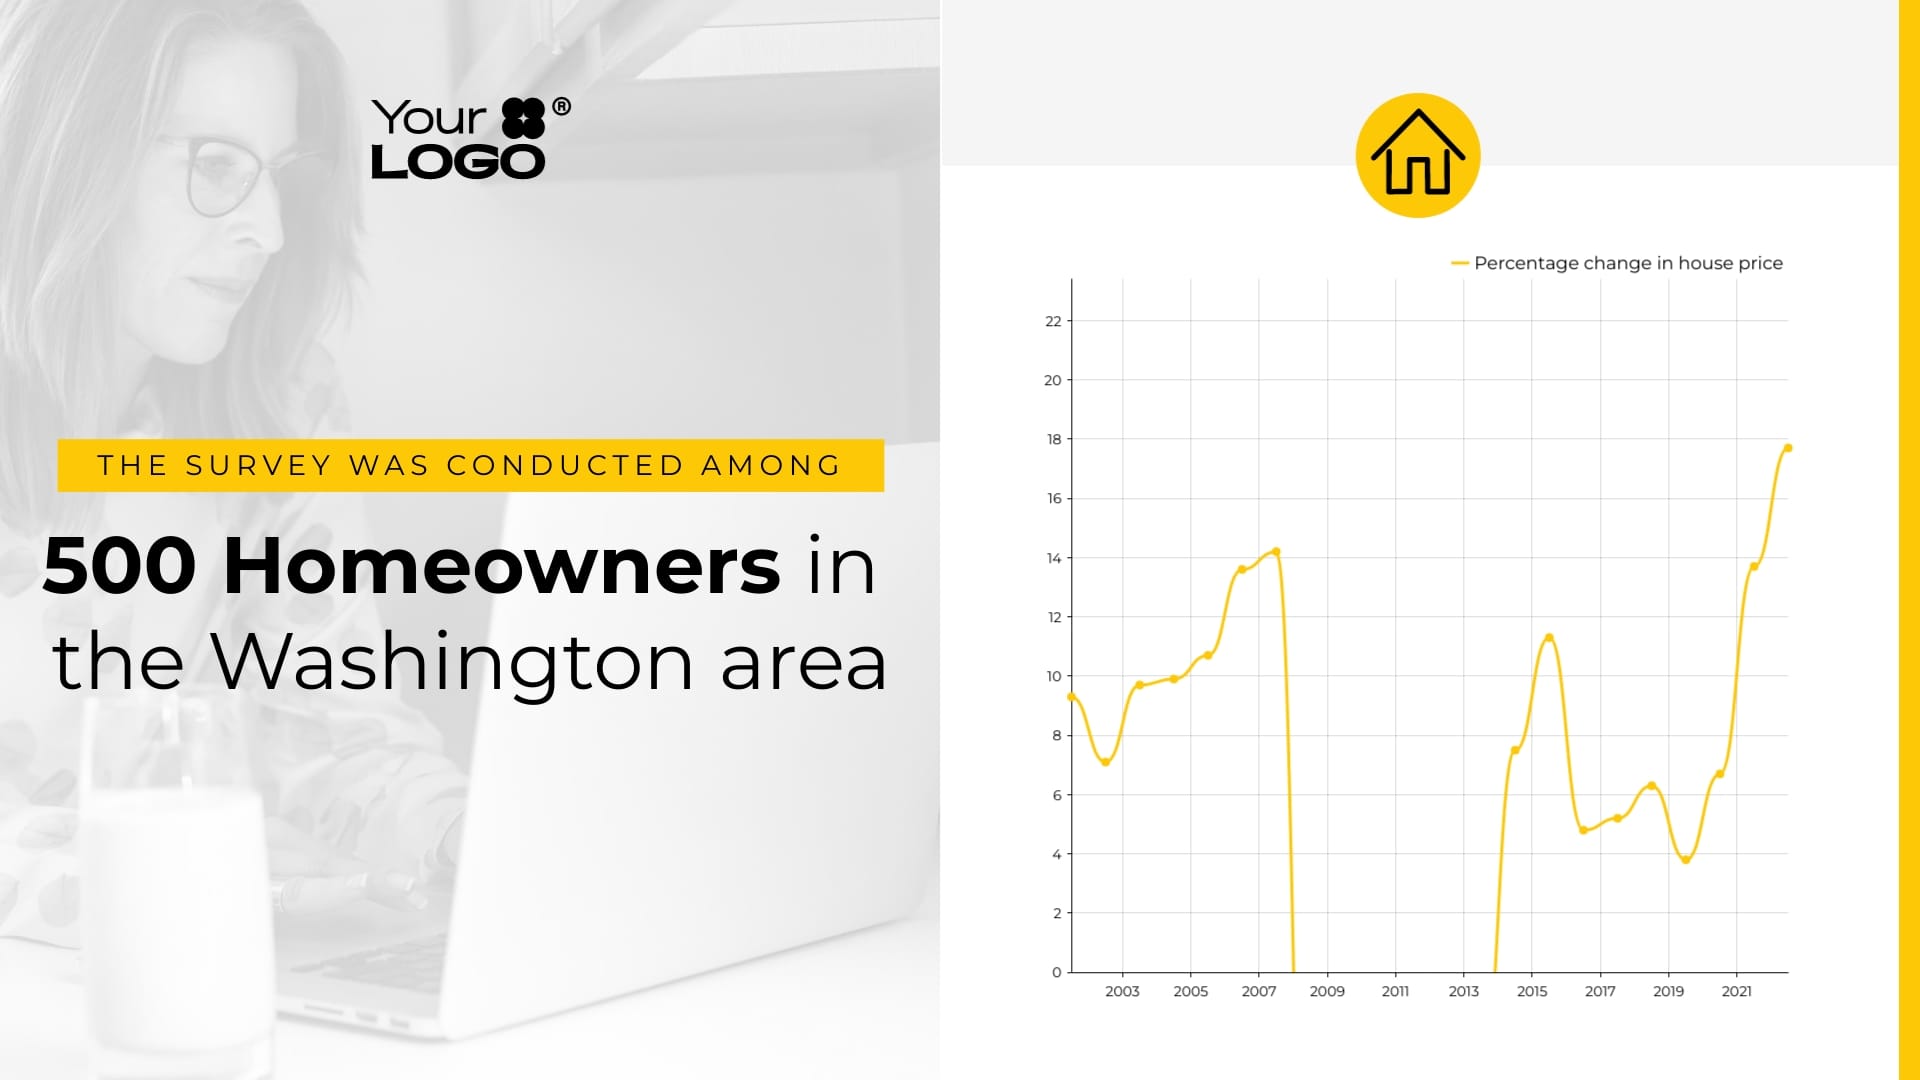
Housing Price Growth Change Line Chart Template
Housing Price Growth Change Line Chart Trace the trajectory of housing price growth over time with this insightful line graph template.
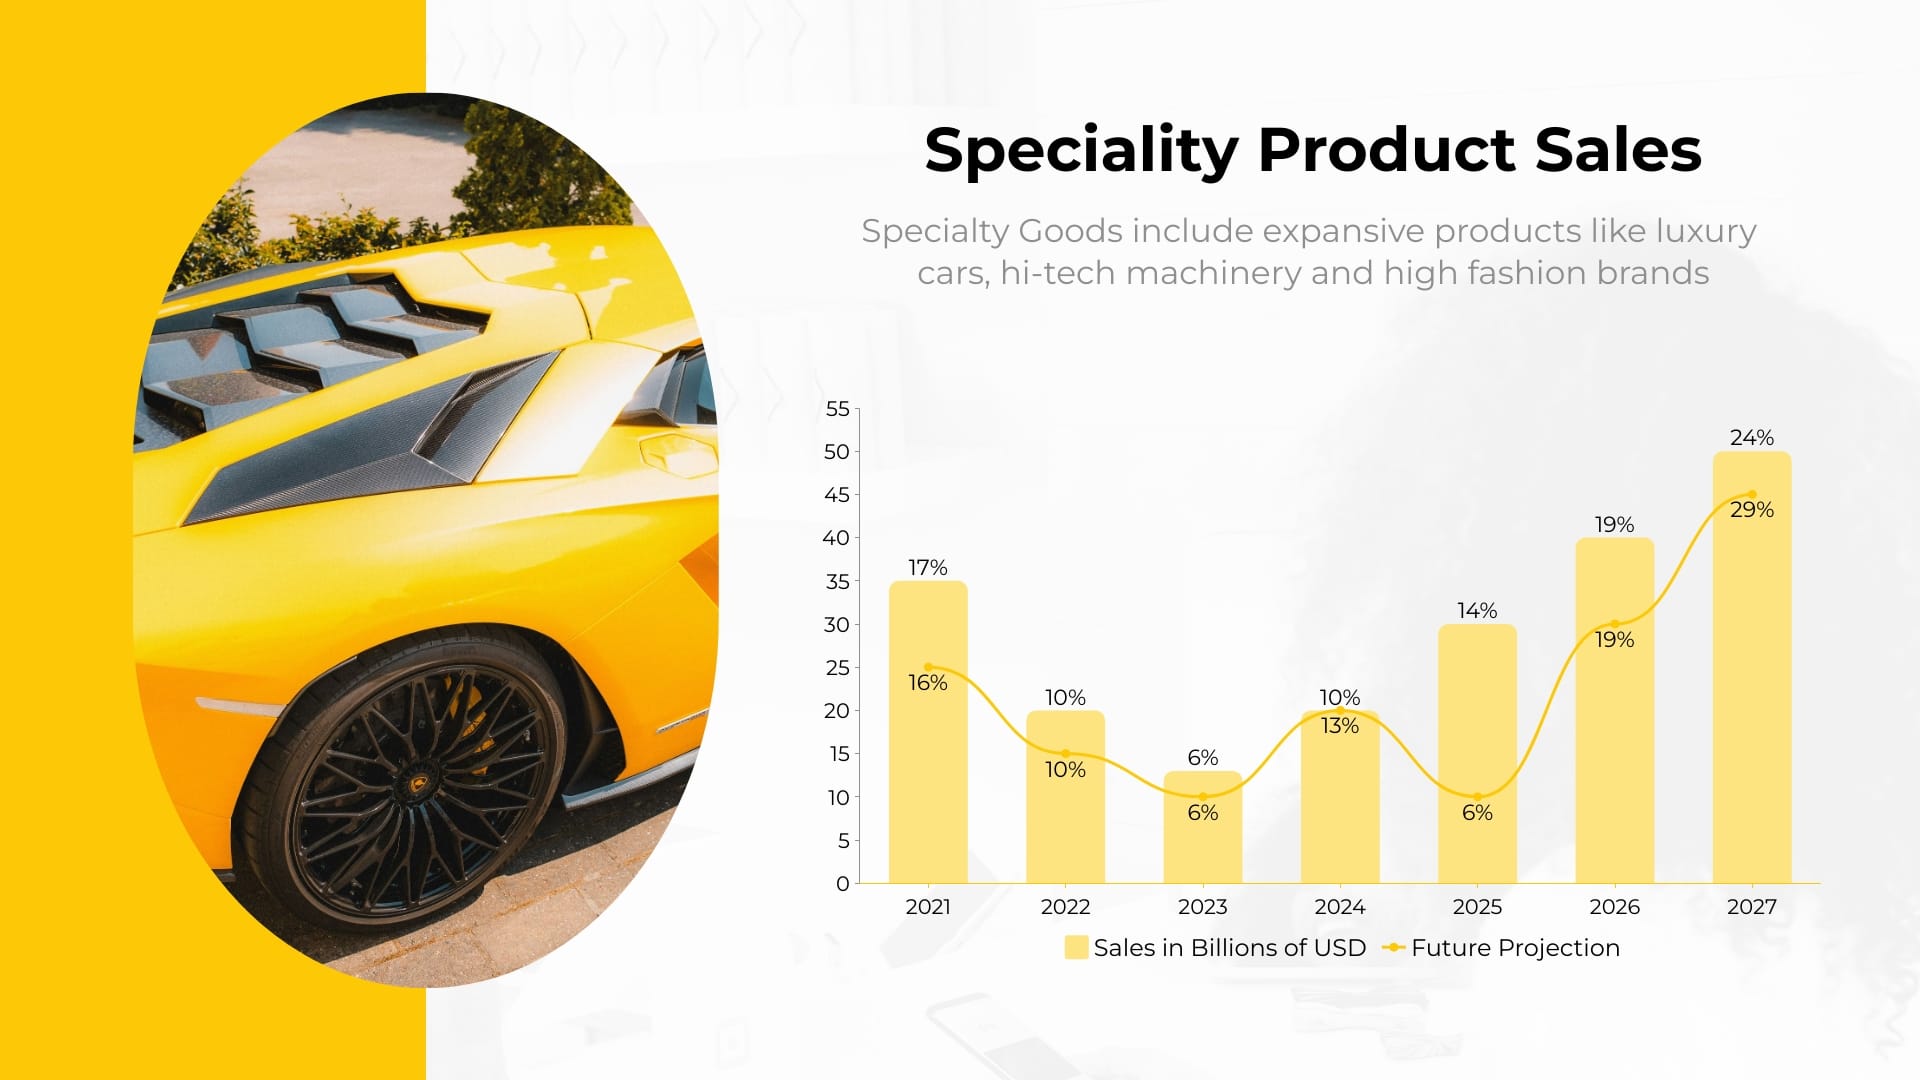
Speciality Product Sales Line Chart Template
Speciality Product Sales Line Chart Evaluate your specialty product's sales growth patterns through time using this beautifully crafted line graph template.
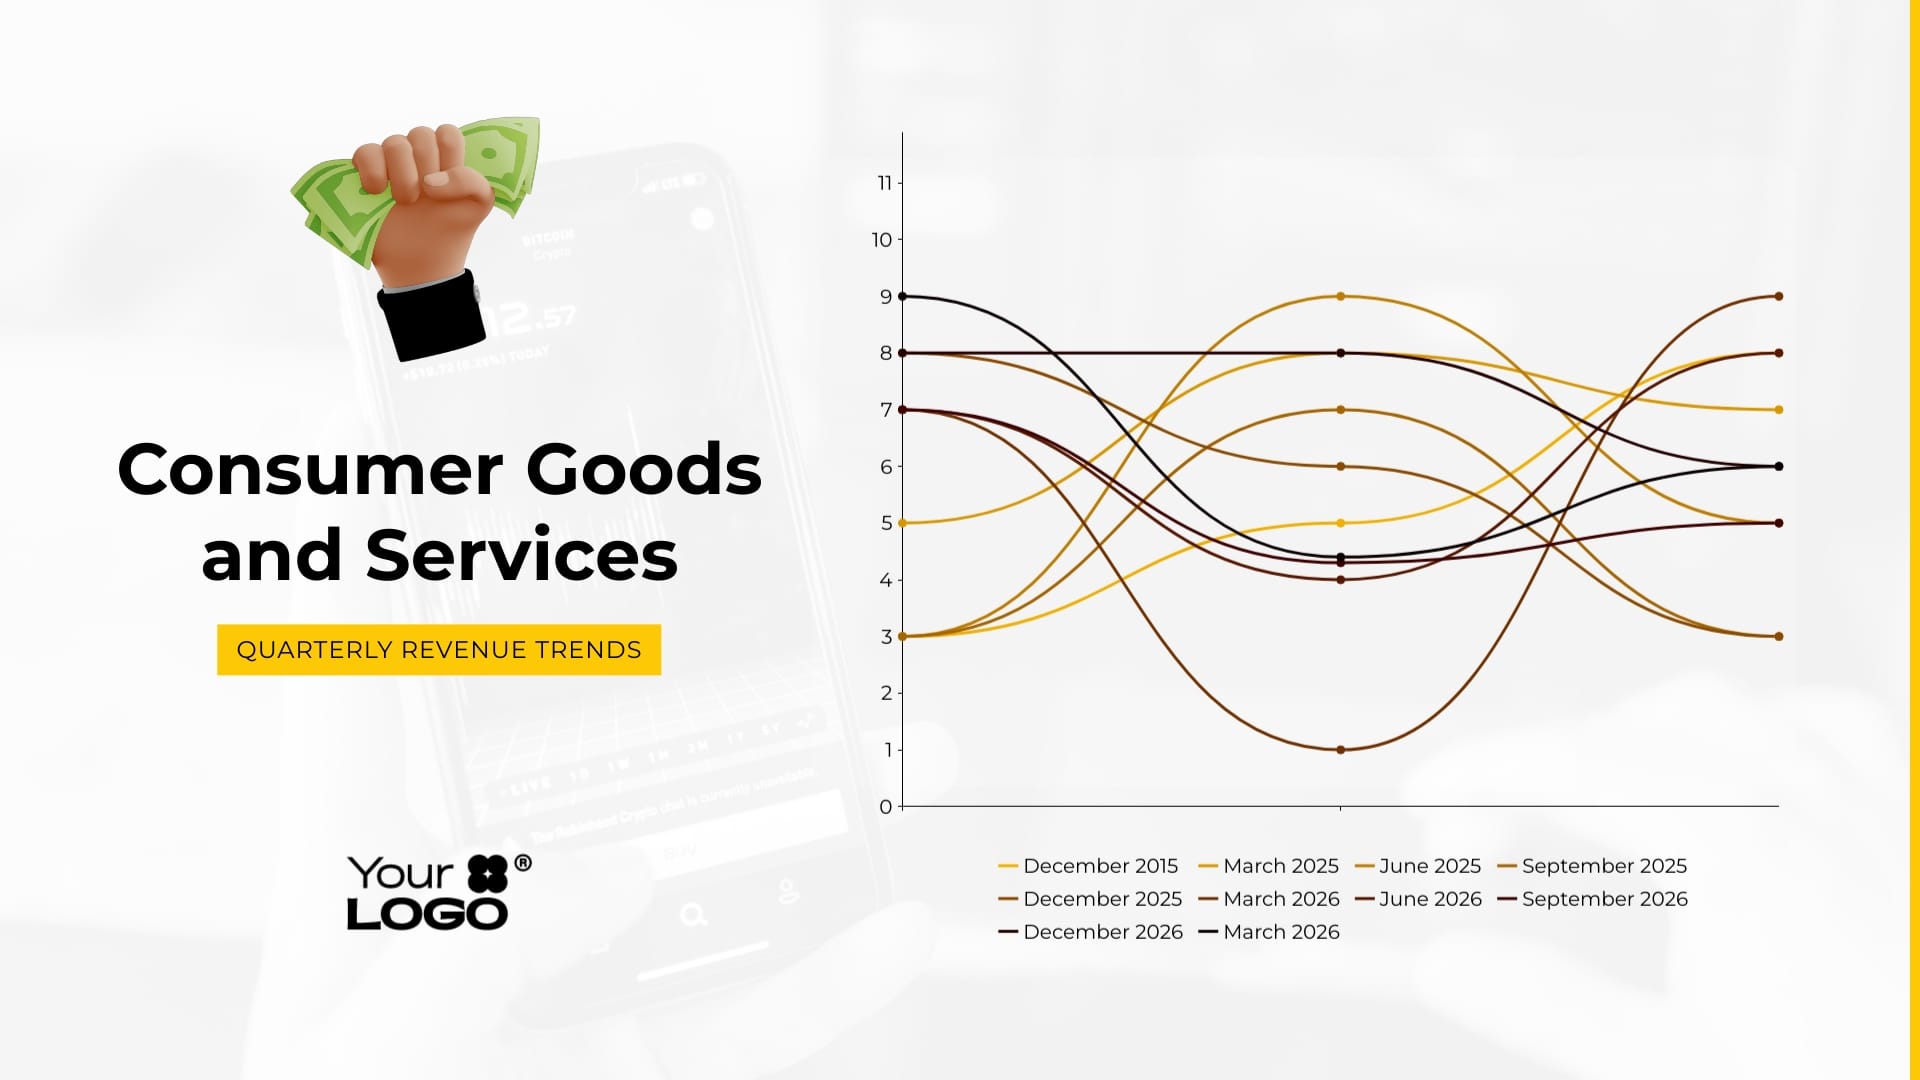
Quarterly Revenue Trends Line Graph Template
Quarterly Revenue Trends Line Graph Unlock insights on your quarterly profits with this trendy line graph template.