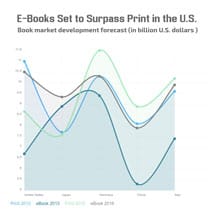
E-Books Set to Surpass Print Area Chart Template
Use This TemplateCustomize this colorful area chart template to compare and contrast between different data sets.
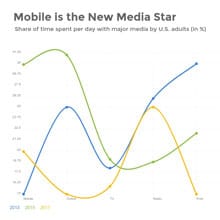
Illustrate trends between different data sets using a comparison area chart. Use different colors to highlight each line and make it distinct from others. Use icons or shapes to add a legend and bring your content together.
Add new blocks to combine this template with other interactive data visualization tools. You can also replace the existing font styles and colors from our vast library or add your brand’s own fonts, logo and color themes to personalize this line graph template. Add animations, interactive links or even stock photos to enhance your comparison chart.
Download the chart template in JPG, PNG, PDF, PPTX and HTML5 formats for offline use. Generate a link to share the chart online or embed it in your webpages.
Click the button below to get started. If you want to explore more design ideas, check out our collection of other professional templates.
Edit this template with our pie chart maker!
-
Dimensions
All chart templates come in two sizes: horizontal (1920 x 1080 pixels) and square (800 x 800 pixels)
-
Customizable
This chart template can be fully customized. You can edit content, change image(s), apply custom colors, add or subtract pages and more.
-
Formats
Can be shared as public or private link online, embedded to a site or blog, or downloaded as JPG, PNG, PDF or HTML5. If downloaded as an image, you can also insert into other documents and presentations.
Related Charts & Graphs


