Easily Map Connections with
Visme’s Relationship Chart Maker

It’s free to sign up and easy to use.
Start with relationship chart templates for different uses like business, storytelling or family trees.
Easily add shapes, link them and organize them with simple tools.
Customize the look with colors, labels, and icons to make your chart clearer.
Upgrade to download your chart in formats like PDF, PNG or JPG, or share it online with a link or embed it on your website.
The leading visual communication platform empowering 34,300,000 users and top brands.
Easy to edit
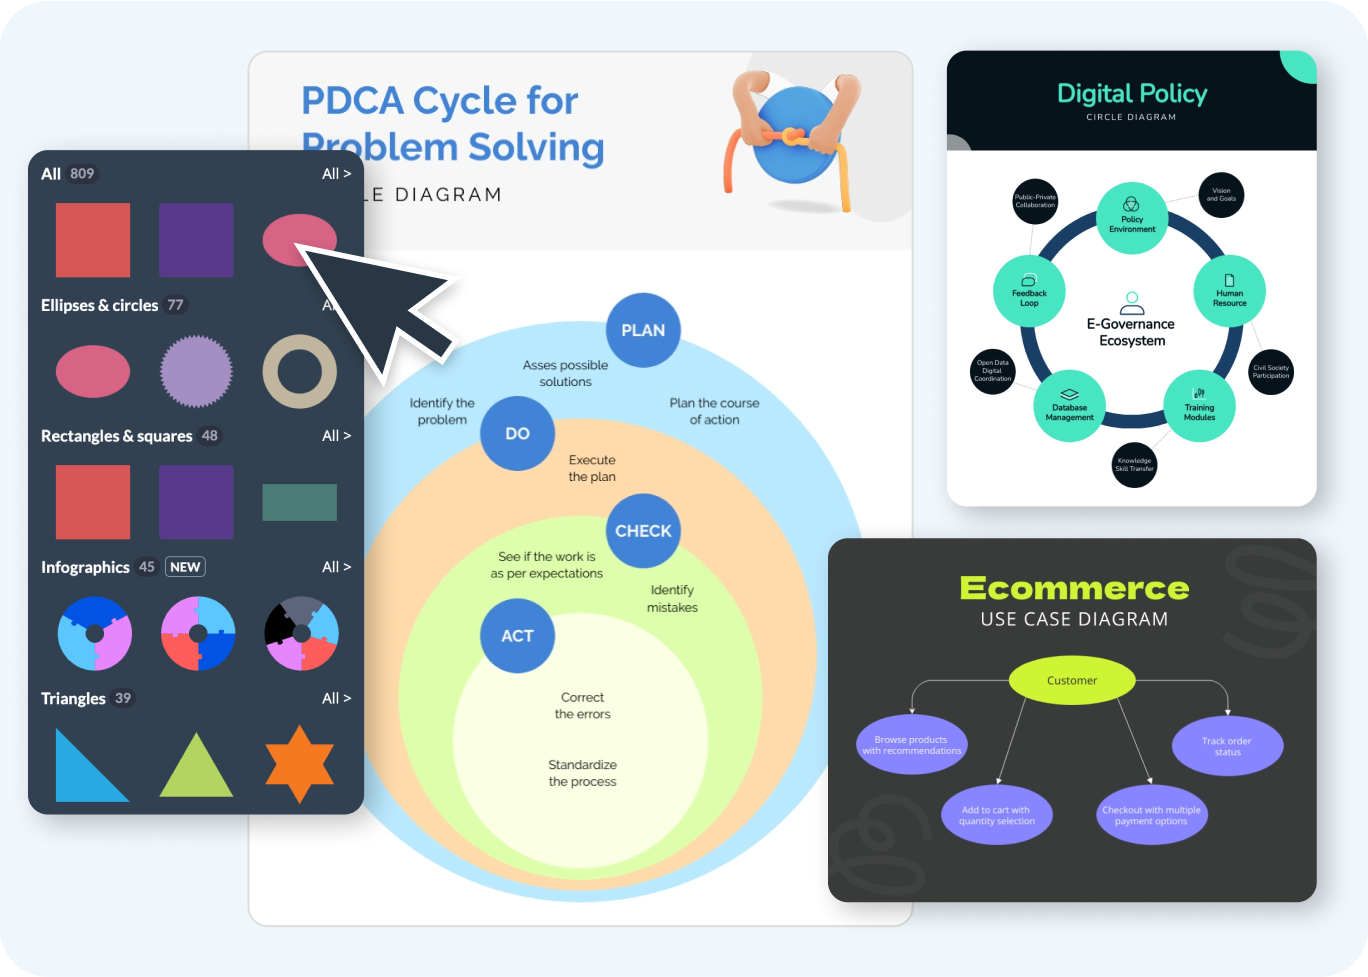
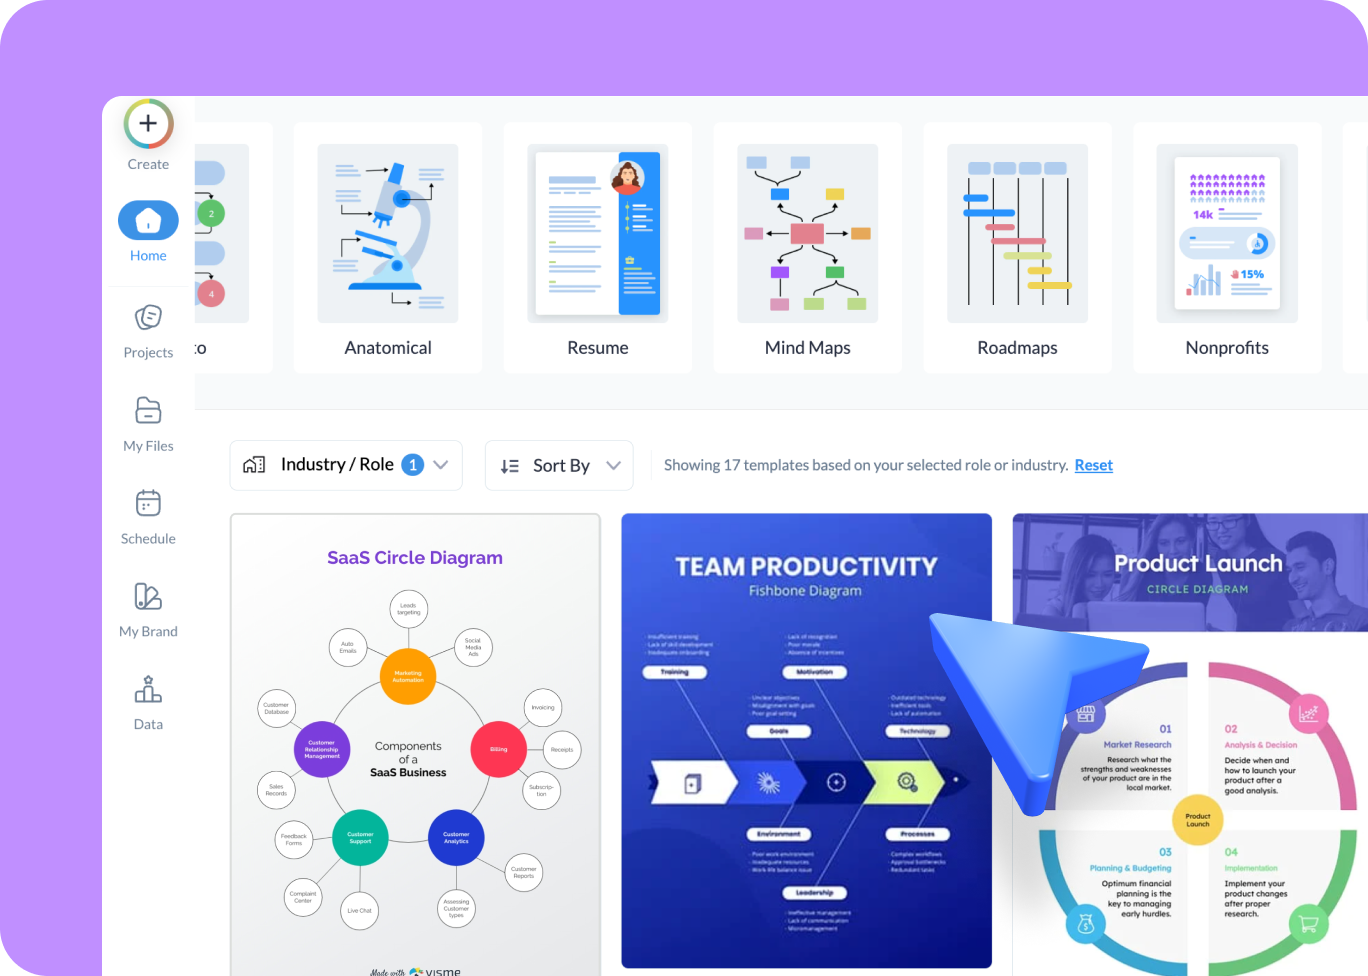
Relationship Chart Templates
Start your relationship mapping journey with Visme's vast library of relationship chart templates. Whether you're outlining business partnerships, team structures or personal connections, you can find the perfect template to begin. Customize every part of your chart, including relationships, shapes, lines and colors. This will help you represent the connections and dynamics of your project accurately.


Relationship Chart Maker Features
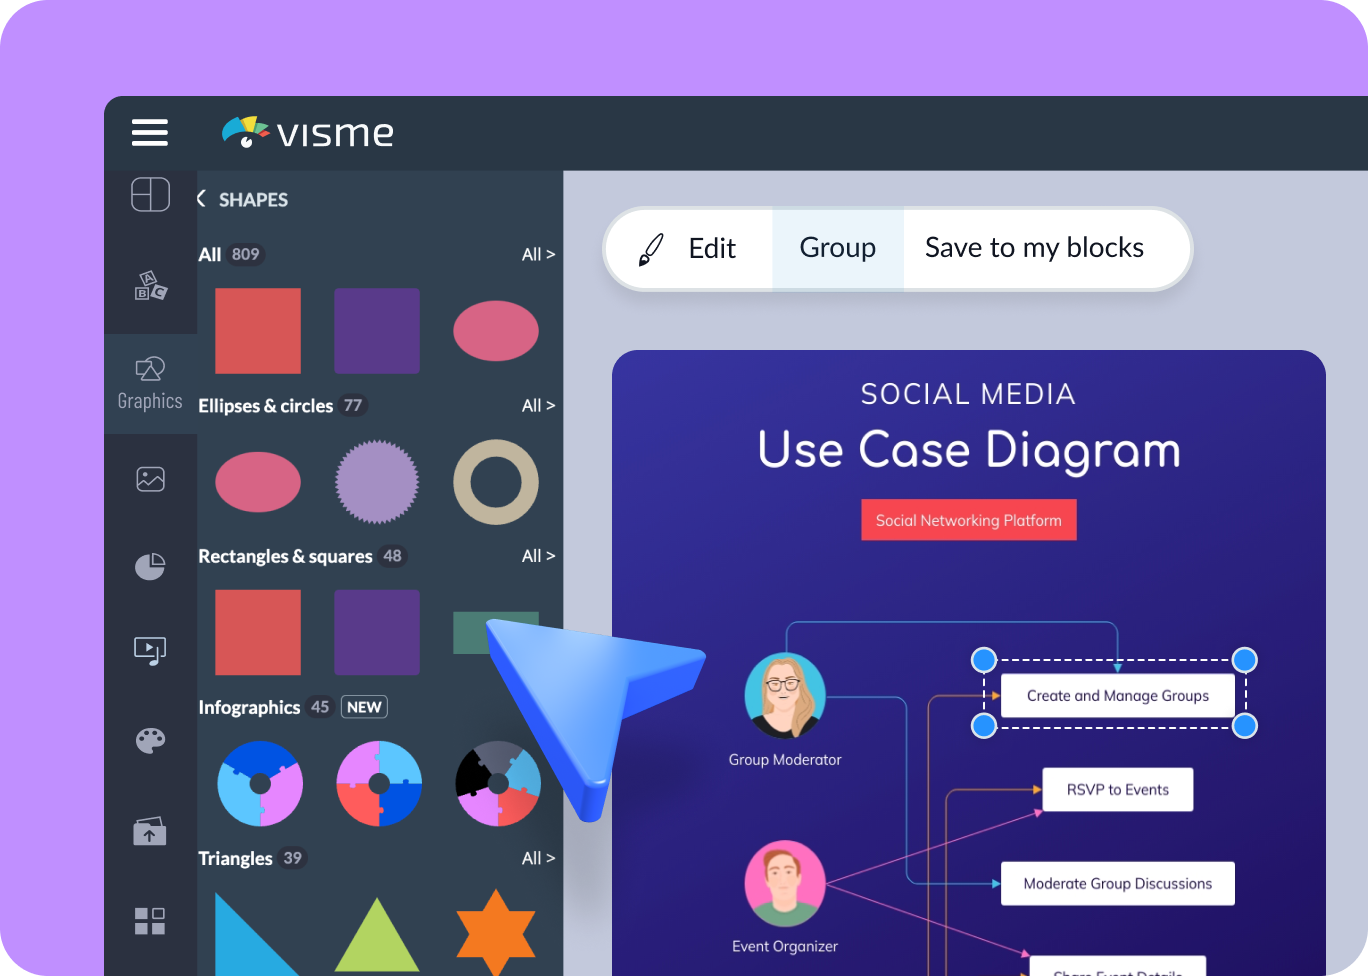
Easy Customization with a Drag-and-Drop Editor
Visme’s relationship chart maker makes it easy to design charts that fit your needs. With the drag-and-drop editor, you can easily add shapes, connect elements and rearrange them however you like. You don’t need any design experience to make your chart look professional and tailored to your style or project.
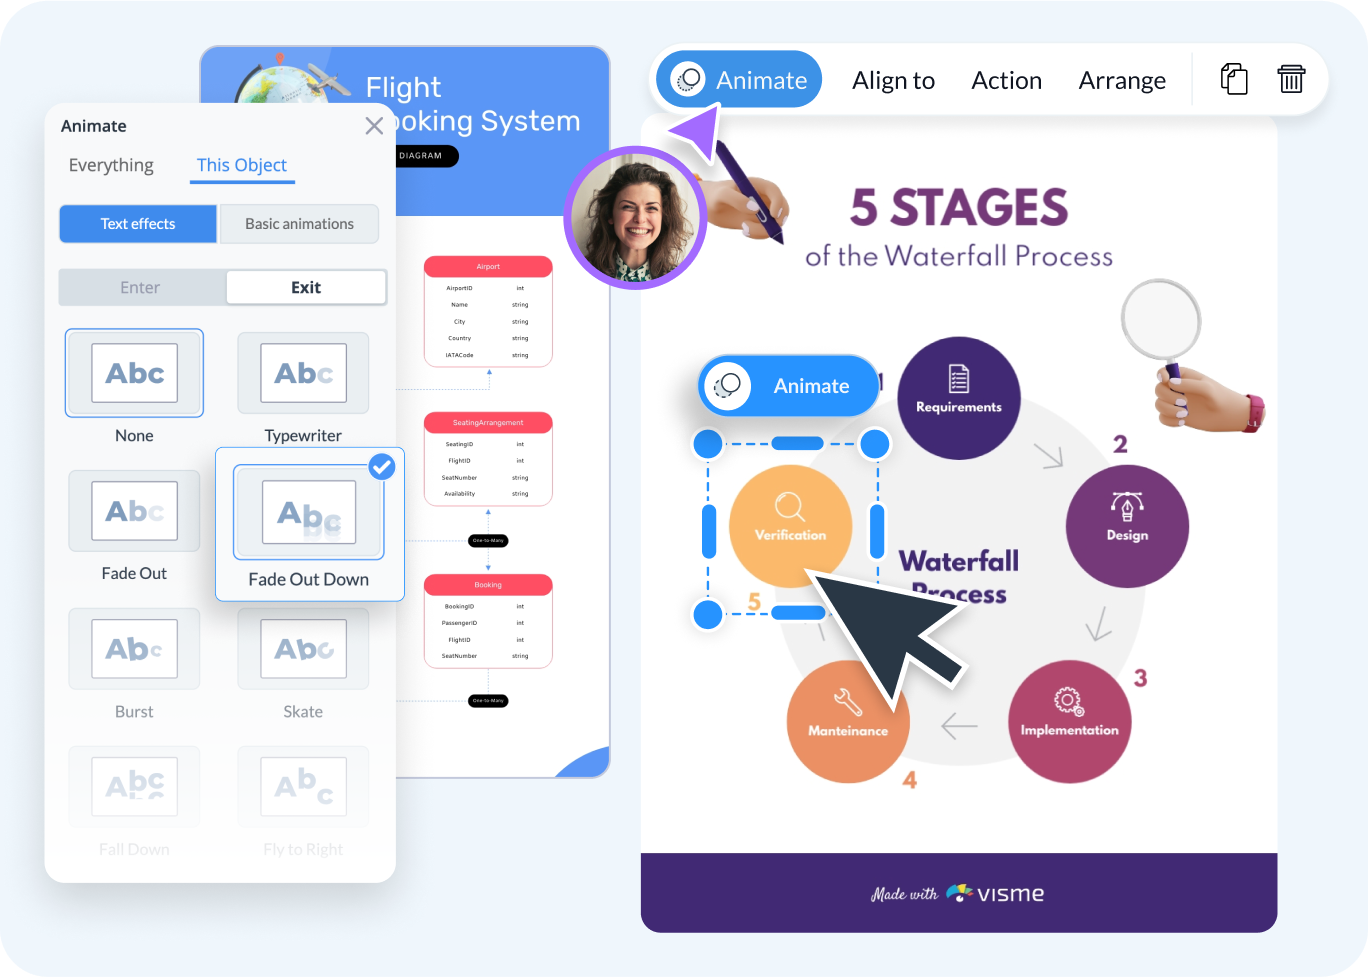
Add Interactivity and Animation
Add interactive elements and animations with Visme to make your relationship charts more engaging. You can add clickable parts, transitions and effects that bring your charts to life. This makes it easier to highlight important relationships and keep your audience engaged, whether you’re presenting or sharing your chart online.
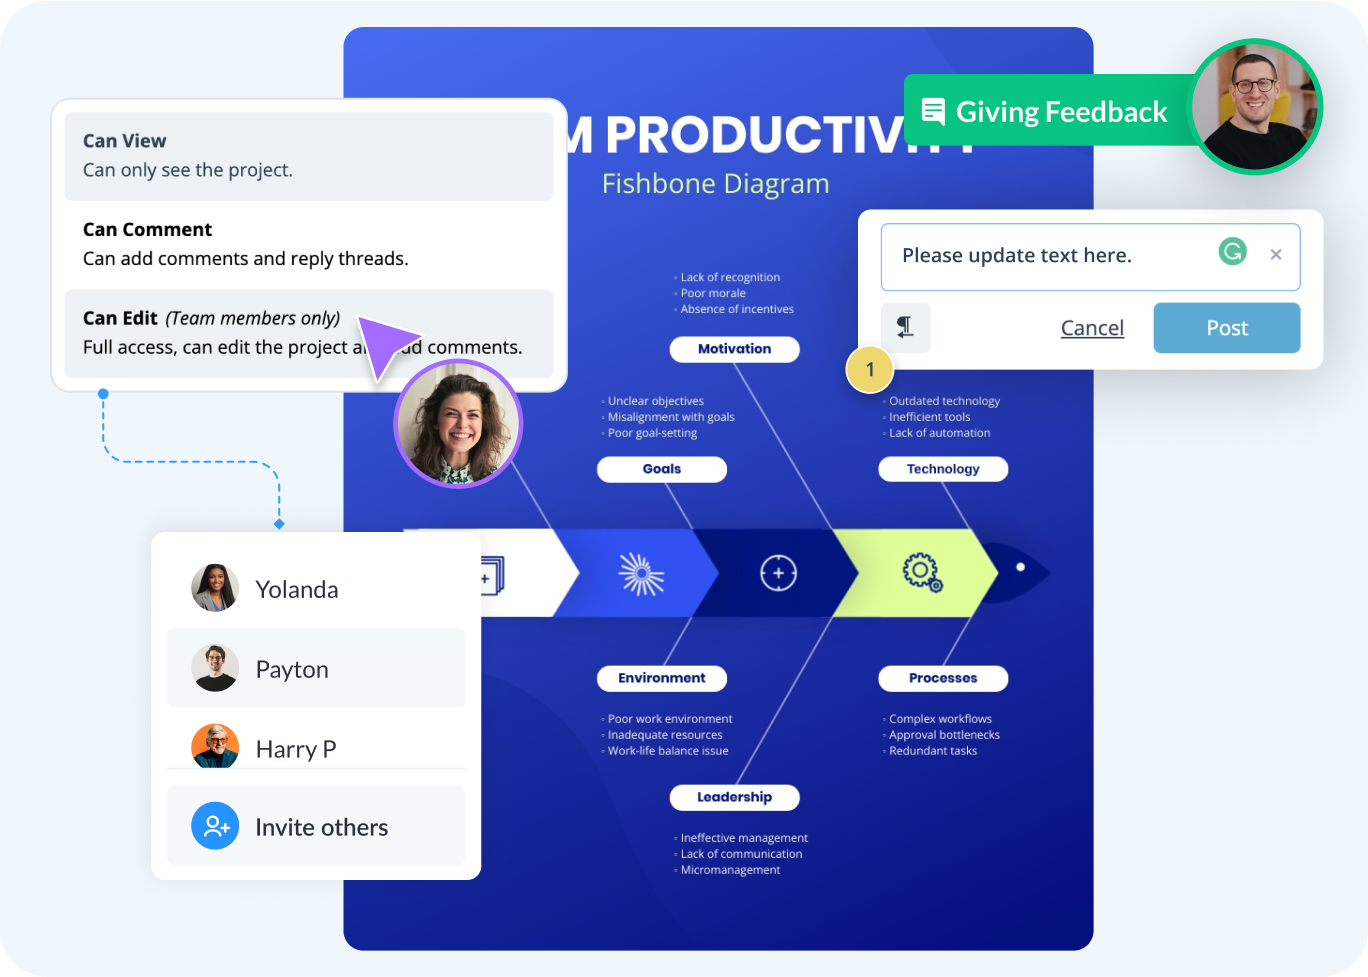
Real-Time Collaboration and Workflow Management
Work together on your relationship charts with Visme’s real-time collaboration feature. Invite teammates to edit, comment or view your chart at the same time. This feature improves teamwork and ensures everyone stays on the same page. Also, using the workflow management features, you can assign roles, track progress, manage deadlines and much more.
More Great Features
of the Relationship Chart Maker
Customizable Shapes
Choose from a variety of customizable shapes for different types of relationships, including business connections, social networks, or family trees.
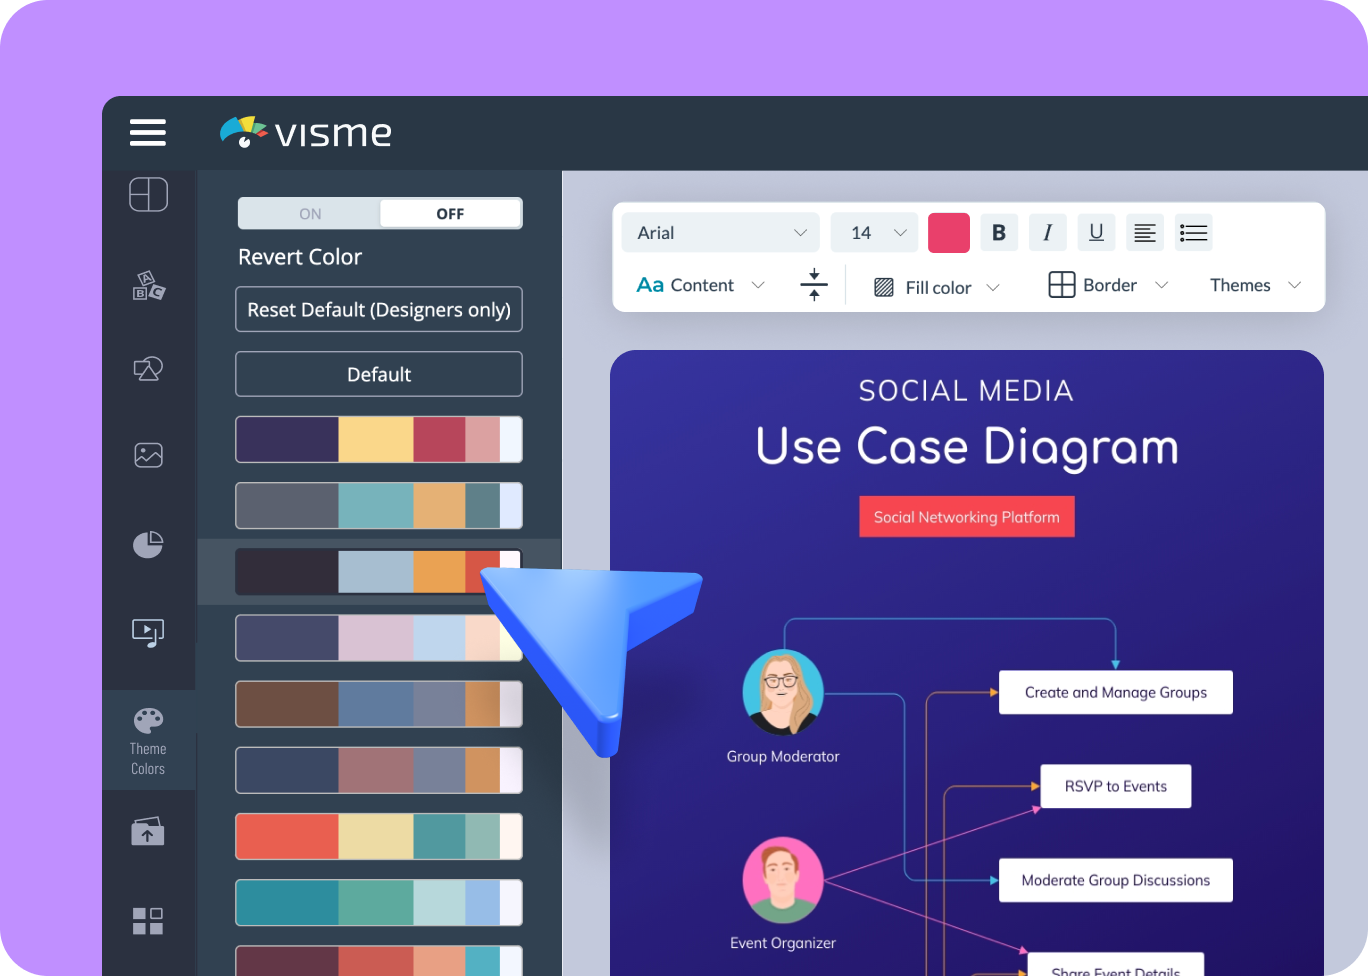
Pre-defined Color Schemes
Select from various color palettes to give your relationship charts a polished and professional look.
Smart Connector Lines
Use smart lines to connect elements in your chart that automatically adjust for a neat, organized appearance every time.
Variety of Design Elements
Enhance your charts with a wide range of vector icons, 3D graphics and illustrations.
Collaborate in Real-Time
Invite team members to comment, annotate and live edit your relationship chart instantly.
Interactive Features
Make your chart interactive by adding clickable elements, animations and hotspots to engage viewers and give them an interactive experience.
Online Whiteboard Tool
Brainstorm ideas for your relationship chart using our whiteboard tool. Add shapes, notes, arrows and even emojis to visualize your ideas.
Advanced Analytics Tool
Gain insights into your relationship chart’s performance with metrics such as views, engagement time and more.
Revision History
Easily access and revert to previous versions of your relationship chart to ensure you never lose your work.
Smart Alignment Guide
Align your chart’s elements effortlessly using smart guides.
Presentation Mode
Turn your relationship chart into an engaging presentation to share with stakeholders or colleagues.
Workflow Management Tools
Set deadlines, assign roles, and track progress directly within your diagram and streamline your design project management.

Learn More
What is a Relationship Chart?
A relationship chart is a visual tool that maps connections between people, teams, or ideas. It helps users analyze relationships, track hierarchies, and understand complex organizational, business and project structures.
These charts are widely used in HR, business strategy, education and research to improve team communication and clarify relationships. With a relationship chart maker, you can visualize data, identify key connections, and make more informed decisions.

Use Visme's Relationship Chart Maker to Visualize Connections
Easily create clear and professional relationship charts with Visme's simple relationship chart maker. Whether you're mapping family trees, organizational structures, or network relationships, Visme gives you the tools to customize every detail. Drag and drop elements, change colors, add labels and adjust layouts to make your chart visually engaging and easy to understand.
Everything you need + more
More Than Just a Relationship Chart Maker

Make it engaging
Interactivity
Create interactive reports with popup and rollover effects that allow your viewer to interact with your design to learn more information.
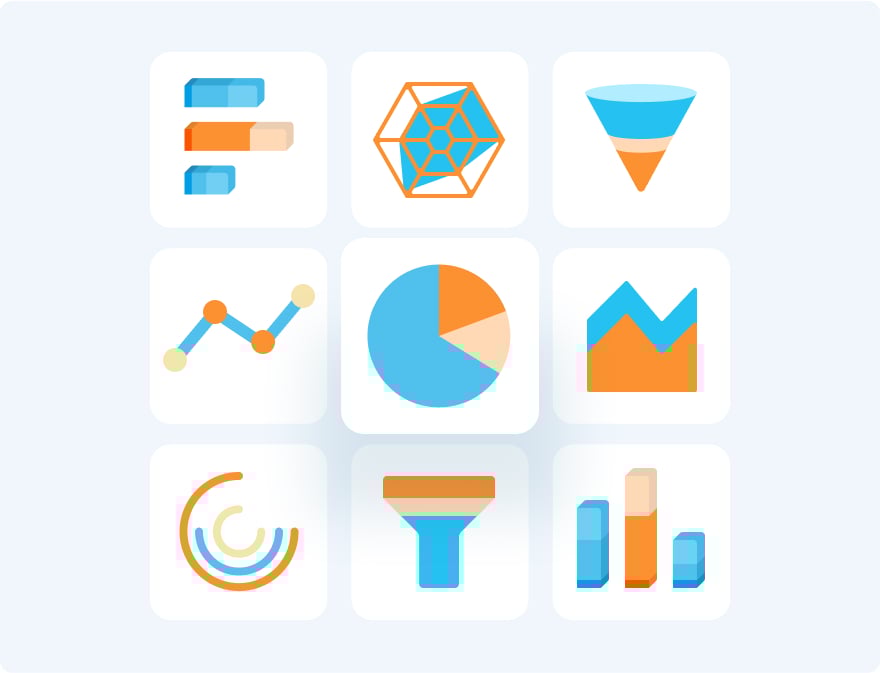
Visualize your data
Charts & Graphs
Showcase sales, marketing, website data and more in your reports with Visme’s easy-to-use charts, graphs and other data visualization tools.

Beautify your content
Video & Animation
Choose from over a million stock photos, icons, illustrations, characters, lines, shapes and more to create a completely unique report.
How it works
How to Create a Relationship Chart in 5 Easy Steps
Creating relationship charts with Visme is quick and simple. With Visme's easy-to-use interface, you can build professional relationship charts to visualize connections, hierarchies, and interactions. Whether you're mapping family trees, organizational structures, or business relationships, Visme's relationship chart maker gives you all the tools you need to design, customize, and share your charts effortlessly.
Follow these easy steps to create your relationship chart with Visme:


- Sign in to your Visme account and click “Create New” to start a new project from your dashboard.
- Type “Relationship Chart” in the search bar and choose a template that fits your requirements.
- Select a relationship chart template and add elements such as names, roles and connection lines to visualize relationships clearly.
- Customize your chart by changing colors, fonts and layouts to match your brand or project style.
- When you’re done, upgrade your plan to download your chart in PDF, PNG or JPG, share it with a link, or embed it on your website for easy access.
Quick tips
Create Clear Relationship Charts with Ease
Use clear labels and hierarchy to show connections and relationships effectively.
Choose the right chart type, whether it’s a family tree, organizational chart, or social network map, to best represent your data.
Keep it simple and uncluttered by limiting the number of elements and focusing on key relationships.
Use color coding and shapes to categorize different relationships and make your chart visually appealing.
Add images or icons to personalize and enhance understanding.
Break complex relationships into sections to improve readability and navigation.
Collaborate with your team by gathering input and refining your chart together.
Export and share easily in formats like PNG, JPG, or PDF, or embed online for easy access.
Frequently Asked Questions (FAQs)
A character chart maker helps organize key details about characters, such as names, traits, roles, and backgrounds. It’s commonly used by writers, educators and researchers to track character development.
A character map maker visually represents the connections between characters in a story, showing relationships like friendships, rivalries, and family ties. This is useful for novelists, scriptwriters and game developers.
A relationship chart maker maps out connections between people, organizations, or concepts in various contexts, including business, social networks, and historical research. Unlike character-specific tools, it’s broader and applies to multiple industries.
A relationship map template is a pre-designed layout that helps visualize connections between people, organizations, or concepts. With Visme, you can customize templates to create clear and engaging relationship charts.
Simply choose a relationship mapping template in Visme, add your data, and customize the elements. You can modify labels, colors, and connections to fit your needs.
Visme’s relationship map maker offers an intuitive drag-and-drop interface, customizable templates, and real-time collaboration, making it one of the best tools for creating professional relationship charts.
Use Visme’s relationship graph maker to map out connections. Start with a template, add entities and links, customize the design and download or share your chart online.
A connection chart is a visual representation of relationships between individuals, groups, or ideas. Visme makes it easy to design and customize these charts for various use cases.
Yes! Visme offers a free relationship chart maker with essential tools to create and customize relationship maps. Upgrade for advanced features and export options.
A relationship map creator is a tool that helps users visually organize and analyze relationships. Visme’s creator lets you design professional charts with ease.