Free Pie Chart Maker for Professional Pie Charts

- Create interactive pie charts online without using any code.
- Import Excel files, sync live data, and add detailed labels to every slice.
- Share or download your chart in multiple high-resolution formats.

Chosen by brands large and small
Our pie chart maker is used by over 34,300,000 marketers, communicators, executives and educators from over 133 countries that include:
EASY TO EDIT
Pie Chart Templates
Start designing your pie chart with a premade template for a faster workflow. Choose from hundreds of templates and customize it by editing text, colors, and fonts to match your style. Input your data and download your chart instantly
Features of the Pie Chart Maker
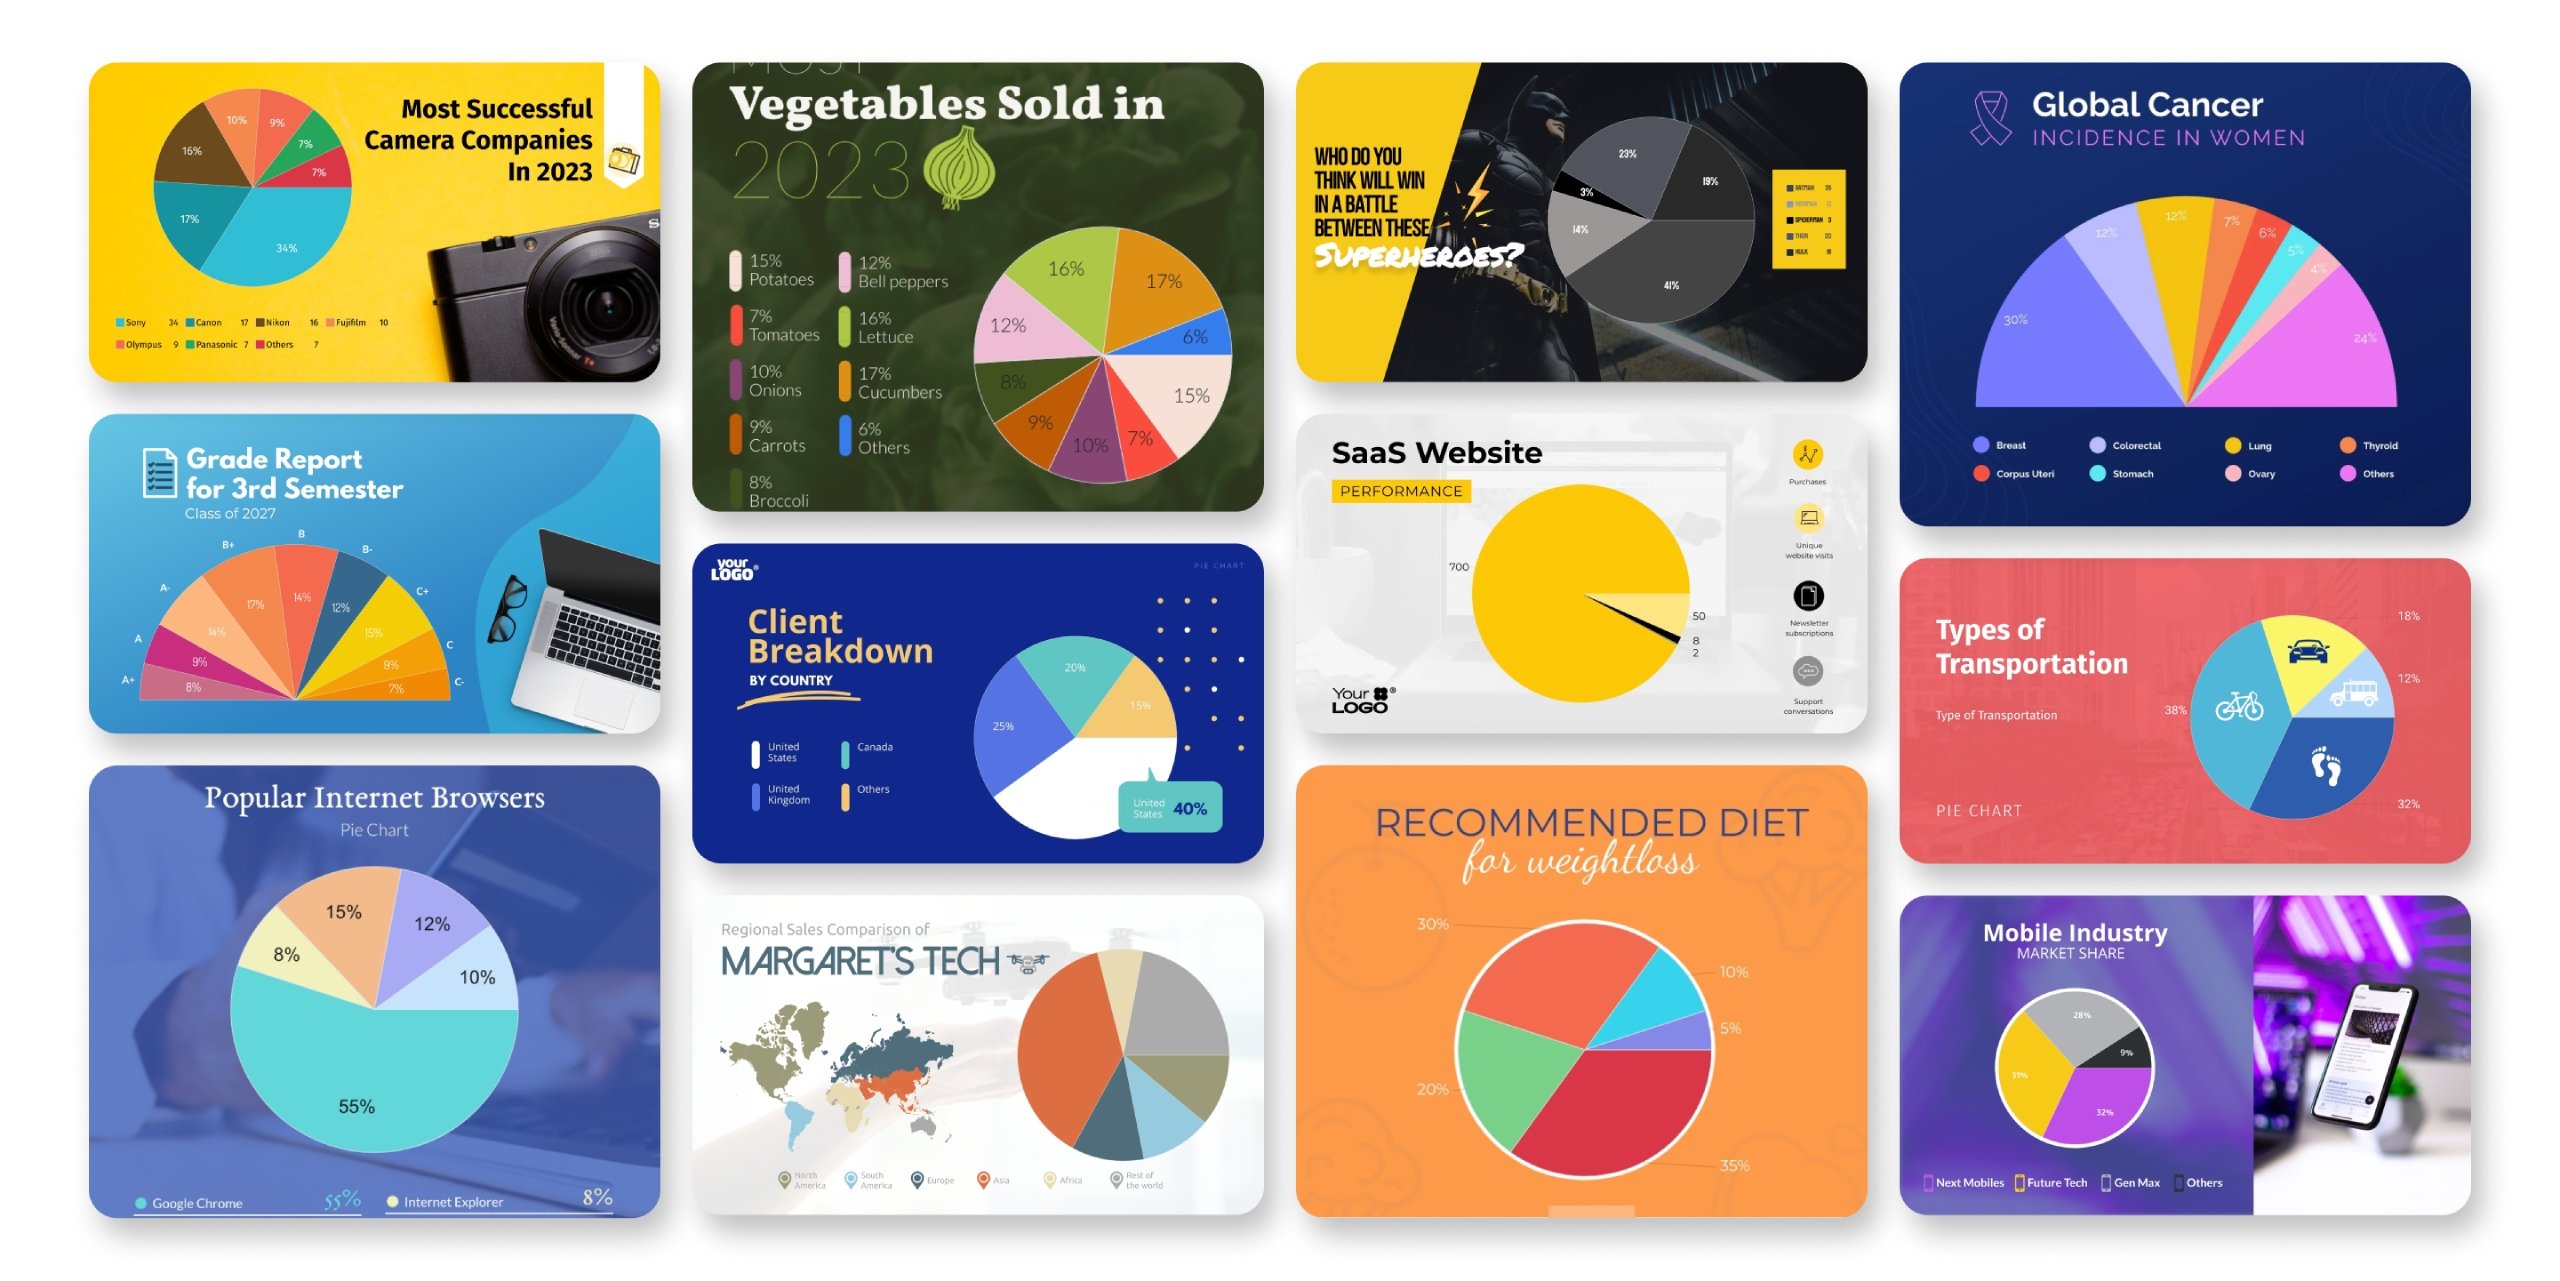
Beautiful pie chart templates
Visme offers dozens of premade pie chart templates to choose from to jumpstart your design. Find a template that is similar to your data set or preferred color scheme, click to edit, then input your data to watch your pie chart come to life.

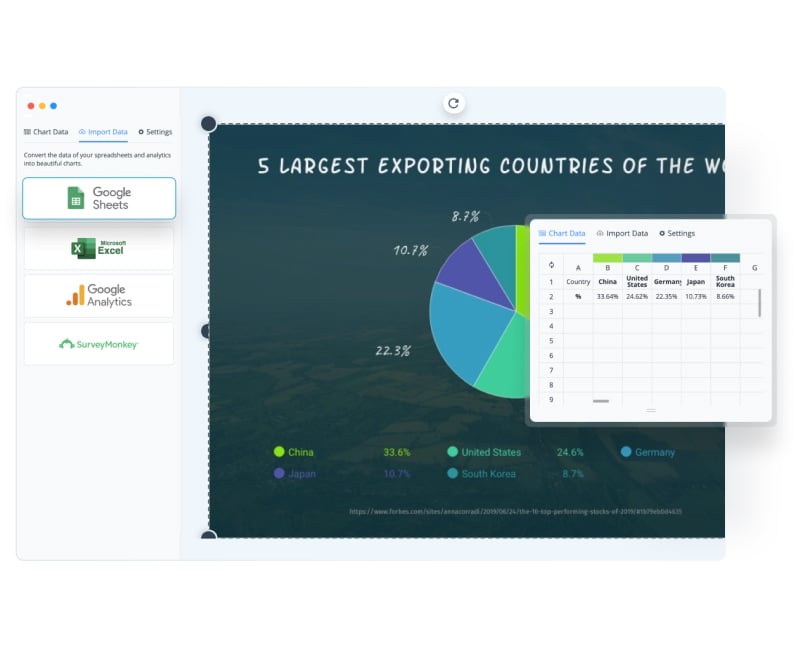
Build your pie chart
Create online pie charts quickly and easily by inputting data manually into the Visme Graph Engine or importing an existing Excel or Google spreadsheet. Watch the Graph Engine transform your pie chart according to your data, and easily build your legend and labels within the settings.
Customize every aspect of your pie chart to visualize your data
The pie chart builder has plenty of settings to customize how the values are shown – as decimals or percentages. Choose from hundreds of fonts inside the Settings tab. The Visme pie chart maker will not only let you customize a pie chart with your data, fonts, colors, labels and backgrounds, it also offers various animation effects for added visual impact.

Give your designs extra dimension with 3D pie charts
Transform standard pie visuals into eye-catching 3D pie charts, no design or tech experience required. Customize slice colours, labels, fonts and animations, then present your data in a sleek, modern style that stands out.

More Great Features of the Pie Chart Maker
-
Fully customizable premade circle graph templates to choose from
-
Millions of stock photos and icons to spice up your design
-
Add in your own branded fonts and colors to make it your own
-
Easy drag-and-drop design tools, made with the non-designer in mind
-
Create a flat or 3D pie chart, or a full or donut pie chart
-
Download as an image file or add to an existing project
Share Your Pie Chart
Share your custom pie chart as a standalone project or insert your design into any piece of content, like a presentation, infographic or report. You can easily download as an image file to share on social media or embed a live and interactive circle graph onto your website or blog.

LEARN ABOUT PIE CHARTS
What is a Pie Chart?
A pie chart is a type of data visualization that showcases different pieces of a whole. These are best used to represent percentages as these add up to a full one hundred percent. Pie charts are divided up into differently sized pieces that are used to represent the amounts of each percentage.
It's easy to create your own pie chart in Visme by pasting your own data, importing an Excel spreadsheet or connecting a live Google Sheet for a dynamic dashboard.

Use the pie chart maker to build a perfect visual according to your data.
Choose from our selection of circle graphs, from full circles to ring shapes, flat or isometric. Use the pie chart generator to enter the values of your data. You can input it manually or import it from a Google spreadsheet or Excel sheet.
EVERYTHING YOU NEED + MORE
More Than a Pie Chart Creator
Visme’s creative pie chart maker helps you to create online pie charts that are both easy to understand and beautifully designed. Take advantage of Visme’s pie chart features to create data visualizations your audience will love.
VISUALIZE YOUR DATA
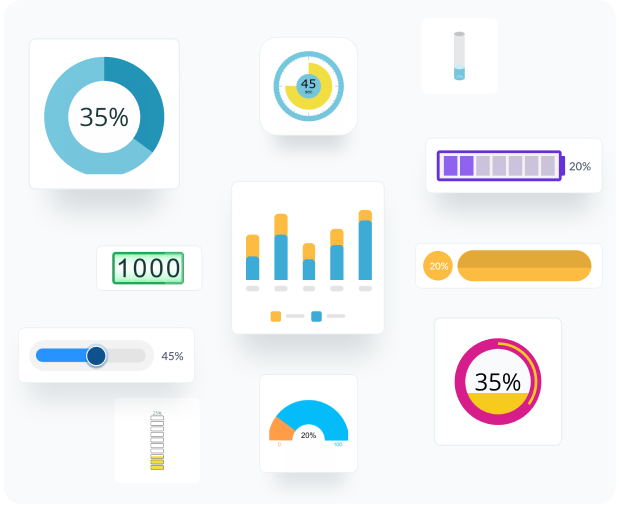
Charts & Graphs
Choose from different chart types and create pie charts, bar charts, donut charts, doughnut charts, pyramid charts, Mekko charts, radar charts and much more.
MAKE IT ENGAGING
Interactivity
All of Visme's charts give you the option to add hover-over legends that give your audience more information and make your charts engaging.

BEAUTIFY YOUR CONTENT
Images & Graphics
Choose from over a million stock photos, icons, illustrations, characters, lines, shapes and more to decorate your pie chart and make it engaging.
HOW IT WORKS
How to Make Pie Charts in 5 Steps
Create a customized pie chart quickly and easily with Visme’s free pie chart maker. Find a template you love and insert the parts of a whole that you plan to visualize.
In this quick video tutorial, we walk you through how you can easily create a beautiful pie chart by starting with a template, inputting your data and customizing your design.
- Log in to Visme and open a new project in the dashboard. Choose a template, add your pie chart to an existing project or start with a blank canvas.
- To use the pie chart maker, click on the data icon in the menu on the left. Enter the Graph Engine by clicking the icon of two charts.
- Choose the pie chart option and add your data to the pie chart creator, either by hand or by importing an Excel or Google sheet.
- Customize colors, fonts, backgrounds and more inside the Settings tab of the Graph Engine.
- Easily share your stunning pie chart design by downloading, embedding or adding to another project.
QUICK TIPS
How to Use the Circle Graph Maker
Create a vision for your pie chart. What is your primary message? Who is the audience for your marketing campaign/presentation?
Find the pie chart template that most closely matches the idea that you have in your head. You can also choose to start your design from scratch.
Have all your data values ready for input. You can have them in an Excel sheet for easy import or sync live data to your pie chart with a Google spreadsheet.
Find high-resolution stock images that correspond with your visual preferences. We have millions to choose from within the circle graph maker. You may also upload your original images.
Customize the colors of the pie chart to fit your brand style guide or the color style of the design you’re working on. Inputting a color hex number is easily done in our pie chart generator.
Choose the same fonts as the rest of your design so your pie chart fits perfectly when you insert it.
Use the settings in the circle graph creator to set up the data in a way that will fit well with the composition of your design. Adjust the angle of the chart for better visibility.
If you are creating an interactive infographic, or a presentation, use the animation setting and add extra emphasis to the data. There are numerous animated options to choose from.
Questions About the Pie Chart Maker
Where can I create a pie chart?
You can easily create a pie chart online with a data visualization tool like Visme. Create a free account, choose a template and insert your data.
I want to create a pie chart for commercial purposes. Does Visme give me images to use in my charts?
Absolutely! The millions of free images in our library are available for commercial use without attribution.
Can I share my chart online or print it?
Visme gives you the opportunity to download your file in PDF or PNG format completely ready for a professional print job. You can also easily share your creation on social media with a unique URL generated by the pie chart maker.
I have absolutely no design skills. How does Visme help me?
Visme was made for people just like you! Our entire platform is made to be intuitive and straightforward. We have cultivated an easy-to-use, drag-and-drop platform that brings the best professional tools to you.
Can I upload my own data from a spreadsheet?
You sure can! You can either link a Google Sheet or an Excel spreadsheet with your own data to the pie chart maker. All changes made in the original Google Sheet (published to the Web) will be reflected in your pie chart.
What is the best pie chart maker?
While there are several tools available to help you create pie charts, we think Visme is the best pie chart maker available. This is due to our extensive template library, ability to create animated and interactive charts, and millions of design assets for decorating your chart.
When should you use a pie chart?
Use a pie chart when you want to highlight proportions or compare a few categories within a single dataset. It’s ideal for showing simple percentage breakdowns at a glance.
What is a pie chart best used for?
A pie chart is best used to visualize percentage distribution. It helps your audience instantly understand which categories are largest or smallest within a complete set.
How do you move segments around in a pie chart?
In Visme, you can rearrange pie chart segments by adjusting the data inside the chart editor. Simply open the Data tab, drag and drop the rows into the order you want, and the pie chart will automatically update the segment positions. You can also edit labels, colors, and values from the same panel for complete control.