Create Cluster Diagrams for
Clear and Structured Ideas
It's free to sign up and easy to use.
Use Visme's cluster diagram maker to map out your ideas, improve brainstorming sessions and make your concepts clearer.
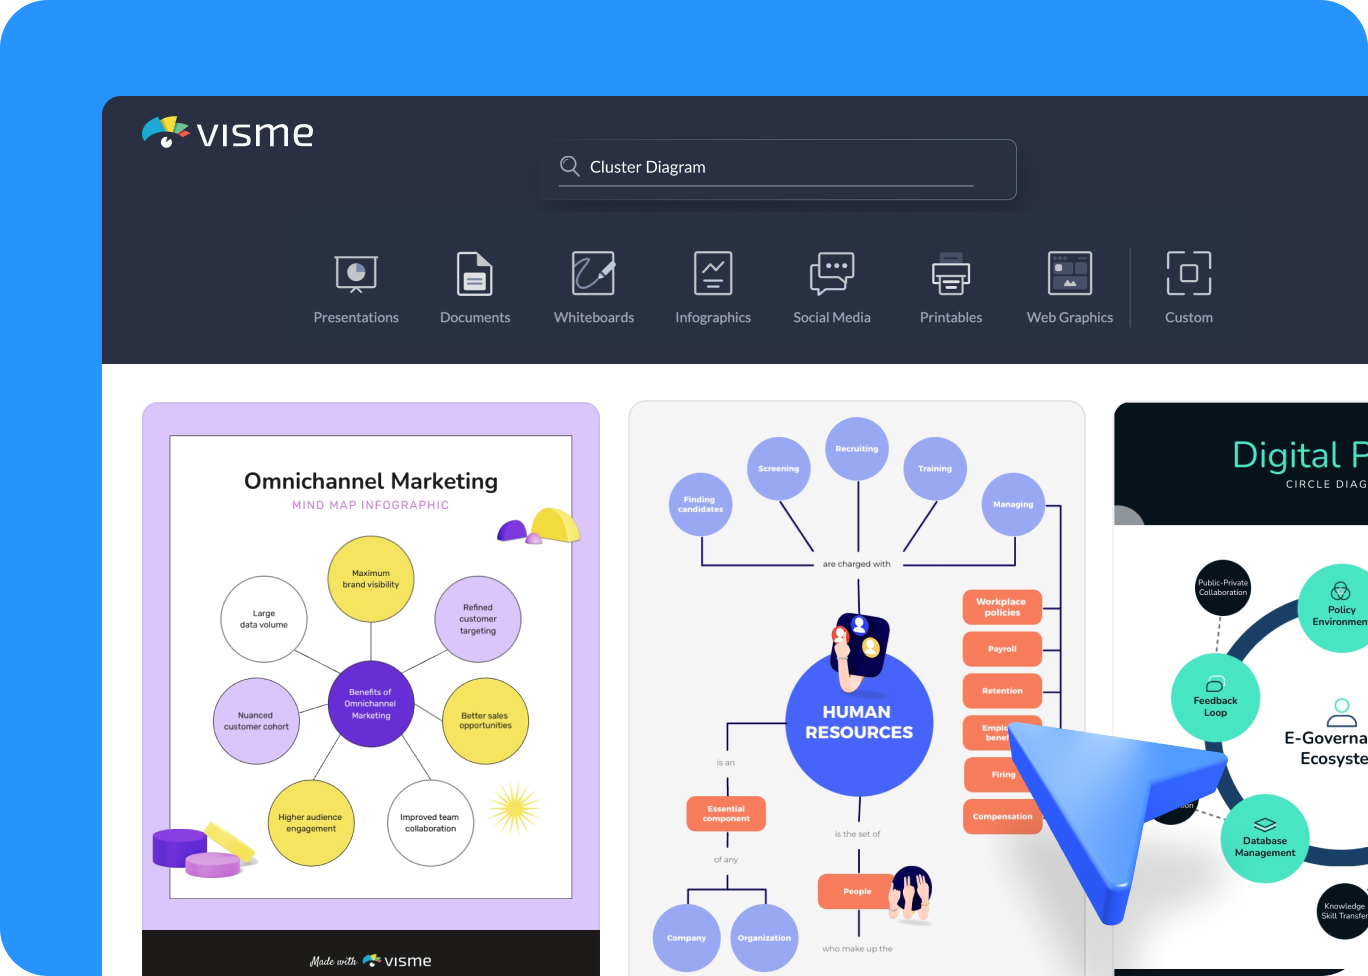
Select a cluster diagram template that suits your project and tailor it to your needs.
Invite your team to contribute directly to the spider diagram, encouraging real-time discussion and idea generation.
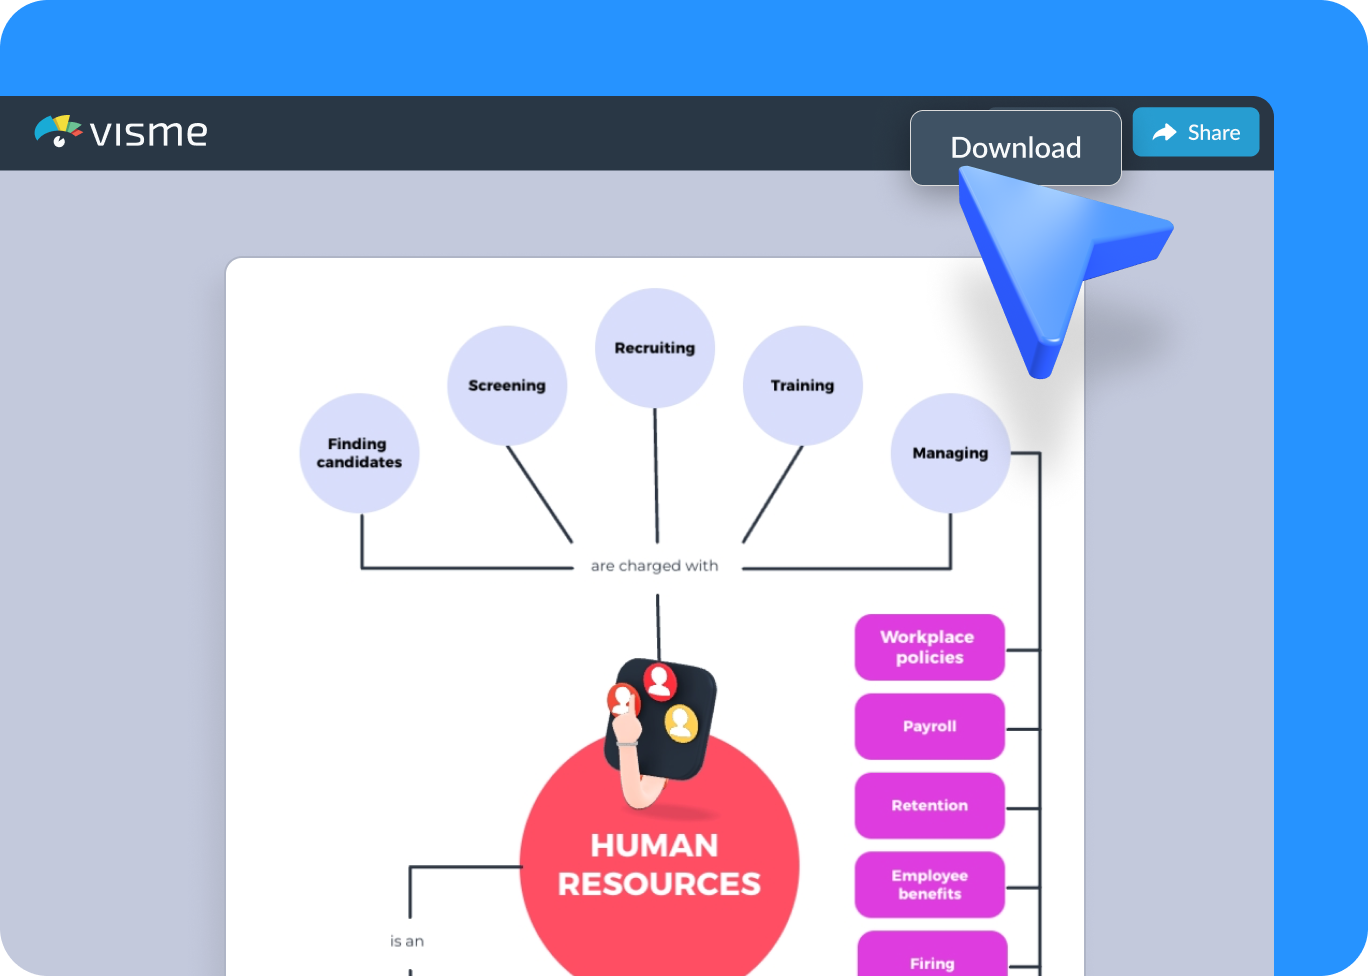
Upgrade to download your spider diagram as a PNG, JPG or PDF, or share it online for instant feedback and collaboration.
The leading visual communication platform empowering 34,300,000 users and top brands.
Easy to edit
Cluster Diagram Templates
Start organizing your ideas effortlessly with Visme's diverse cluster diagram templates. These ready-made templates offer a quick start for breaking down complex topics and visualizing relationships. Customize them to fit perfectly with your specific needs and projects.


Cluster Diagram Features
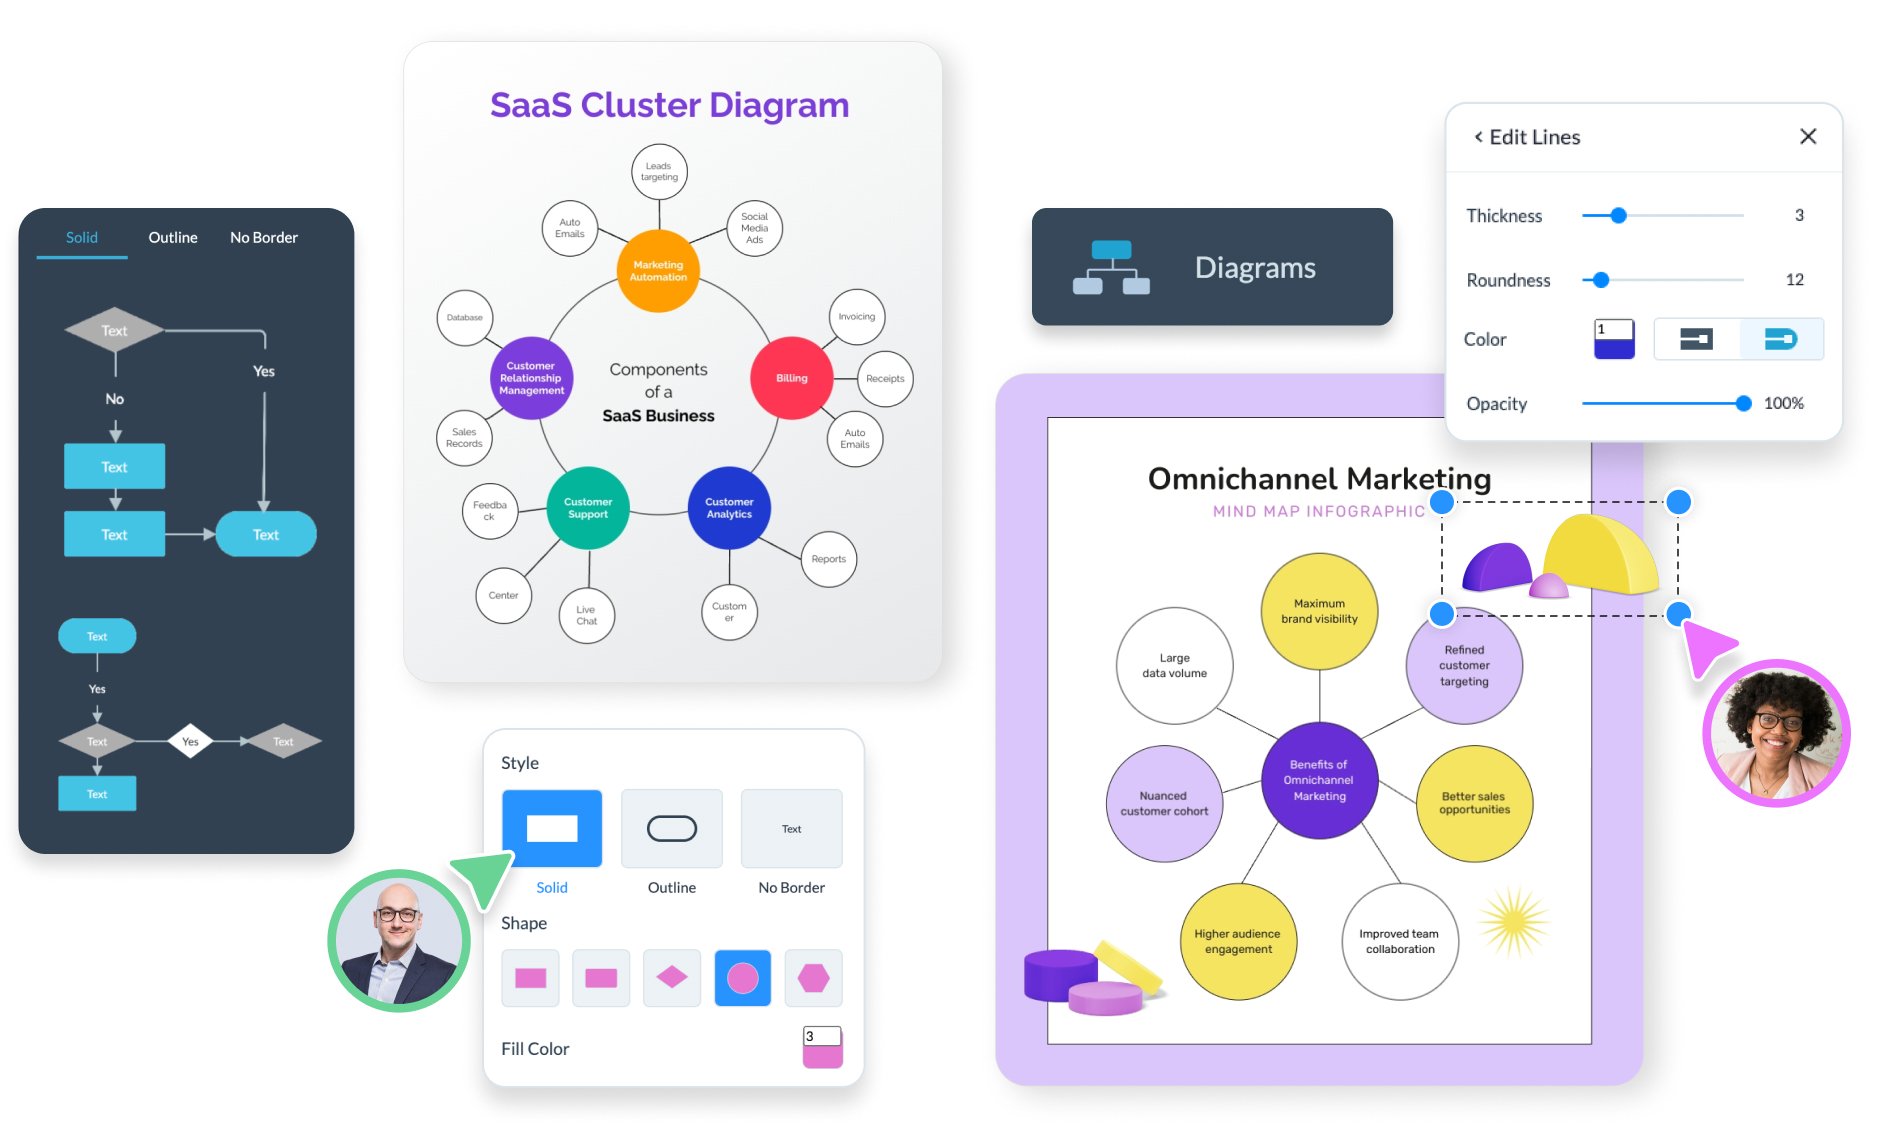
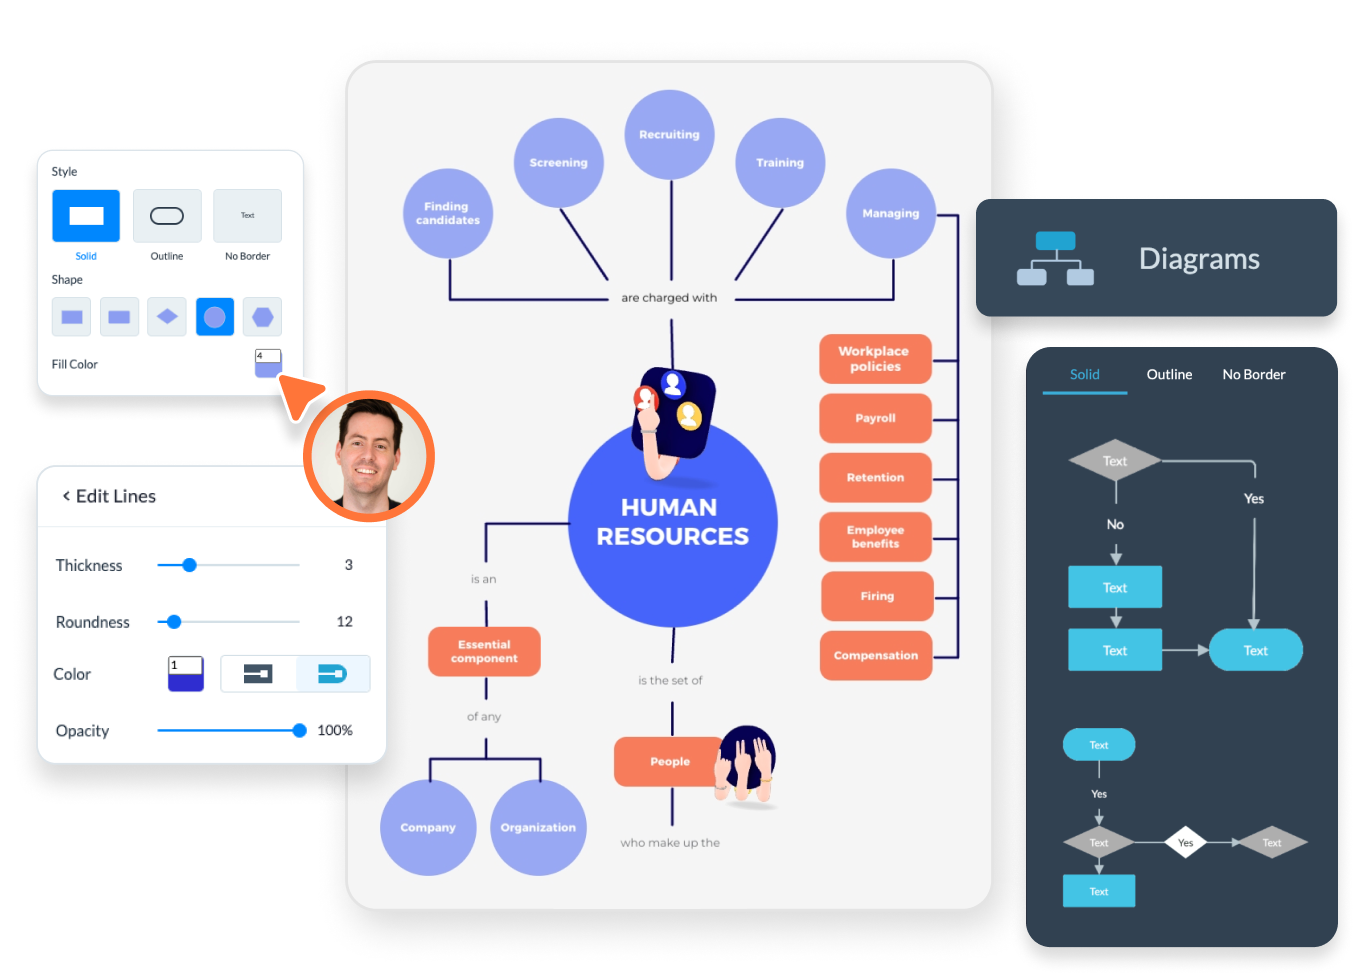
Customization Tools for Cluster Diagrams
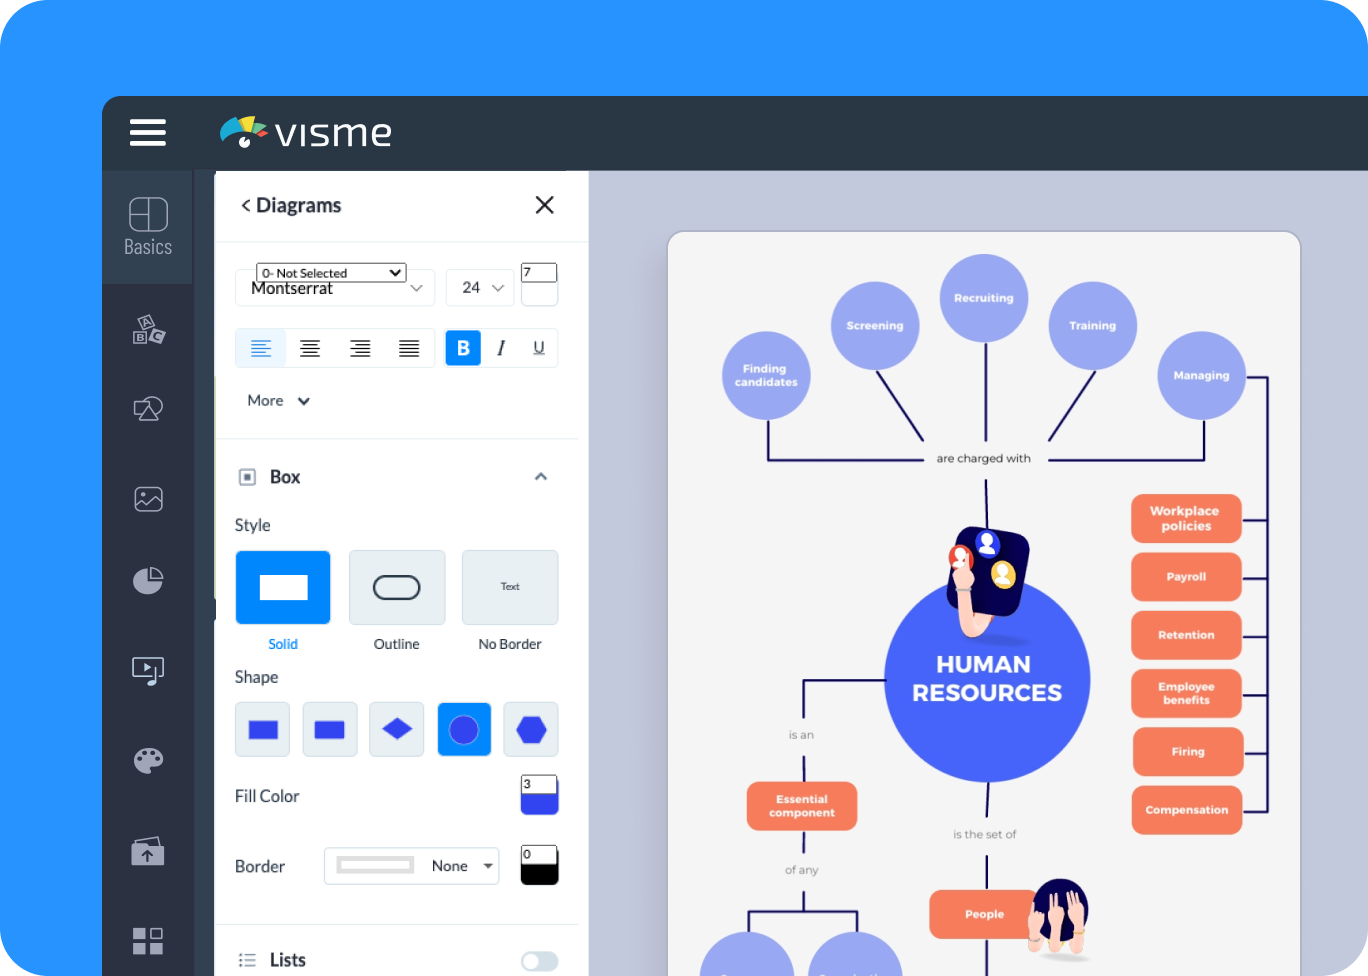
Explore Visme’s wide range of design elements for cluster diagrams. Use shapes, lines and icons to represent different ideas and their connections. Personalize with your project’s color scheme and typography to make your diagram unique and easy to follow.
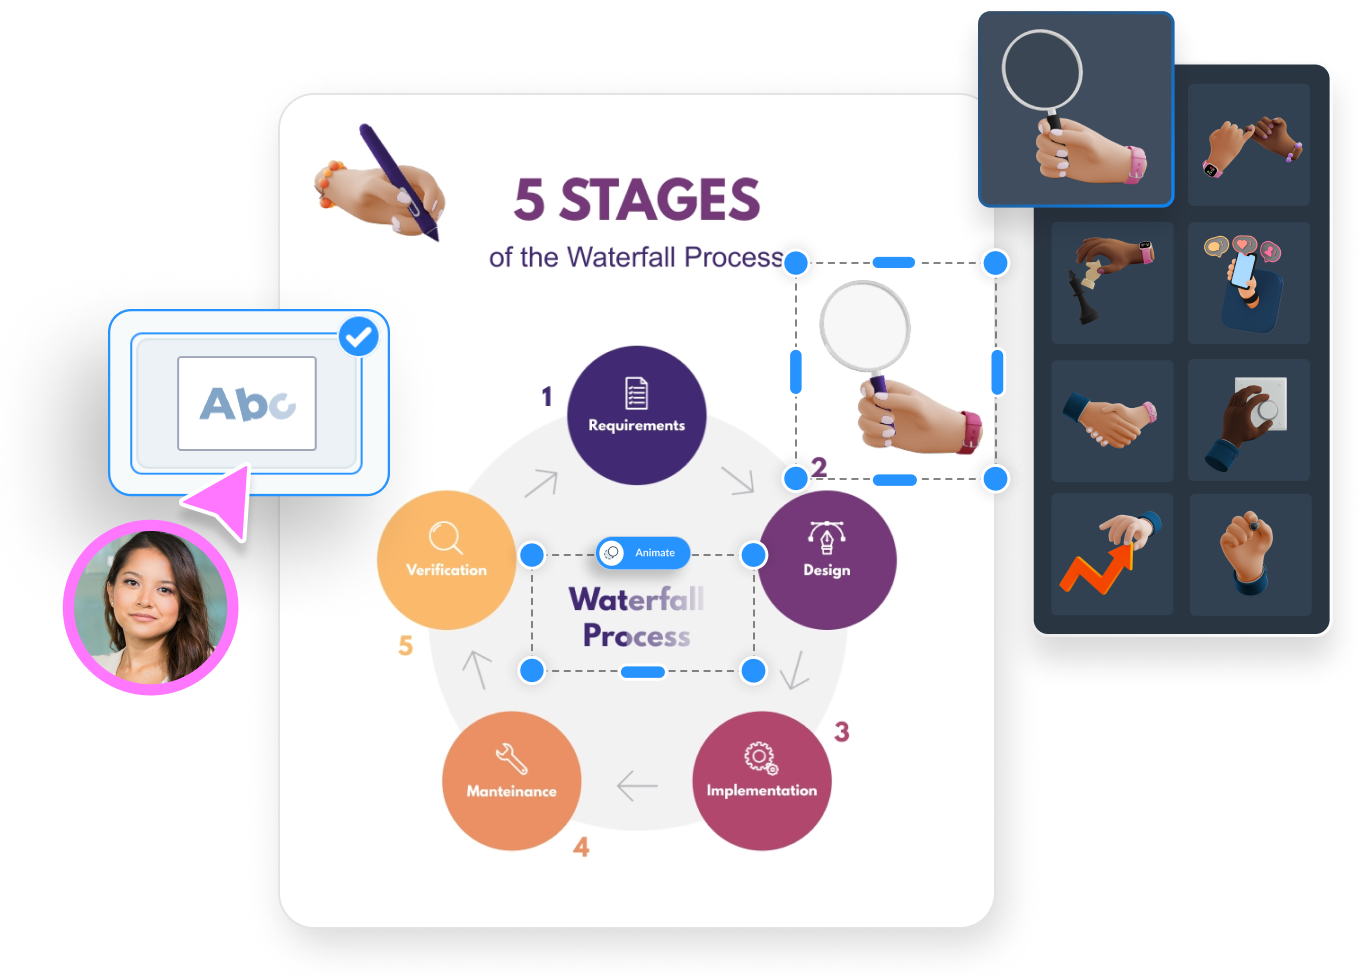
Enhancing Engagement with Interactivity and Animations
Make your cluster diagrams more engaging with Visme’s interactive features and animations. Add clickable elements or animate connections to show how ideas relate and interact. This dynamic approach makes complex ideas easier to understand and more interesting to view.
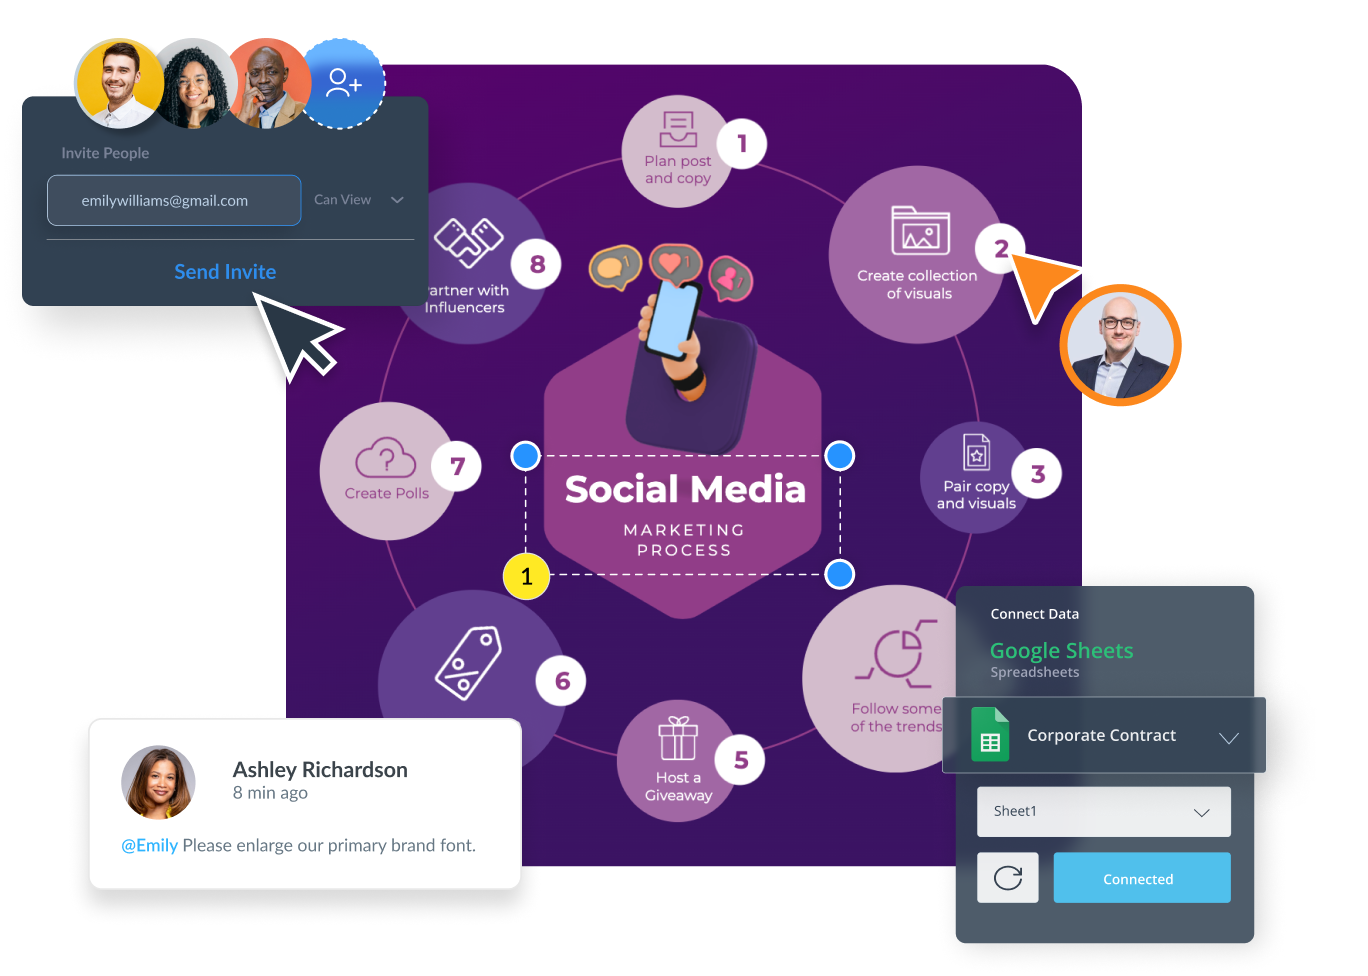
Real-Time Collaboration for Diagram Development
Improve teamwork with real-time collaboration in Visme’s cluster diagram maker. Invite your team members to review, contribute and edit diagrams simultaneously. The design collaboration features help you get quick updates and ensure everyone’s on the same page.
More Great Features
of the Cluster Diagram
Drag-and-Drop Interface
Easily create your cluster diagrams with a simple drag-and-drop interface, making the design process intuitive and fast.
Connector Lines
Create clear connections with dynamic lines that keep your diagram organized and easy to understand.
Extensive Graphic Library
Choose from a wide range of icons, 3D graphics and illustrations to enhance your cluster diagrams.
Interactive Elements
Add interactive features like hotspots, menus and clickable buttons for a unique and engaging experience.
Alignment Guides
Use smart alignment tools to arrange your diagram elements neatly, ensuring a polished and professional look.
Whiteboard Tool
Use the built-in whiteboard during brainstorming to sketch ideas quickly and efficiently.
Infinite Canvas
Use an infinite canvas to build expansive diagrams without worrying about running out of space.
Workflow Tools
Assign roles, manage deadlines and track projects with Visme’s workflow management tools.
Brand Wizard
Customize your diagrams with your own logo and branding elements to make them unique and professional.
Advanced Analytics
Gain insights into how users interact with your diagrams, including visits, unique visits, visitors' IP addresses and more.
Mind Mapping Tools
Use special mind mapping tools to visualize your ideas.
Reusable Elements
Save and reuse blocks from previous diagrams to maintain consistency and save time on future projects.

Learn More
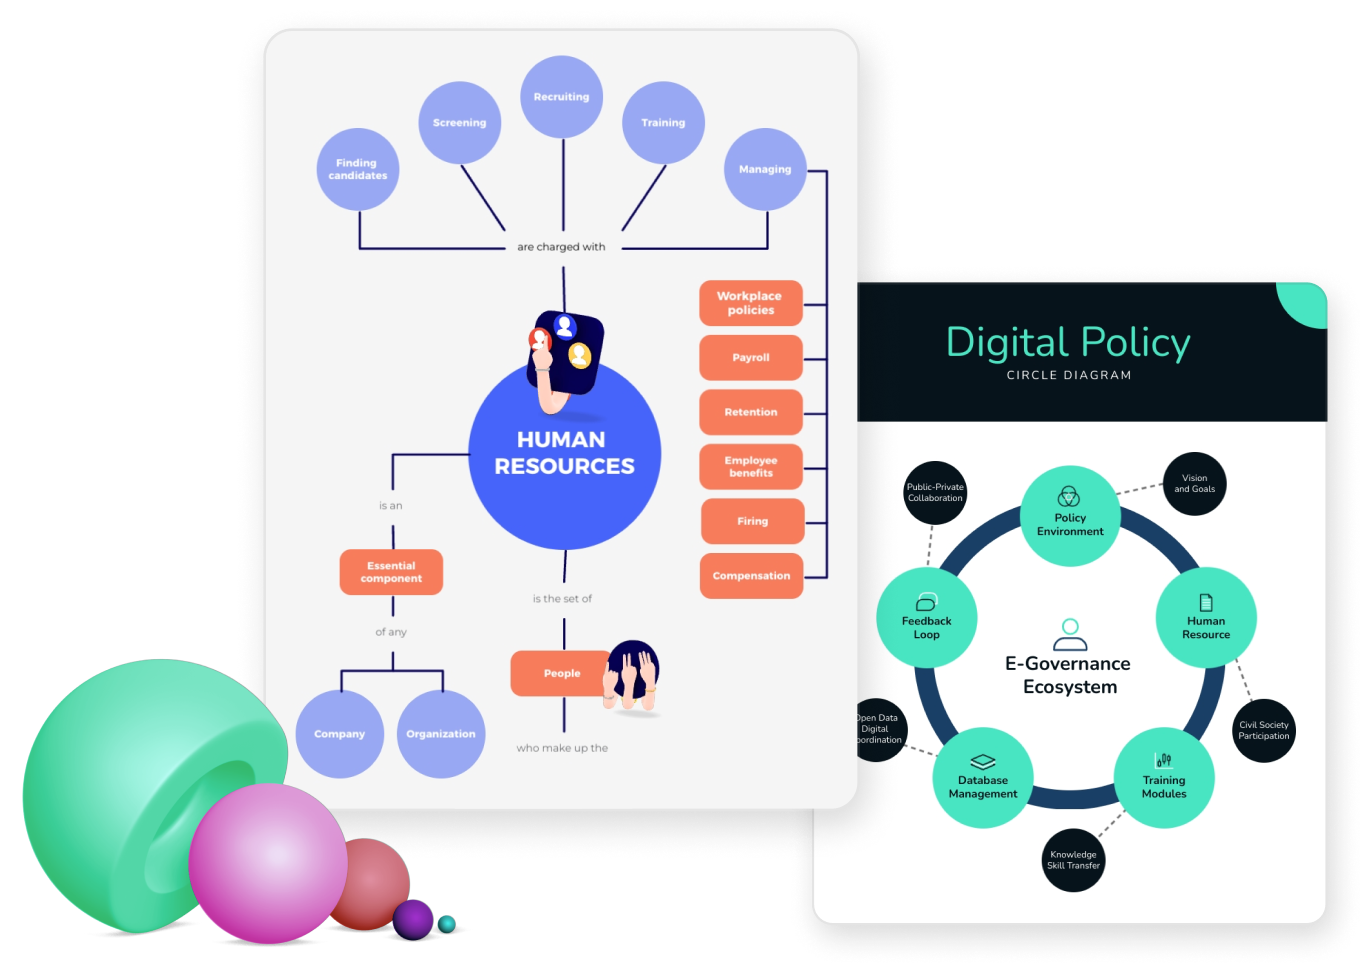
What is a Cluster Diagram?
A cluster diagram is a visual tool that helps organize ideas and information about a single concept or topic. It groups related elements together to show their relationships and connections. You can use a clustering diagram to structure and visualize complex information.
Cluster diagrams are often used in brainstorming sessions, project planning and organizing knowledge. They help clarify how different pieces of information fit together, which can be useful for students, educators, and professionals.
Create a Visual Representation of Ideas with Visme's Cluster Diagram Maker
Easily create cluster diagrams to organize and connect ideas. Visme makes it simple to personalize your diagrams with various colors, shapes and text options for clarity and visual appeal. Crafting a cluster diagram helps everyone understand the relationships between different concepts and how they fit together.
Everything you need + more
More than Just a Cluster Diagram Maker
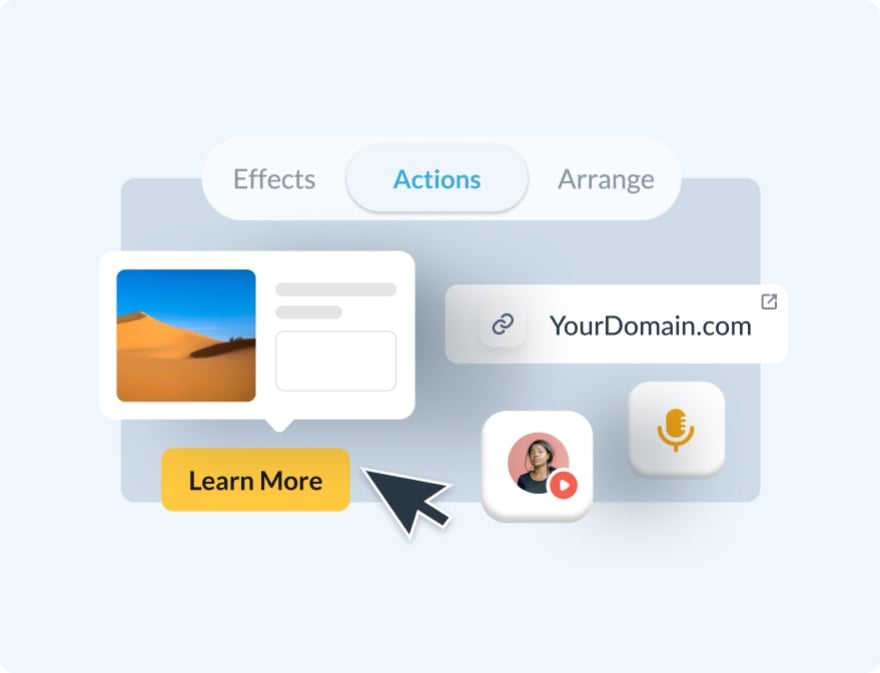
Make it engaging
Interactivity
Create interactive reports with popup and rollover effects that allow your viewer to interact with your design to learn more information.
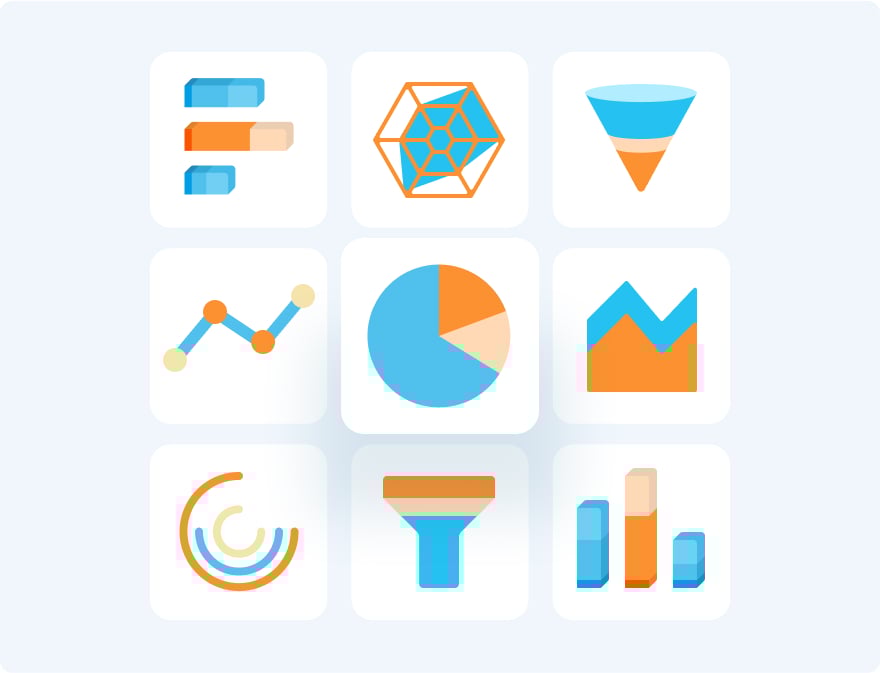
Visualize your data
Charts & Graphs
Showcase sales, marketing, website data and more in your reports with Visme’s easy-to-use charts, graphs and other data visualization tools.

Beautify your content
Video & Animation
Choose from over a million stock photos, icons, illustrations, characters, lines, shapes and more to create a completely unique report.
How it works
How to Create a Cluster Diagram in 5 Easy Steps
Visme provides simple tools to help you organize and visualize relationships among ideas. It's a great way to present information clearly and make connections easy to understand. Start by choosing from a variety of templates, then fill in the details and customize your diagram to reflect your project.
Here's a simple guide to creating your cluster diagram with Visme:
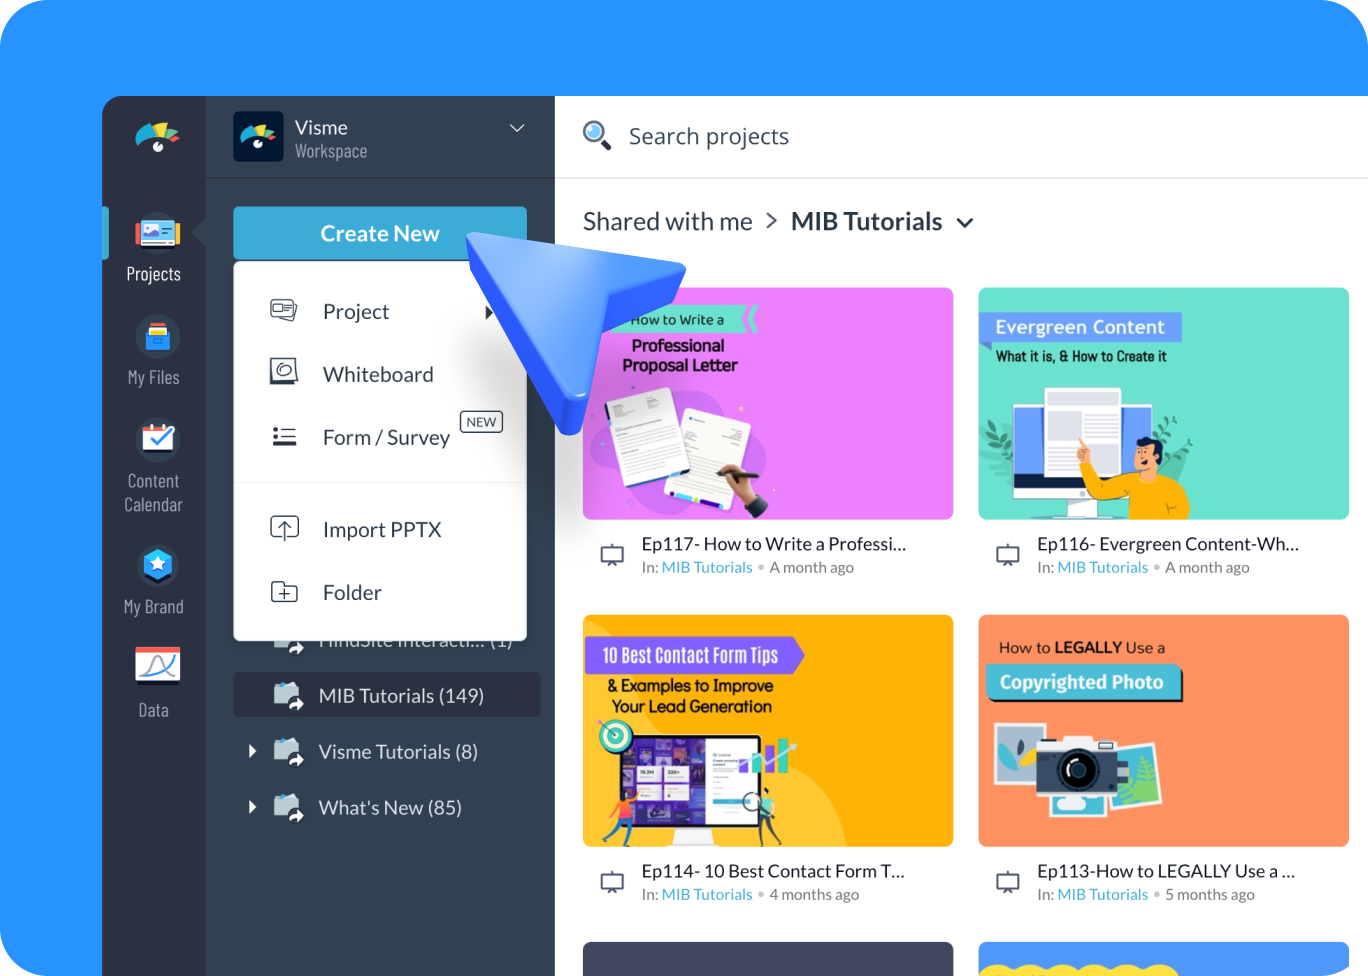
- Log into your Visme account and select “Create New” to start a new diagram project from your dashboard.
- Type “Cluster Diagram” in the search bar and browse the template options that appear.
- Choose a cluster diagram template that fits your project and start adding your ideas and connections.
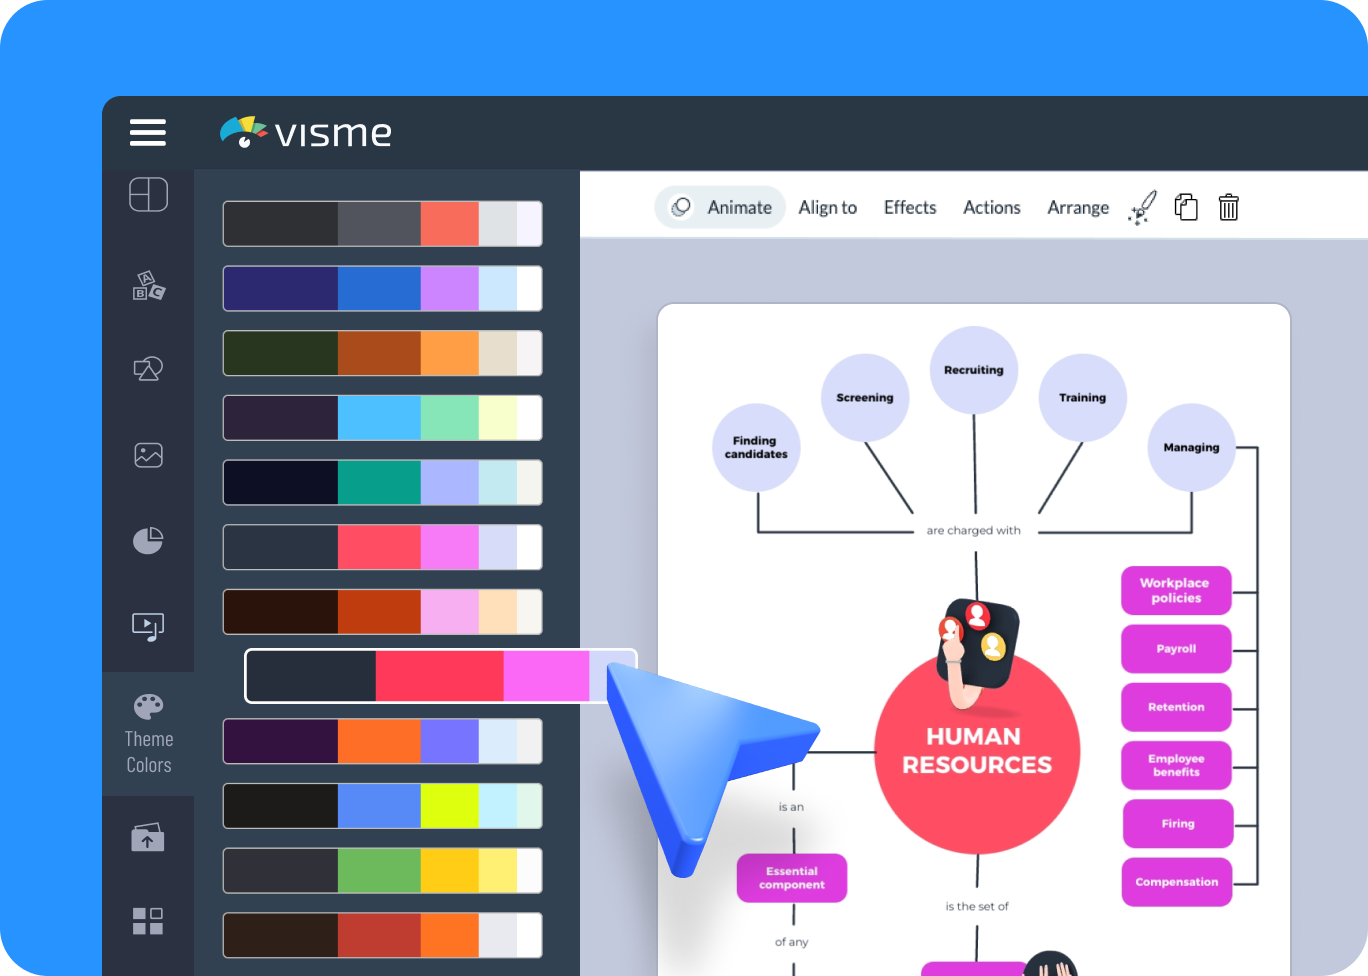
- Customize your cluster map template by adjusting colors, fonts, and shapes to suit your project style or to enhance clarity.
- Upgrade to download your Cluster Diagram in formats like PDF, JPG, or PNG. Share it using a direct link or embed it onto your website.
Quick tips
Enhance Your Cluster Diagrams
Use templates to save time and ensure a professional look from the start.
Add animations to make your diagram more engaging and easier to follow during presentations.
Include images or icons for each cluster to improve understanding and provide visual cues.
Place related clusters close together or use borders to show their connections.
Try different layouts like radial, hierarchical or concentric to find the best fit for your information.
Combine text and visuals to balance information and provide clear explanations next to visual elements.
Create a legend or key to explain colors, symbols, and patterns for easy understanding at a glance.
Maintain consistent style and formatting across all project diagrams for a professional visual identity.
Frequently Asked Questions (FAQs)
A cluster diagram template is a pre-designed layout in Visme that helps you quickly create professional-looking cluster diagrams.
You can find cluster diagram examples on the Visme website, showcasing various designs and use cases.
A clustering diagram is used to visually organize ideas, concepts or items to show their relationships and groupings.
A cluster map template helps you save time and maintain consistency when creating clustering diagrams in Visme.
A cluster diagram focuses on grouping related ideas, whereas a mind map organizes information around a central concept.
Absolutely. Visme provides user-friendly tools and a variety of templates for creating effective clustering diagrams.