1. Home
  2. Create Infographics
  3. Infographic Templates
  4. Widening The Gap Scatter Plot Infographic Template

Widening The Gap Scatter Plot Infographic Template

Use This Template

Distribute relevant data using this straightforward scatter plot infographic template.

Keep your audience informed with Visme’s red, white and blue infographic template. This scatter plot design can be quickly modified with our intuitive editing tools. Appeal to your readers by selecting a marvelous typeface in seconds. Our vibrant and chic fonts are at your fingertips.

Make this unique design memorable by adding some of Visme’s stunning vector icons and shapes.

  • Change color themes and font styles with a few clicks
  • Access millions of free graphics from inside the editor
  • Visualize data with custom widgets, maps and charts
  • Add interactivity like animation, hover effects and links
  • Download in JPG, PNG, PDF and HTML5 format
  • Share online with a link or embed it on your website

Take your data to the next level with this sophisticated design or look through Visme’s wide range of infographic templates for fresh ideas.

Edit this template with our infographic maker!

Widening The Gap Scatter Plot Infographic Template

Template Specifications

  • Dimensions

    All infographic templates are 800 pixels wide with varying lengths. These dimensions can be easily changed and the length adjusted with a slider.

  • Customizable

    This template can be fully customized. You can edit content, change image(s), apply custom colors, input your own fonts and logo, and more.

  • Formats

    Download as a high resolution JPEG, PNG, PDF or HTML5, embed into a blog post or webpage, or generate a shareable link for online use.

Compatibility

Related Infographics
Gestational Age Scatter Plot Infographic Template
Gestational Age Scatter Plot Infographic Illustrate the correlation between different factors using this beautiful scatter plot infographic template.
Patterns in Employees Infographic Template
Patterns in Employees Infographic Illustrate patterns and trends in data to facilitate decision-making using this scatter plot infographic template.
Area vs Price Scatter Plot Infographic Template
Area vs Price Scatter Plot Infographic Make data look appealing and easy to comprehend with this area vs home scatter plot infographic template.
Study Time vs Test Score Scatter Plot Infographic Template
Study Time vs Test Score Scatter Plot Infographic Present the correlation between two factors in a visual and meaningful way using this scatter plot template.
Hours Worked vs Sales Scatter Plot Template
Hours Worked vs Sales Scatter Plot Show the correlation between hours worked and sales with the help of this scatter plot template.
Sales of a Chocolate Company Scatter Plot Infographic Template
Sales of a Chocolate Company Scatter Plot Infographic Visualize trends in your sales data by customizing and sharing the sales of a chocolate company scatter plot infographic.
International Visits to Europe Scatter Plot Template
International Visits to Europe Scatter Plot Creatively present your fingers with the help of this eye-catching bite-sized infographic template.
Ice Cream Shop Sales Scatter Plot Infographic Template
Ice Cream Shop Sales Scatter Plot Infographic Make your reports and presentations more impactful by adding this beautiful scatter plot infographic template.
US Consumer Price Index and Inflation CPI Infographic Template
US Consumer Price Index and Inflation CPI Infographic Illustrate correlative data in a visually appealing way using interactive charts with this US CPI and inflation infographic template.
Education Budget Analysis of the US Infographic Template
Education Budget Analysis of the US Infographic Highlight trends and correlation between any two variables with an interactive chart using this education budget analysis infographic template.
Hours Dedicated to Household Activities Infographic Template
Hours Dedicated to Household Activities Infographic Present your data in a visual way and illustrate relationships using this scatter plot infographic template.
iPhone 11 Search Trends in Google Infographic Template
iPhone 11 Search Trends in Google Infographic Present data trends using interactive charts using this iPhone 11 Google search trends infographic template.
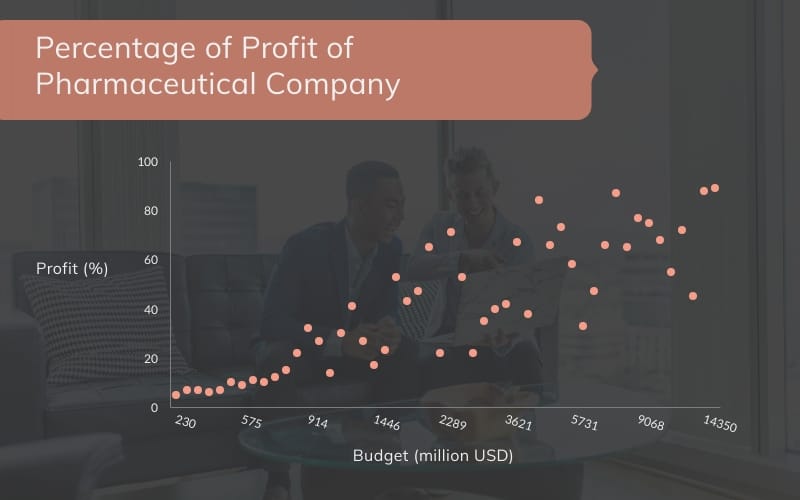
Percentage of Profit Infographic Template
Percentage of Profit Infographic Take your reports and presentations up a notch by adding beautiful charts to present data using this percentage of profit infographic template.
Urbanization Over the Years Infographic Template
Urbanization Over the Years Infographic Present socio-economic data and highlight trends over time in a visually appealing way using this scatter plot template.
Global Plastic Production Infographic Template
Global Plastic Production Infographic Illustrate your company’s research and findings in a visually appealing way using this global plastic production infographic template.
Weight VS Height Scatter Plot Template
Weight VS Height Scatter Plot Bring your findings and results to life with this stunning scatter plot infographic template.
LinkedIn Targeting Options Infographic Template
LinkedIn Targeting Options Infographic Highlight the multiple ways you can target your LinkedIn content using this infographic template.
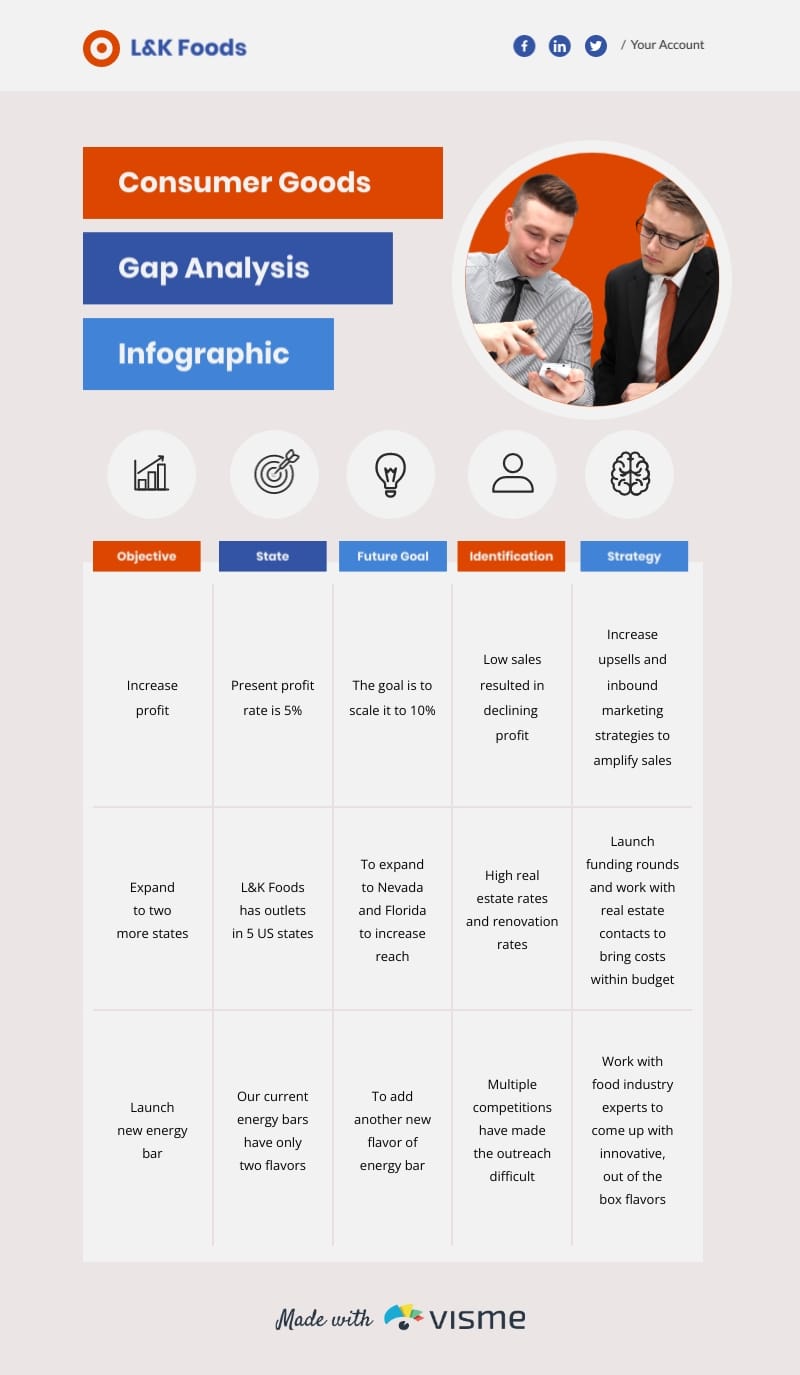
Consumer Goods Gap Analysis Infographic Template
Consumer Goods Gap Analysis Infographic Analyze the market and boost your company's sales using this infographic template.
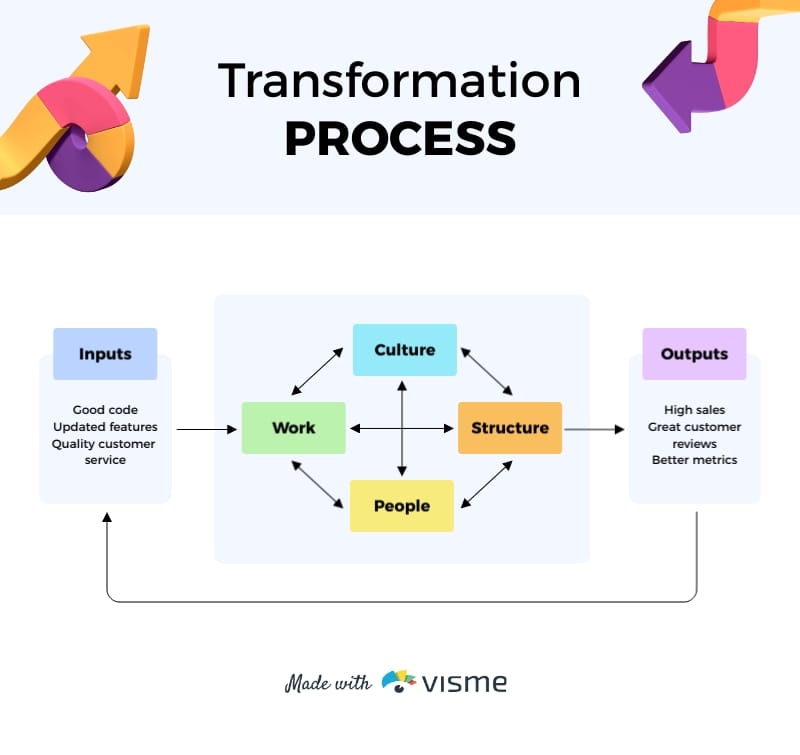
Team Gap Analysis Nadler Tushman Model Flowchart Template
Team Gap Analysis Nadler Tushman Model Flowchart Show the ins and outs of the company process and identify areas for improvement using this flowchart template.
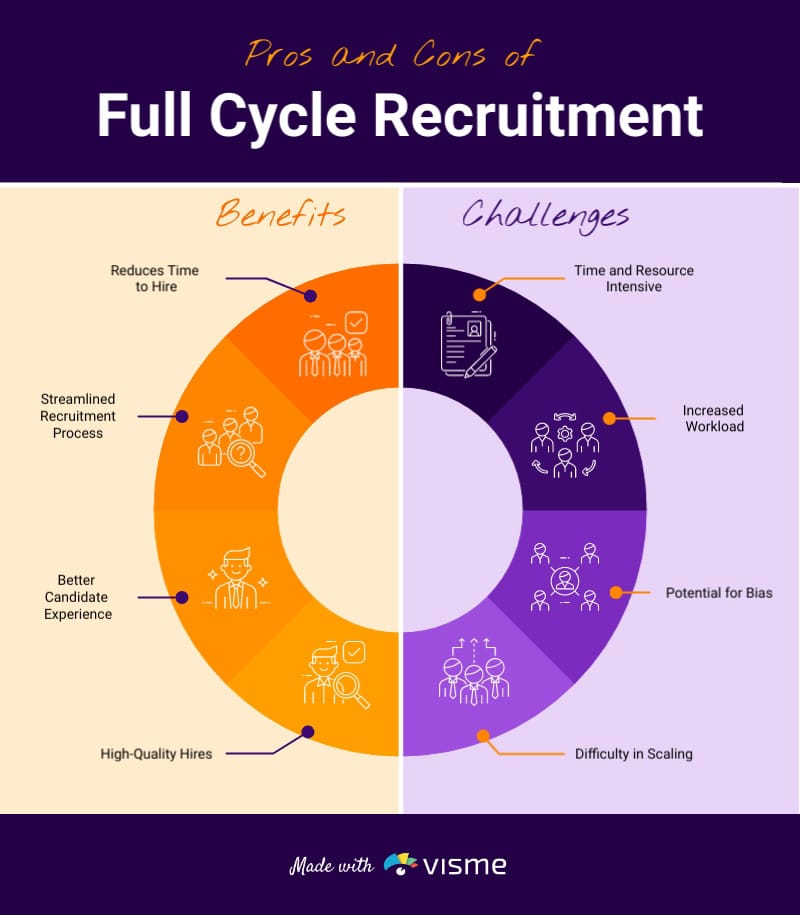
Pros and Cons of Full Cycle Recruitment Infographic Template
Pros and Cons of Full Cycle Recruitment Infographic Gain a balanced perspective on full-cycle recruitment with this informative infographic template.