1. Home
  2. Create Infographics
  3. Infographic Templates
  4. Vibrant Colors in Presentations Infographic Template

Vibrant Colors in Presentations Infographic Template

Use This Template

Highlight the power of using color in presentations with this vibrant infographic template.

Show your audience the value of using striking visuals with Visme’s beautiful infographic template. Hand-pick a stunning stock image of your choice from our large visual library. Lovely photos that span almost every category imaginable are at your disposal.

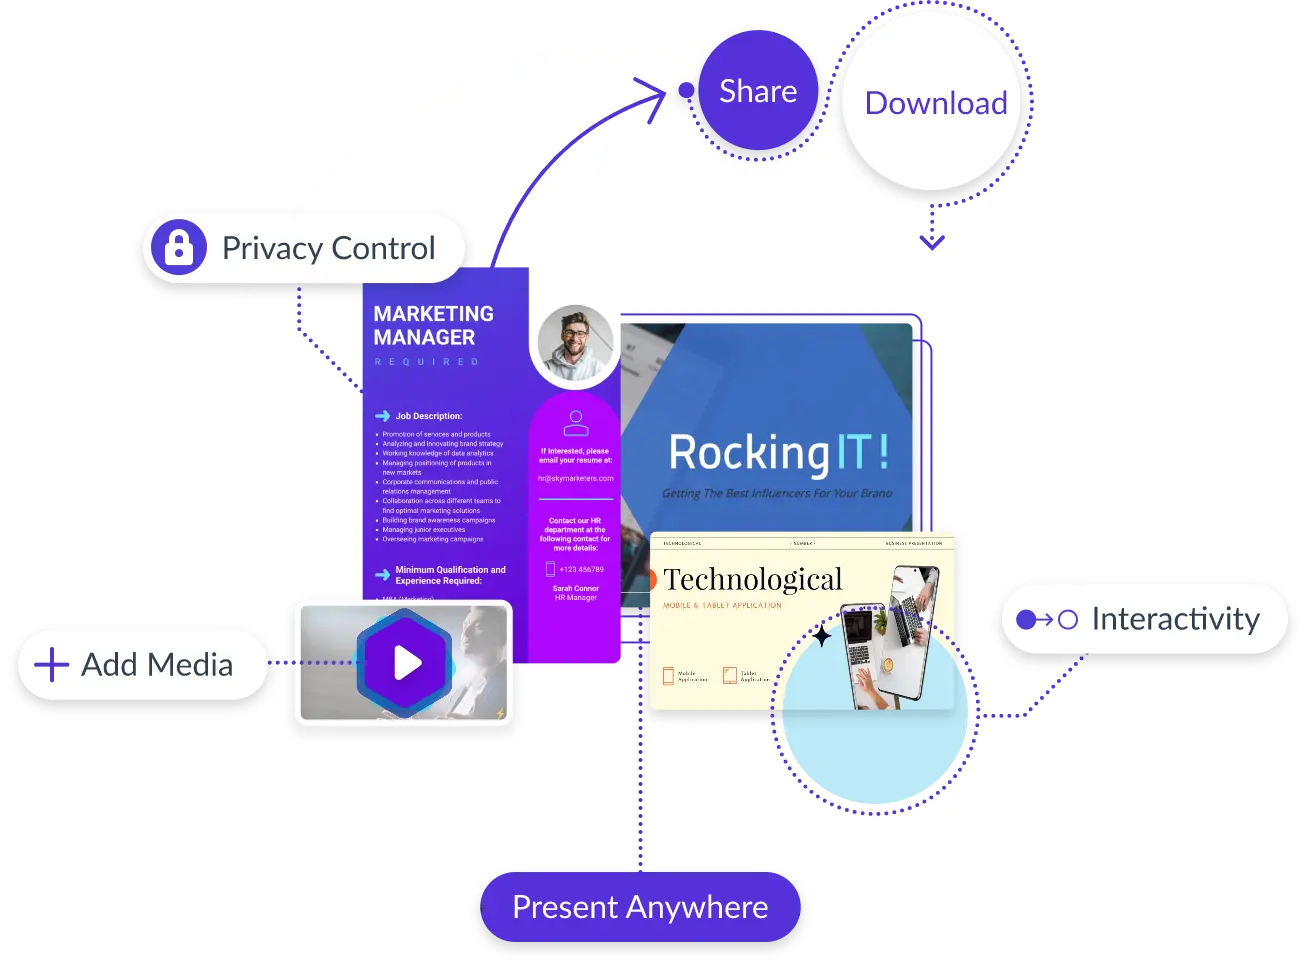
  • Change color themes and font styles with a few clicks
  • Access millions of free graphics from inside the editor
  • Visualize data with custom widgets, maps and charts
  • Add interactivity like animation, hover effects and links
  • Download in JPG, PNG, PDF and HTML5 format
  • Share online with a link or embed it on your website

Brighten up your presentations with this stunning content or explore Visme’s extensive range of infographic templates for more ideas.

Edit this template with our infographic maker!

Vibrant Colors in Presentations Infographic Template
Template Specifications
  • Dimensions

    All infographic templates are 800 pixels wide with varying lengths. These dimensions can be easily changed and the length adjusted with a slider.

  • Customizable

    This template can be fully customized. You can edit content, change image(s), apply custom colors, input your own fonts and logo, and more.

  • Formats

    Download as a high resolution JPEG, PNG, PDF or HTML5, embed into a blog post or webpage, or generate a shareable link for online use.

Compatibility

Related Infographics

Technology Use Template
Technology Use Highlight the most popular internet-using countries with the help of this infographic template.
Gestational Age Scatter Plot Infographic Template
Gestational Age Scatter Plot Infographic Illustrate the correlation between different factors using this beautiful scatter plot infographic template.
Patterns in Employees Infographic Template
Patterns in Employees Infographic Illustrate patterns and trends in data to facilitate decision-making using this scatter plot infographic template.
Area vs Price Scatter Plot Infographic Template
Area vs Price Scatter Plot Infographic Make data look appealing and easy to comprehend with this area vs home scatter plot infographic template.
Study Time vs Test Score Scatter Plot Infographic Template
Study Time vs Test Score Scatter Plot Infographic Present the correlation between two factors in a visual and meaningful way using this scatter plot template.
Hours Worked vs Sales Scatter Plot Template
Hours Worked vs Sales Scatter Plot Show the correlation between hours worked and sales with the help of this scatter plot template. 
Sports Brand Pie Chart Infographic Template
Sports Brand Pie Chart Infographic Present proportions in different types of datasets using this colorful sports brand pie chart infographic.
Global Smartphone Sales Pie Chart Template
Global Smartphone Sales Pie Chart Share your research in an impactful manner using this sales pie chart template.
Shoppers Online Infographic Template
Shoppers Online Infographic Illustrate data from your company sales or research findings using this online shopping pie chart template.
Average Student Budget Pie Chart Template
Average Student Budget Pie Chart Use this colorful student budget pie chart to present proportions in different datasets.
Budget Pie Chart Infographic Template
Budget Pie Chart Infographic Visualize your business’s monthly or quarterly estimated expenses using this budget pie chart infographic.
Product Trends Line Graph Infographic Template
Product Trends Line Graph Infographic Boost your market research reports by adding interactive charts to illustrate data in a meaningful way using this line graph infographic template.
Global Overview Line Graph Infographic Template
Global Overview Line Graph Infographic Present trends and patterns in data over time using this global overview line graph infographic template.
Airline Net Profile Line Graph Infographic Template
Airline Net Profile Line Graph Infographic Illustrate trends and patterns in data in a meaningful way using this airline net profile line graph infographic.
Customers Activity Line Graph Infographic Template
Customers Activity Line Graph Infographic Create a meaningful visualization out of your app or website data using this user activity line graph template.
Beverage Consumed Line Graph Infographic Template
Beverage Consumed Line Graph Infographic Edit this beverage line graph infographic template to present your data in a visually meaningful way.
Smartphone Ownership Bar Graph Template
Smartphone Ownership Bar Graph Present data in an engaging manner using this bar graph template.
Food Export Categories Bar Graph Template Infographic Template
Food Export Categories Bar Graph Template Infographic Afraid that your finances might be too dry? Use this bar graph infographic template to spice things up.
Netflix Subscribers Bar Graph Infographic Template
Netflix Subscribers Bar Graph Infographic Illustrate categorical data in stacks and enhance your reports and presentations with this bar graph infographic.
3DBar Graph Infographic Template
3DBar Graph Infographic Use this editable 3D bar graph infographic template to explain facts obtained from your data visually.