1. Home
  2. Create Charts & Graphs
  3. Chart Templates
  4. Monthly Expenses Pie Chart Template

Monthly Expenses Pie Chart Template

Use This Template

Visually illustrate expenses in a given time using this colorful monthly expenses pie chart template.

This gorgeous pie chart template comes with a monochromatic color theme that gives it an elegant and professional look. The colors, icons and fonts used in this template are top-notch.

The template can be used solely to summarize data using a pie chart with an easy-to-understand legend or combined with presentations, reports and proposals. 

  • Change color themes and font styles with a few clicks
  • Access millions of free graphics from inside the editor
  • Visualize data with custom widgets, maps and charts
  • Add interactivity like animation, hover effects and links
  • Download in JPG, PNG, PDF and HTML5 format
  • Share online with a link or embed it on your website

Click the button below to use this pie chart template now. If you are looking for more design ideas and categories, check out our collection of other professional templates.

Edit this template with our pie chart maker!

Monthly Expenses Pie Chart Template

Template Specifications

  • Dimensions

    All chart templates come in two sizes: horizontal (1920 x 1080 pixels) and square (800 x 800 pixels)

  • Customizable

    This chart template can be fully customized. You can edit content, change image(s), apply custom colors, add or subtract pages and more.

  • Formats

    Can be shared as public or private link online, embedded to a site or blog, or downloaded as JPG, PNG, PDF or HTML5. If downloaded as an image, you can also insert into other documents and presentations.

Compatibility

Related Charts & Graphs
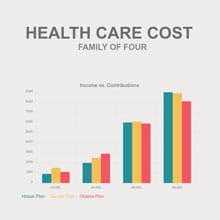
Health Care Cost Bar Graph Template
Health Care Cost Bar Graph Illustrate expenses and costs and compare between different datasets using this healthcare cost bar graph template.
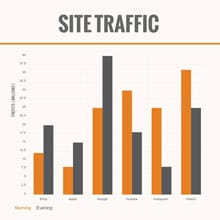
Site Traffic Infographic Template
Site Traffic Infographic Break down your site traffic in a way that's easy to comprehend using this infographic template.
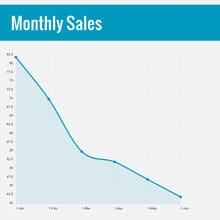
Monthly Sales Area Chart Template
Monthly Sales Area Chart Find and illustrate trends in your company’s financial data using this monthly sales area chart template.
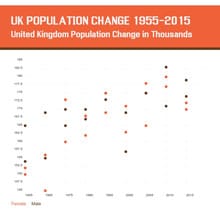
UK Population Change Scatter Plot Template
UK Population Change Scatter Plot Make your reports and proposals impactful with this UK population change scatter plot template.
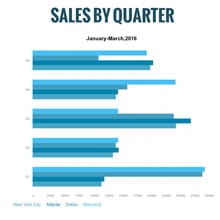
Sales by Quarter Bar Graph Template
Sales by Quarter Bar Graph Use this sales bar chart template to present data obtained from your company’s quarterly sales.
Business Information Pie Chart Template
Business Information Pie Chart Present data and proportions in a visually appealing way using this business information pie chart template.
Top 10 Products By Revenue Bar Graph Template
Top 10 Products By Revenue Bar Graph Illustrate different proportions in data using colorful stacked bars with this revenue bar graph template.
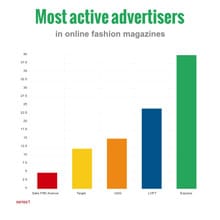
Most Active Advertisers Bar Graph Template
Most Active Advertisers Bar Graph Use this simple bar graph template to help visualize your analytics and other data in a digestible way.
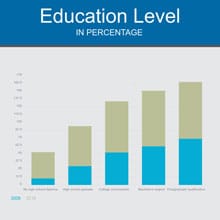
Educational Level Bar Graph Template
Educational Level Bar Graph Present comparison between different datasets using this educational level bar graph template.
Nonprofit Organizations Pie Chart Template
Nonprofit Organizations Pie Chart Present different quantities according to proportion by customizing this nonprofit pie chart template.
Revenues by Region Line Graph Template
Revenues by Region Line Graph Explain trends in data in a visually engaging way using this financial line graph template.
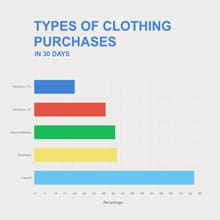
Clothing Purchases Bar Graph Template
Clothing Purchases Bar Graph Visualize your store’s purchase data and statistics using this 30 days purchase bar graph template.
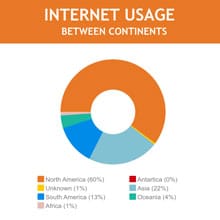
Technology Use Pie Chart Template
Technology Use Pie Chart Illustrate quantities and proportions in data visually using this customizable technology pie chart template.
Experience Level of Marketing Managers Pie Chart Template
Experience Level of Marketing Managers Pie Chart Edit this colorful pie chart template to visually present different proportions of data.
Sales Template
Sales Boost the sales turnover of your brand using this creative leaderboard template.
Training videos Template
Training videos Share your brand’s value proposition with your website visitors using this leaderboard template.
U.S Food Consumption Template
U.S Food Consumption Visualize U.S. food consumption at a glance with this sleek web graphic template.
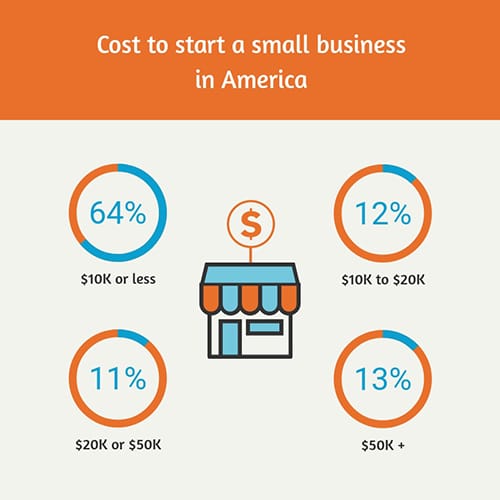
Cost to Start a Small Business Template
Cost to Start a Small Business Share survey results on the cost to start a small business with this sleek web graphic template.
Company Timeline Template
Company Timeline Explain your company history in style with the help of this visually engaging company timeline template.
Views on President Survey Template
Views on President Survey Share public sentiment and support towards presidential candidates with this survey template.