1. Home
  2. Create Charts & Graphs
  3. Chart Templates
  4. Hourly Sprint Burndown Chart Modern Template

Hourly Sprint Burndown Chart Modern Template

Use This Template

Get a clear and real-time overview of your team's performance with this efficient hourly sprint burndown chart.

Ideal for agile teams that work in sprints, this template communicates progress in a visually appealing and instantly comprehensible manner. It’s useful for showcasing scope, actual work, ideal trends, and remaining work — all of which can help with quick interventions. Tweak this graph to meet your project milestones using Visme's editor.

  • Change colors, fonts and more to fit your branding
  • Access free, built-in design assets or upload your own
  • Visualize data with customizable charts and widgets
  • Add animation, interactivity, audio, video and links
  • Download in PDF, JPG, PNG and HTML5 format
  • Create page-turners with Visme’s flipbook effect
  • Share online with a link or embed on your website

Begin editing this template now, or venture further into Visme's rich vault of modern line graph templates—all designed to contribute to your data stories. 

Edit this template with our pie chart maker!

Hourly Sprint Burndown Chart Modern Template
Template Specifications
  • Dimensions

    All chart templates come in two sizes: horizontal (1920 x 1080 pixels) and square (800 x 800 pixels)

  • Customizable

    This chart template can be fully customized. You can edit content, change image(s), apply custom colors, add or subtract pages and more.

  • Formats

    Can be shared as public or private link online, embedded to a site or blog, or downloaded as JPG, PNG, PDF or HTML5. If downloaded as an image, you can also insert into other documents and presentations.

Compatibility

Related Charts & Graphs

Unit Sales Supply and Demand Graph Template
Unit Sales Supply and Demand Graph Visualize your product's supply and demand using this interactive graph template.
Graduation Rate In Different Years Line Graph Template
Graduation Rate In Different Years Line Graph Understand the ebb and flow of graduation rates across different years with this crisp line graph template.
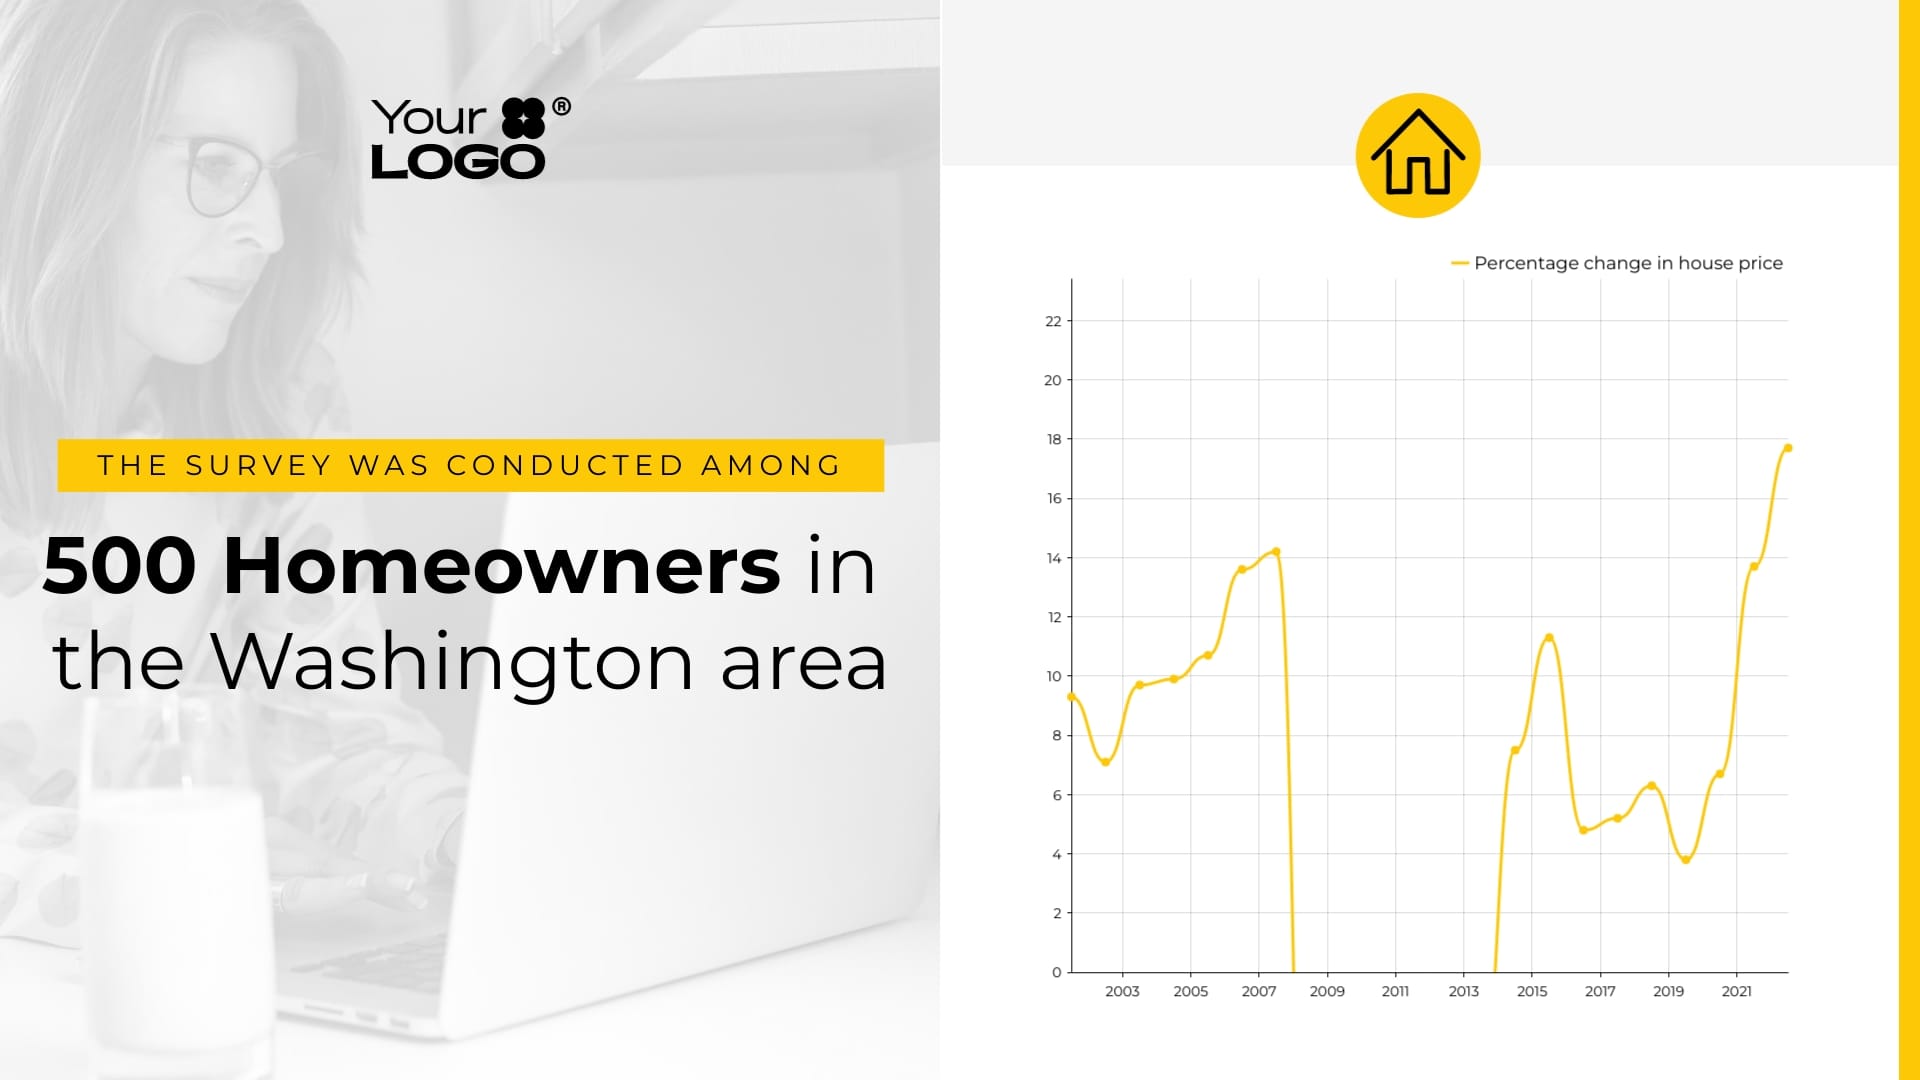
Housing Price Growth Change Line Chart Template
Housing Price Growth Change Line Chart Trace the trajectory of housing price growth over time with this insightful line graph template.
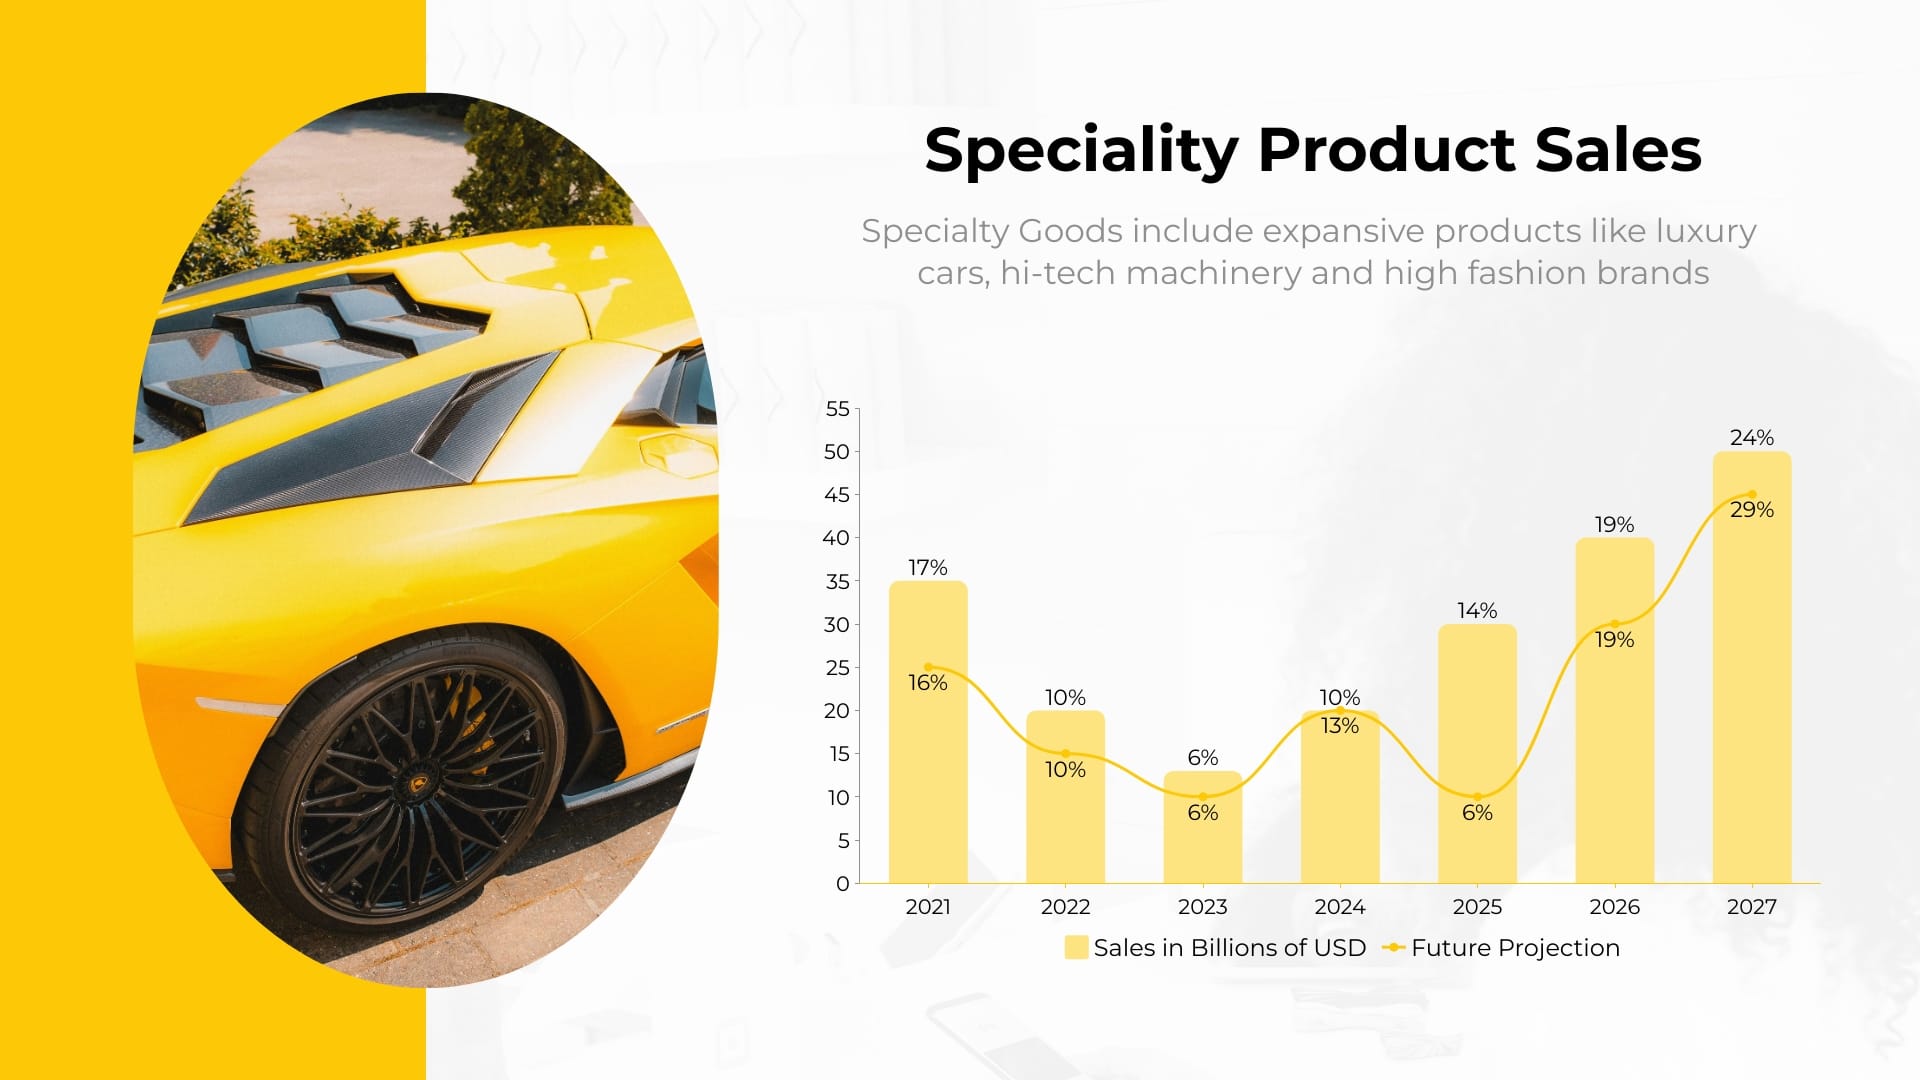
Speciality Product Sales Line Chart Template
Speciality Product Sales Line Chart Evaluate your specialty product's sales growth patterns through time using this beautifully crafted line graph template.
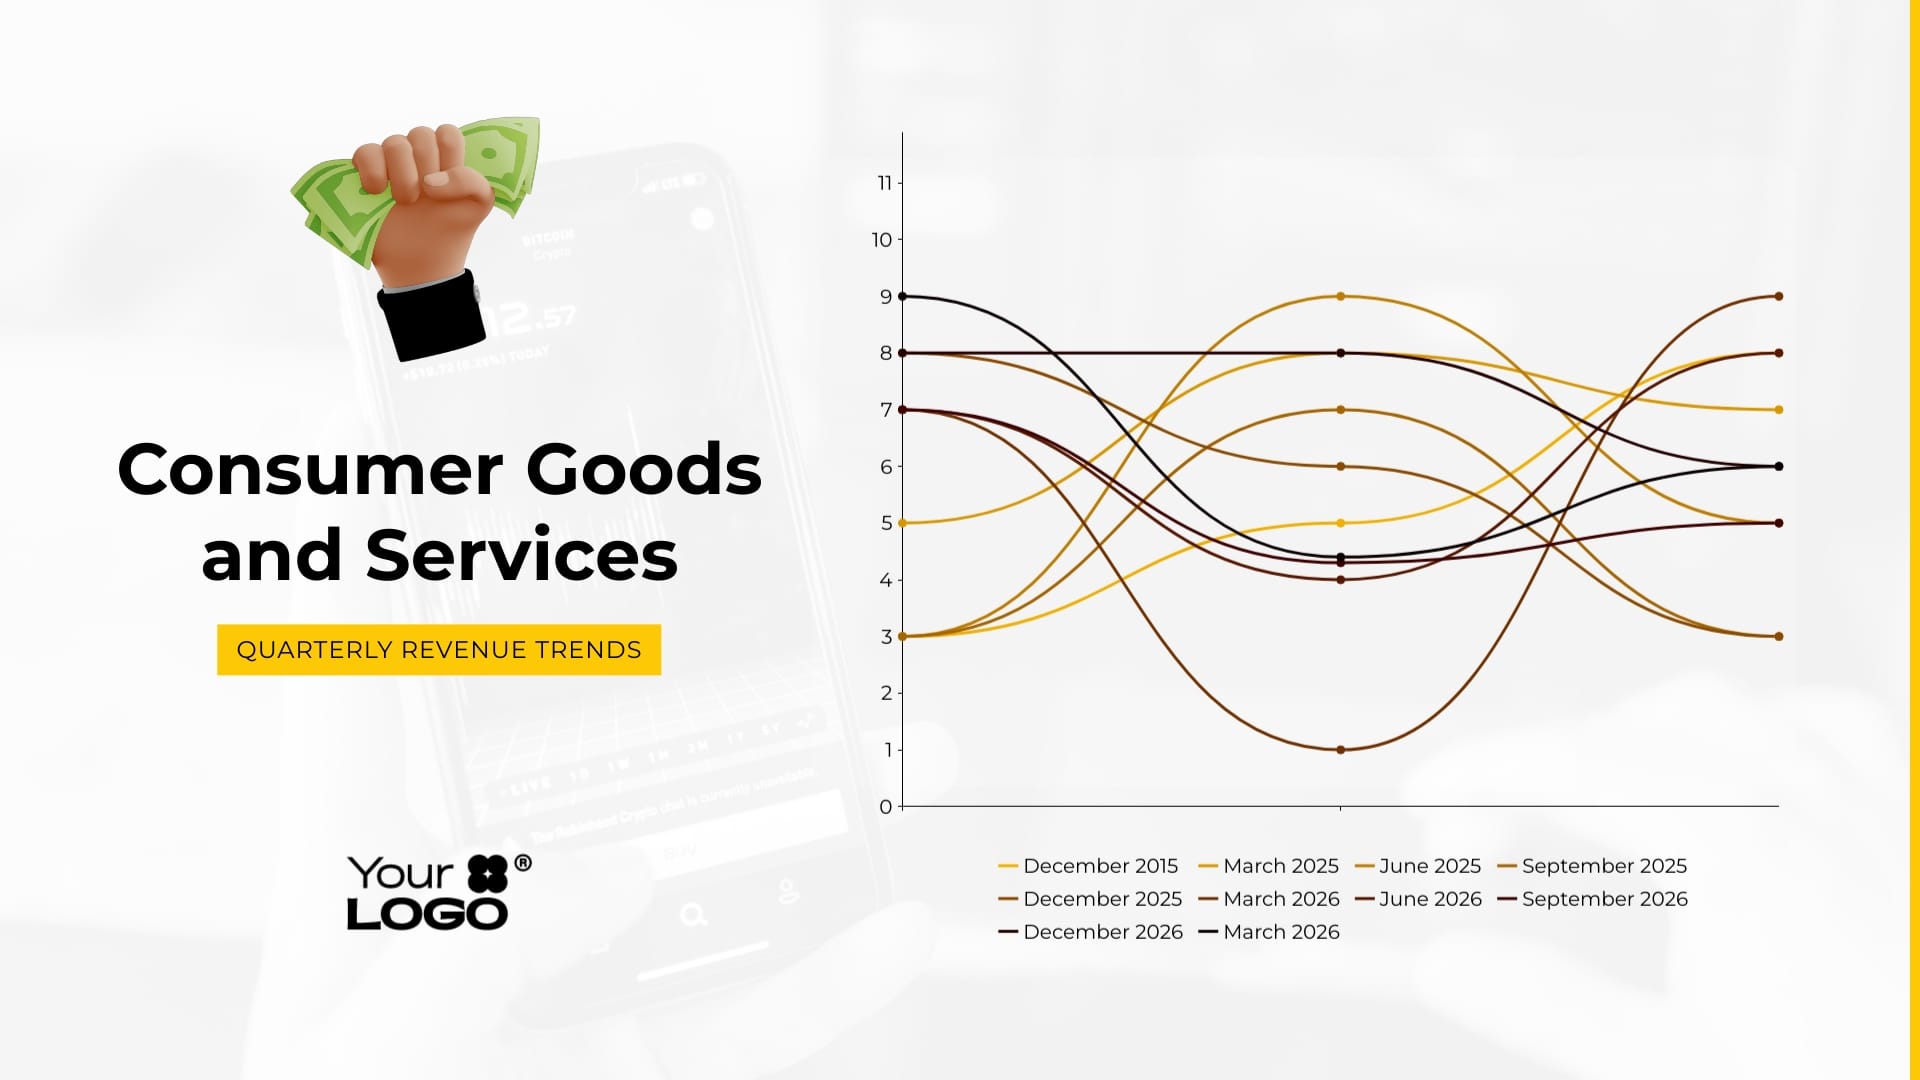
Quarterly Revenue Trends Line Graph Template
Quarterly Revenue Trends Line Graph Unlock insights on your quarterly profits with this trendy line graph template.
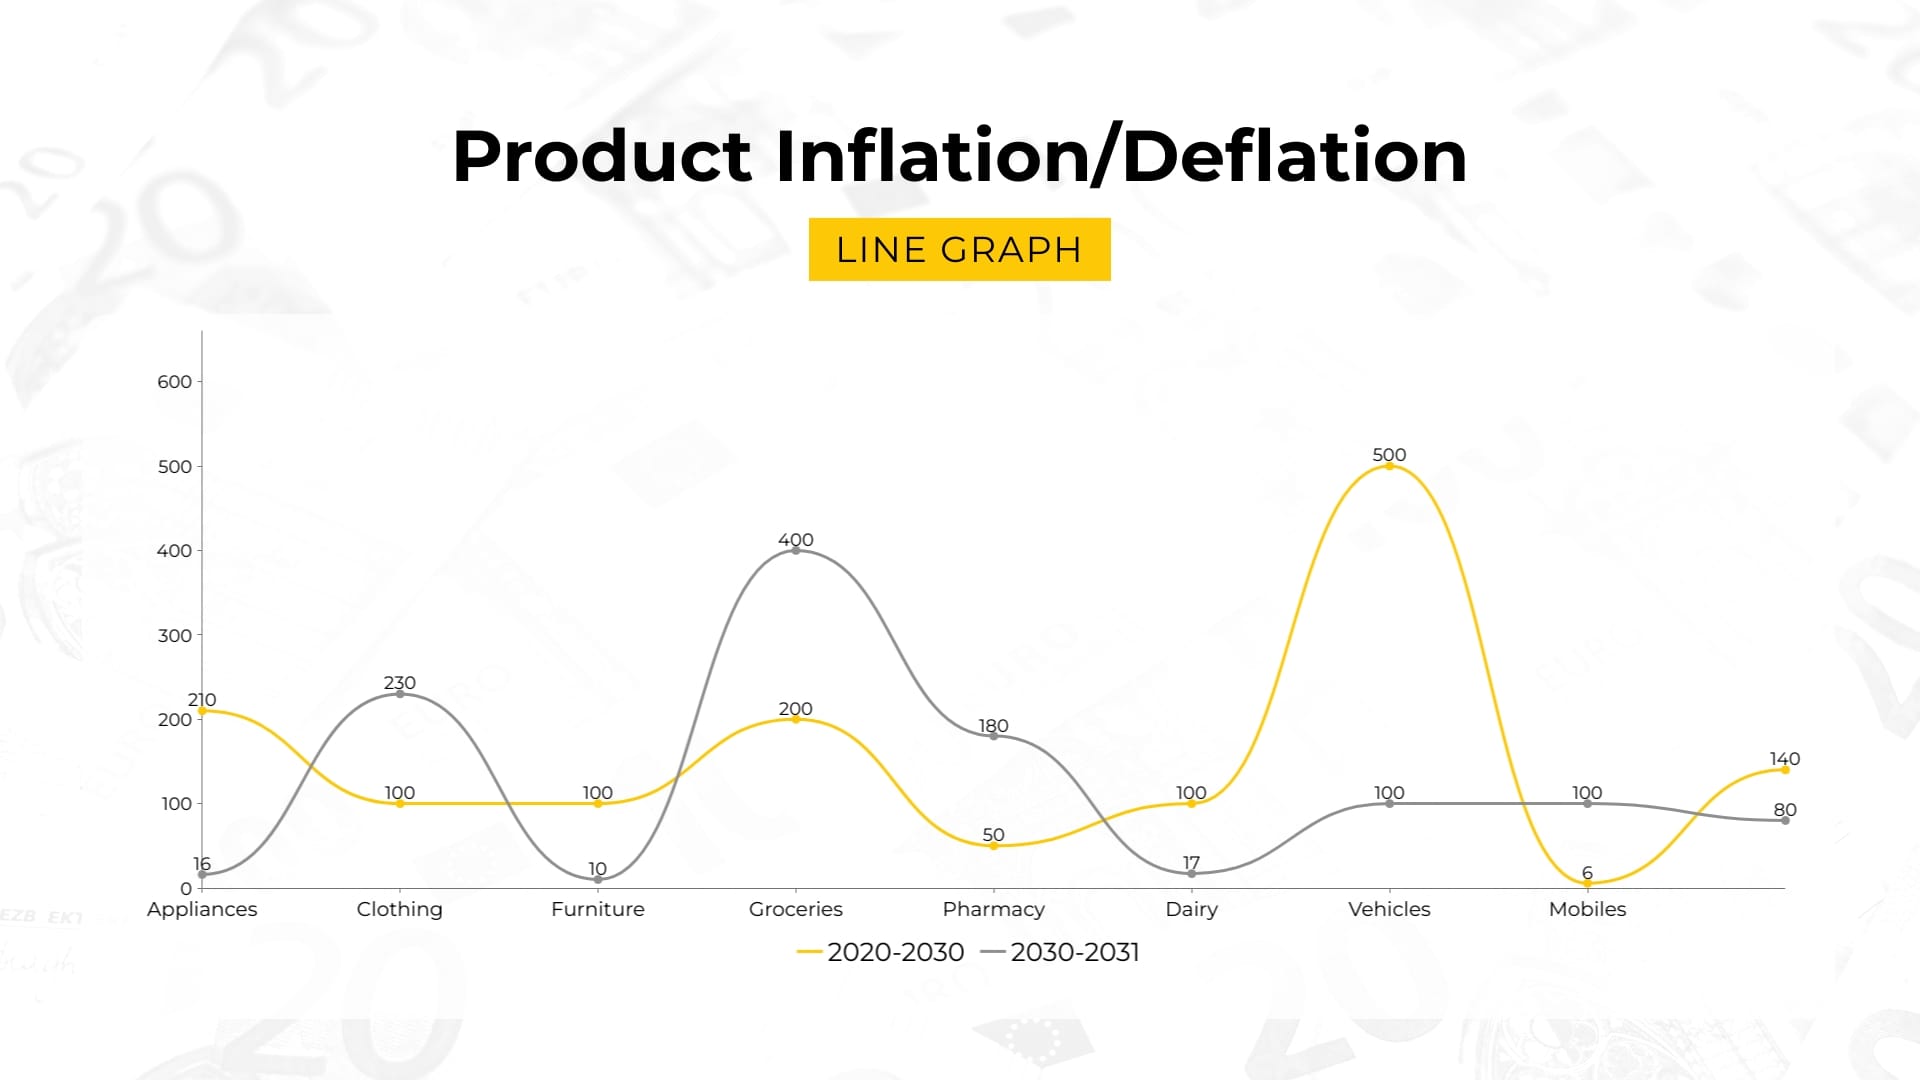
Product Inflation/Deflation Line Graph Template
Product Inflation/Deflation Line Graph Assess your product’s market performance over time with this easy-to-understand line graph template.
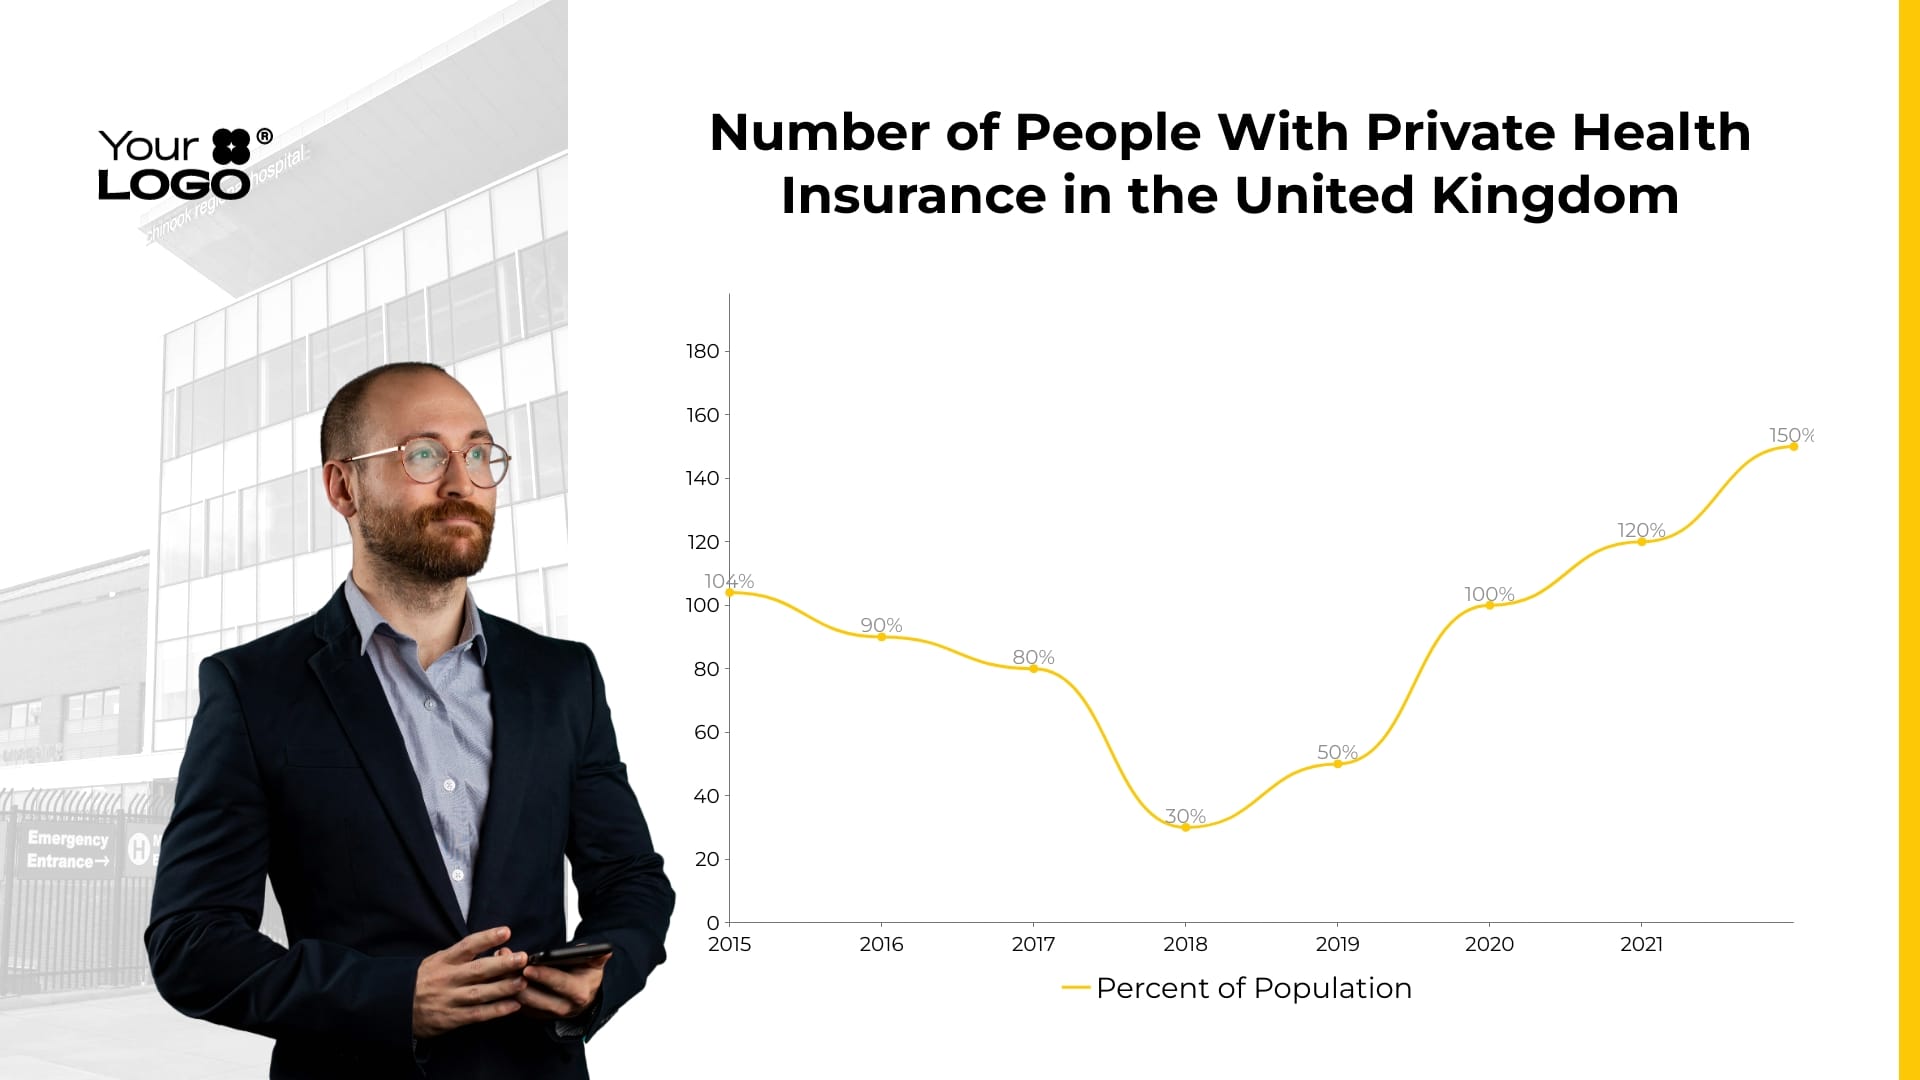
Private Health Insurance in the UK Line Graph Template
Private Health Insurance in the UK Line Graph Explore the shifts in the private health coverage sector using this intuitive line graph template.
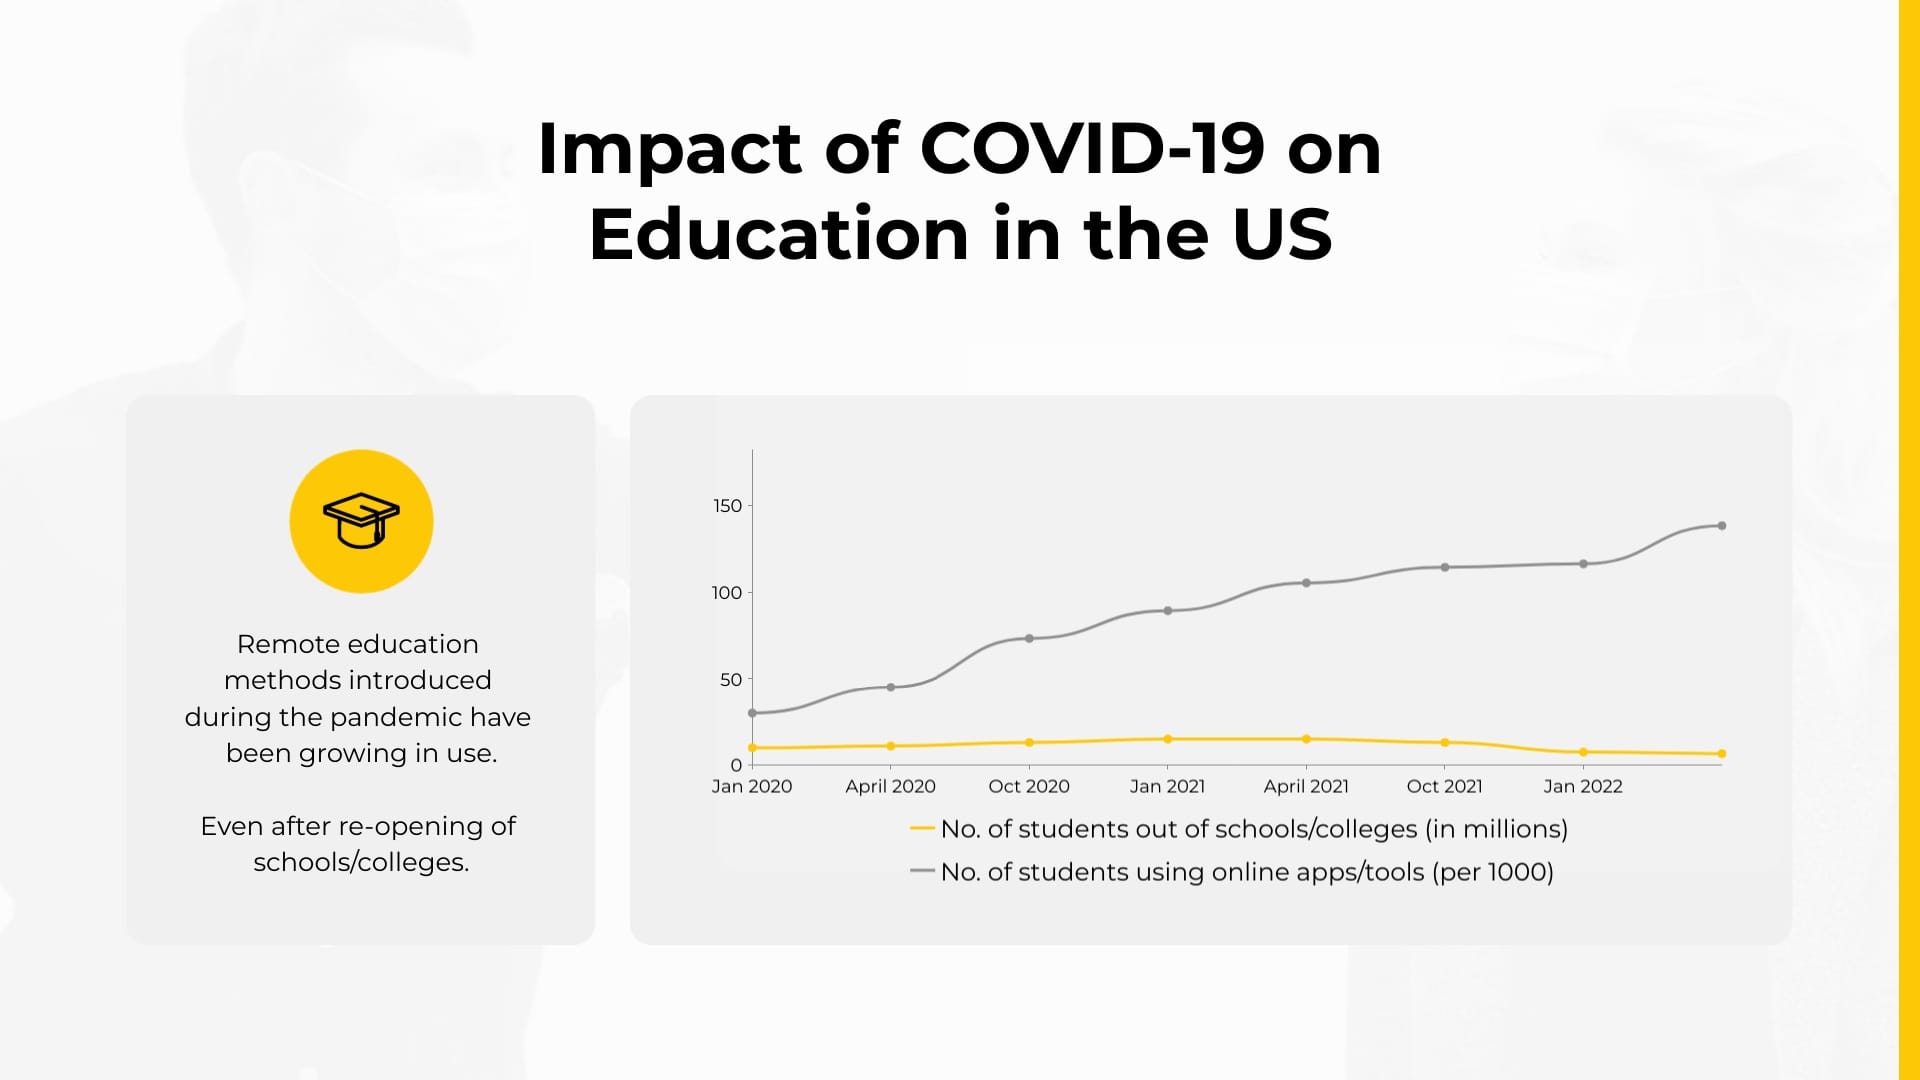
COVID Impact on Education in the US Chart Template
COVID Impact on Education in the US Chart Showcase the ramifications of the COVID-19 pandemic on education with this impactful line chart template.
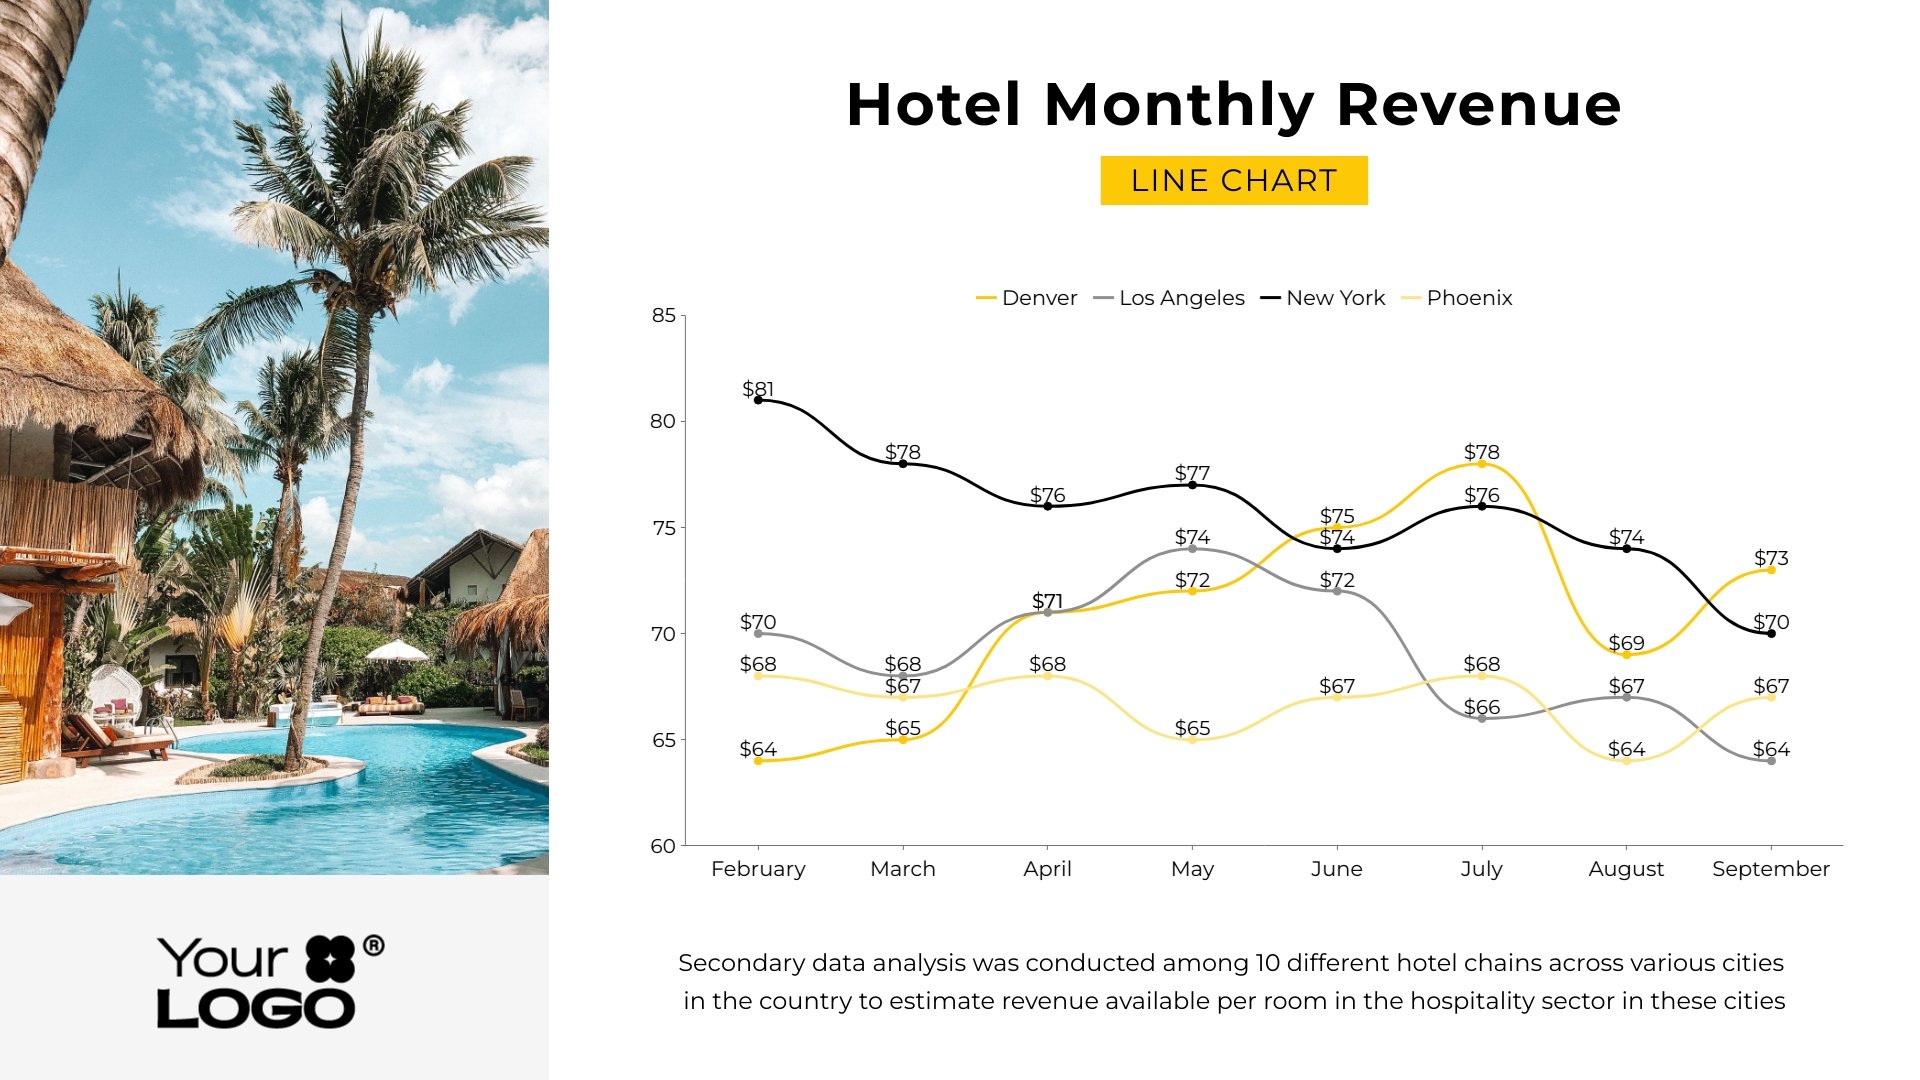
Hotel Monthly Revenue Line Chart Template
Hotel Monthly Revenue Line Chart Turn your financial data into an engaging story with this contemporary line chart template tailored for hotels.
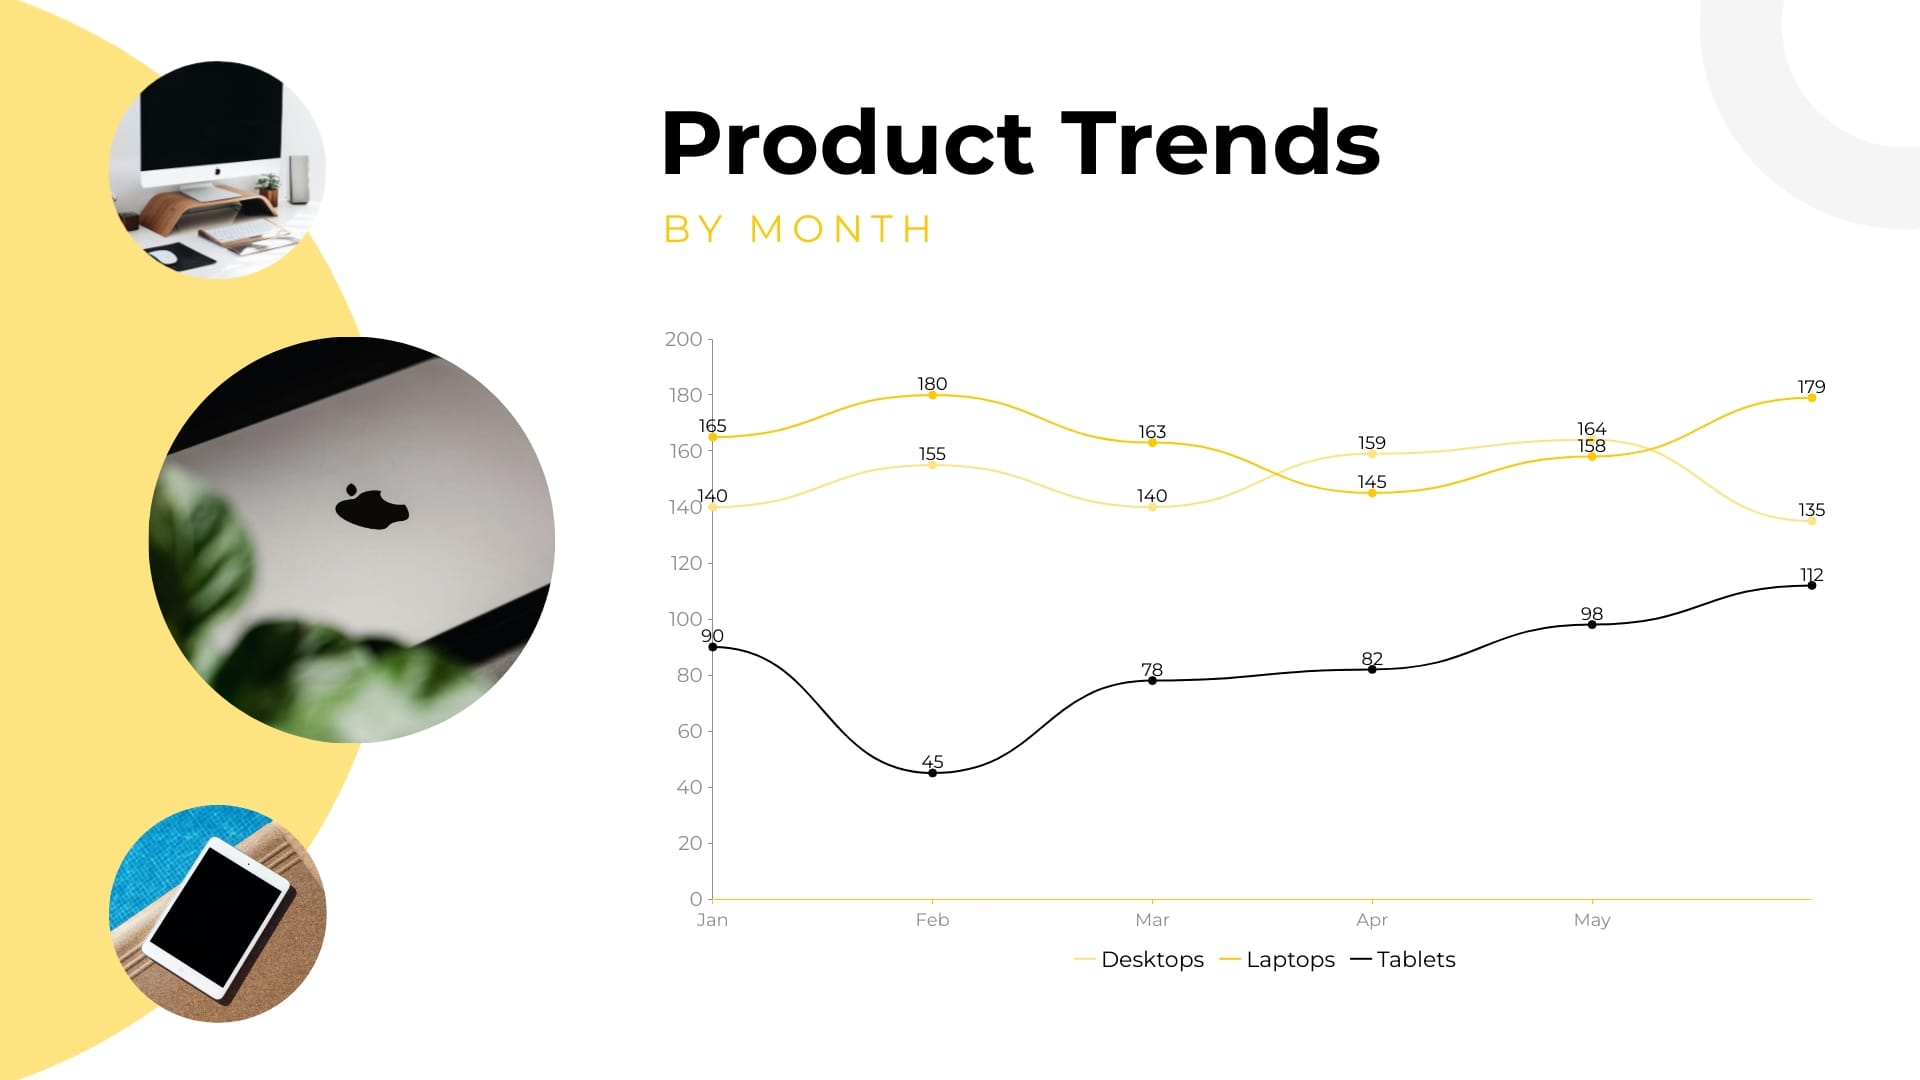
Product Trends Line Graph Modern Template
Product Trends Line Graph Modern Impress your audience with this modern and sleek template for illustrating product trends over time.
Beverage Consumed Line Graph Template
Beverage Consumed Line Graph Monitor beverage consumption trends with this engaging and straightforward line graph template.