Visualize Databases and Systems
with the ER Diagram Maker

It’s free to sign up and easy to use.
Use Visme's ER Diagram Maker to design, document and refine database structures.
Select and customize diagram templates that resonate with your project or industry.
Invite colleagues to collaborate on your ER diagram, enriching your design with collective expertise.
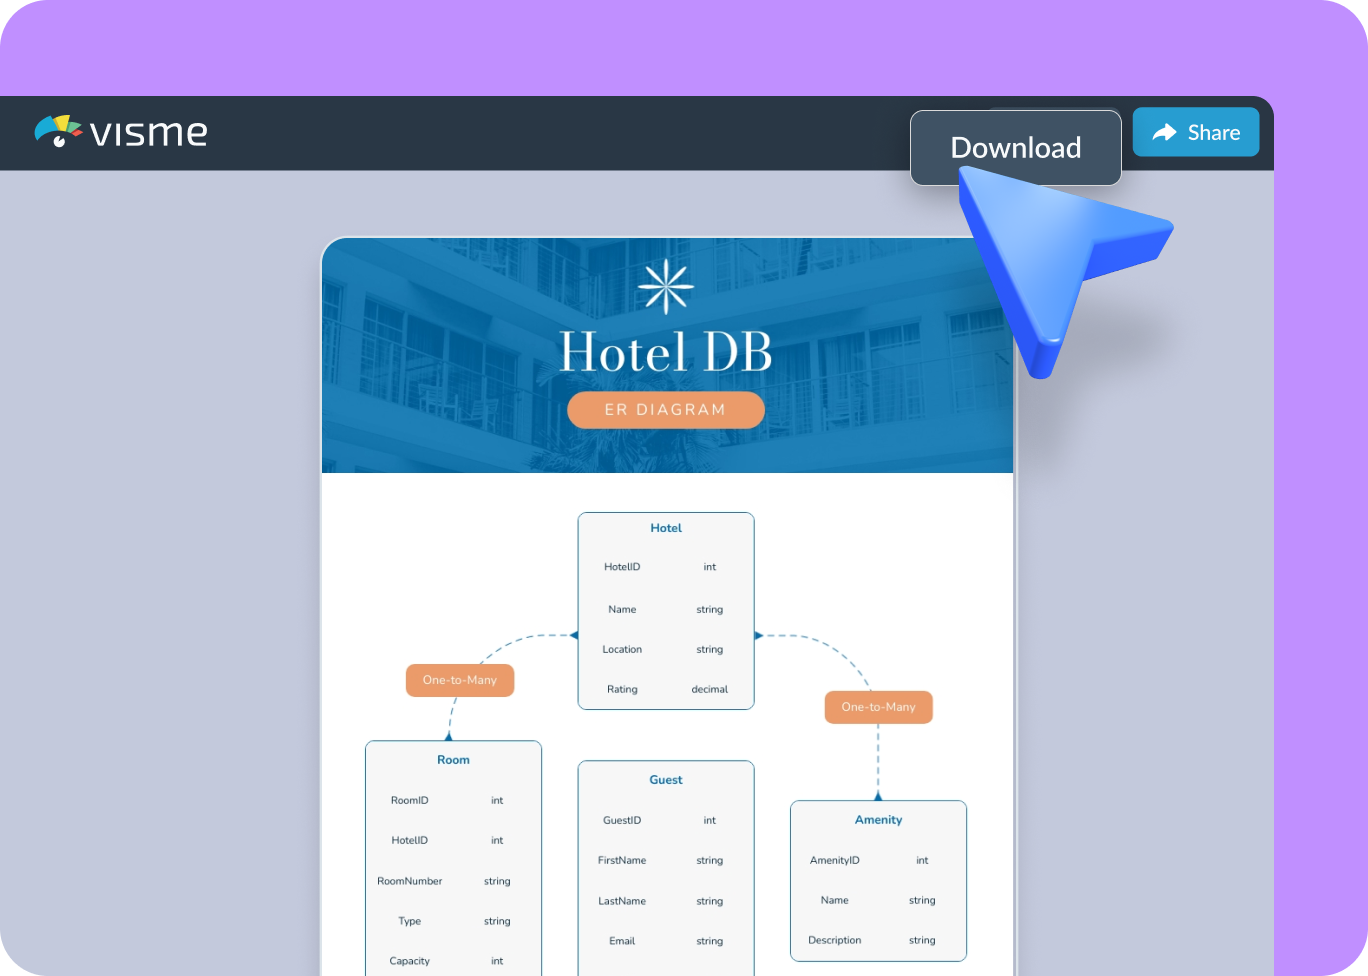
Upgrade to download your ER diagram as a PNG, JPG, PDF or HTML or share it online for instant feedback and collaboration.
The leading visual communication platform empowering 34,300,000 users and top brands.
Easy to edit
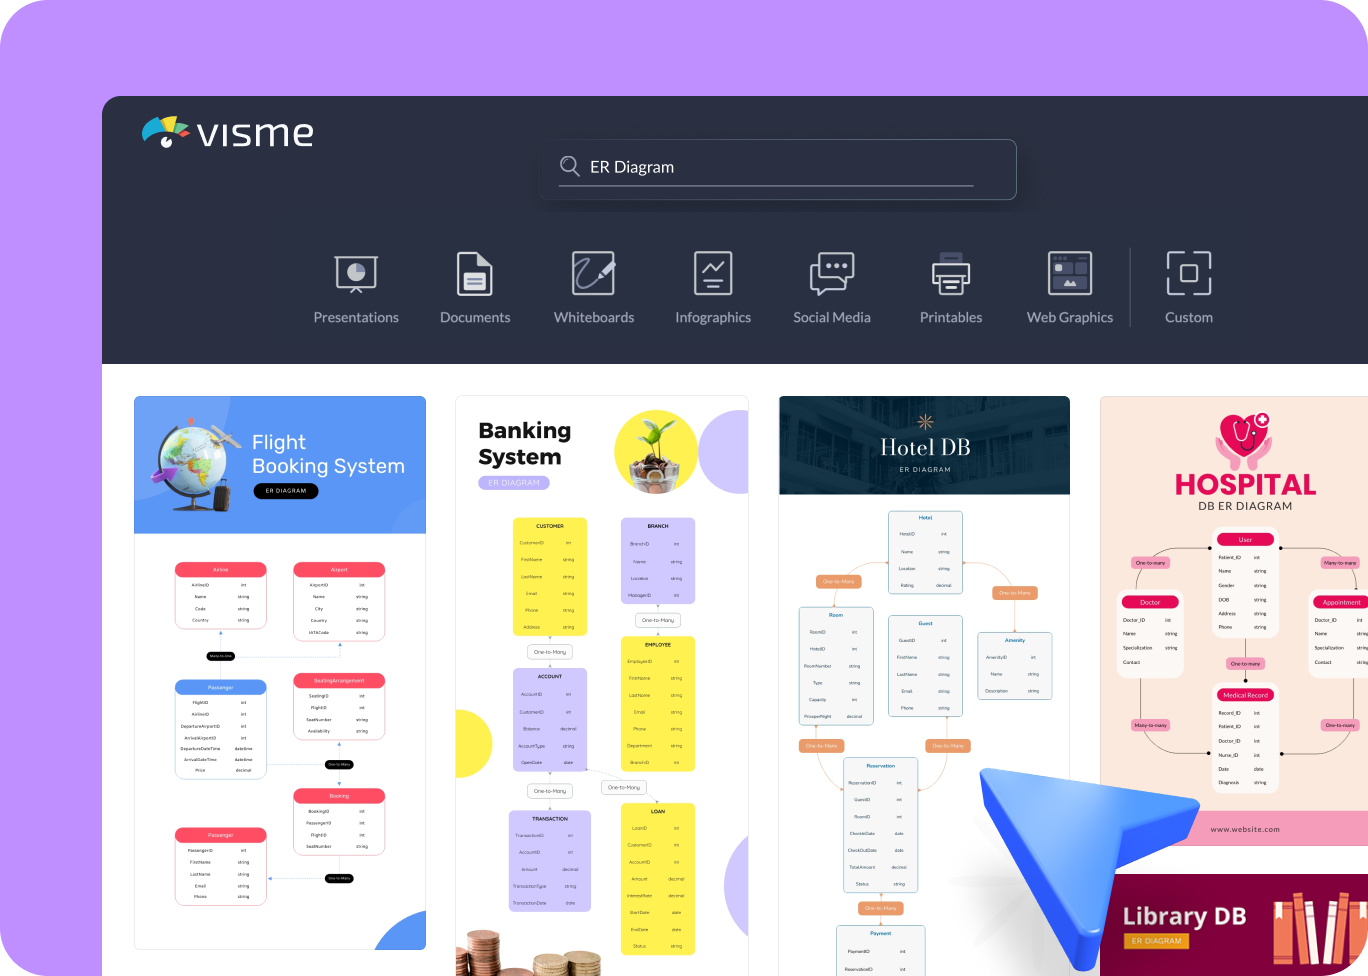
Diagram Templates
Our diagram templates come with various features specifically designed to promote simplicity and efficiency. They are easily customizable, allowing you to modify entities, relationships, and attributes, resulting in a clear visualization of your data model. Choose a template that fits your data structure needs and jump straight into customizing.


ER Diagram Maker Features
Pre-defined Shapes for Your ERD Diagram
Visme’s ER Diagram Maker makes creating detailed and accurate ER diagrams easy. The tool provides a comprehensive library of pre-defined shapes and assets. This simplifies the process of creating and documenting your database design, whether you’re a beginner or an experienced database designer.

Interactivity and Animation Features
Enhance your ER diagrams with Visme’s interactivity and animation features. These tools enable you to incorporate captivating elements into your diagrams, such as clickable buttons revealing more information or subtle animations emphasizing specific relationships or data flows. This not only grabs your audience’s attention but also aids in simplifying complex data relationships.

Real-Time Collaboration
Collaboration is crucial when creating comprehensive and accurate ER diagrams, and Visme’s ER Diagram Maker is an excellent tool for achieving this. Its real-time collaboration feature allows multiple users to work on the same project simultaneously from different locations. Team members can easily share ideas, provide instant feedback, and make live edits, ensuring that the final diagram is a collective effort with diverse insights and expertise.

More Great Features of the ER Diagram Maker
Drag-and-Drop Editor
Easily create detailed ER diagrams with our intuitive drag-and-drop tools; no expertise is required.
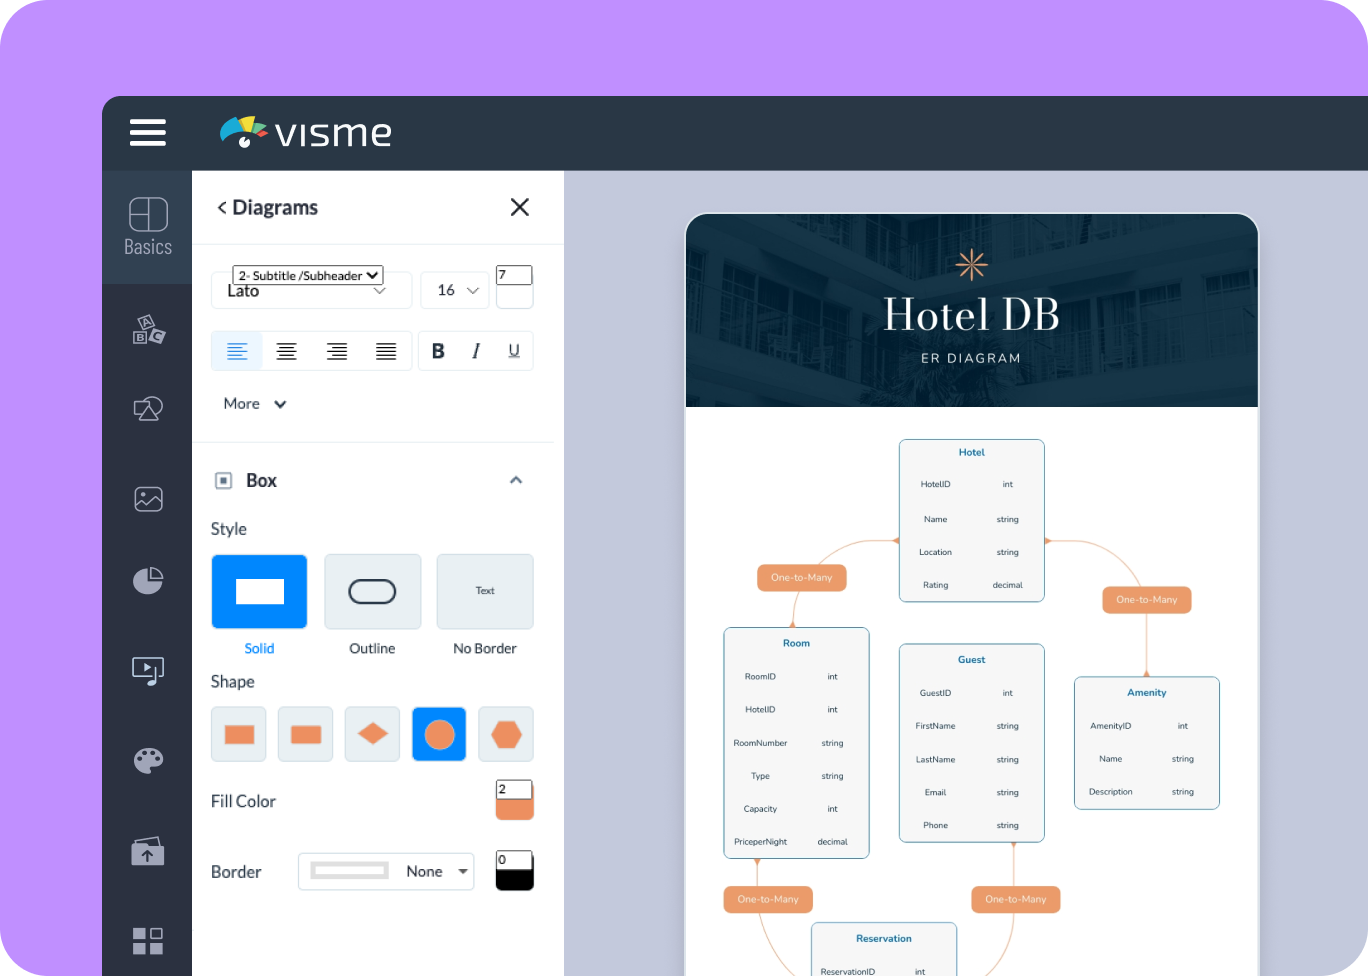
Customizable Boxes
Change the shape, fill color, style and border of boxes in your ER diagrams to match your specific needs.
Custom Color Schemes
Personalize your diagrams with custom color palettes that reflect different database elements.
Pre-made Shapes
Select from structures with solid, outline or no borders with connectable ends.
Extensive Design Assets
Access a rich library of vector icons, illustrations and 3D graphics to enhance your diagrams.
Smart Guides
Dynamic alignment and spacing guides to ensure your ER diagram elements are precisely positioned for a professional look.
Real-Time Collaboration
Work together on your ER diagrams in real-time, allowing instant edits and discussions.
Interactive Elements
Make your ER diagrams interactive with clickable areas, hover effects and more for an engaging experience.
Organized Object List
Manage the elements in your ER diagrams effortlessly with a comprehensive object list.
Diverse Charts and Graphs
Choose from over 25 chart and graph types to add detailed data visualizations to your diagrams.

Learn More
What is an ER Diagram?
An ER diagram, short for Entity-Relationship diagram, is a visual tool for mapping and displaying the connections between different elements in a database. It shows entities (which can be thought of as things or objects) and the relationships (the links) between them. This kind of diagram is beneficial when someone is building or managing a database and wants to see how the parts fit together.
For example, consider a university system: students, courses, and professors are entities. An ER diagram shows how students enroll in courses taught by professors, establishing a clear structure of relationships.

Create and Organize Your Databases with Visme's ER Diagram Maker.
With Visme's ER Diagram Maker, you can draw out your database ideas and figure out how things connect, helping you spot issues before they happen. Customize your diagram using different colors, shapes and lines to make sure your data is easy to follow and makes sense. No matter how simple or complex your database needs to be, Visme makes it simple to create a visual representation of your data.
Everything you need + more
More Than Just an ER Diagram Maker

Make it engaging
Interactivity
Create interactive reports with popup and rollover effects that allow your viewer to interact with your design to learn more information.

Visualize your data
Charts & Graphs
Showcase sales, marketing, website data and more in your reports with Visme’s easy-to-use charts, graphs and other data visualization tools.

Beautify your content
Video & Animation
Choose from over a million stock photos, icons, illustrations, characters, lines, shapes and more to create a completely unique report.
How it works
How to Create an ER Diagram in 5 Easy Steps
Creating ER diagrams doesn't have to be complicated, especially with Visme. It simplifies visualizing your database structure, making it an excellent tool for database design and analysis. You can choose from a variety of templates, methodically organize your database components and customize the visual appearance to fit the specific needs of your project.
Follow these simple steps to build your ER diagram online using Visme:


- Sign in to your Visme account and click “Create New” to initiate a new project from your dashboard.
- Enter “Diagram” in the search bar and pick the suitable category from the options to explore the templates available.
- Select the diagram template that matches your project needs and insert your entities and their relationships.
- Tailor your diagram by adjusting the colors, fonts, and lines to align with your branding or project theme.
- When ready, upgrade to download as a PDF, JPG, or PNG file, share directly with a link or embed it into your website.
Quick tips
Make Your ER Diagrams Clearer with Visme
Access a wide range of connector types and styles to depict the various relationships between entities.
Include a descriptive title and, if needed, a concise subtitle to give context to your ER diagram.
Employ grid lines within the Visme editor to ensure your ER diagram is neatly organized and professionally presented.
Take advantage of Visme's version history feature to track changes to your ER diagram over time.
Use subtle animations in presentations to draw attention to key parts of your ER diagram.
Break down complex entities into simpler components for a more detailed examination.
Attach links to additional resources, data definitions, or external databases to make your ER diagram a comprehensive information hub.
Secure your ER diagrams with privacy settings and control who can view or edit them within your organization or client base.
Frequently Asked Questions (FAQs)
Here are some options to create your ER diagram:
- Manual Drawing: Using pen and paper or basic drawing software.
- Specialized Tools: Dedicated ER diagram software options exist.
- Online ER Diagram Makers: User-friendly online tools like Visme's ER Diagram Maker offer templates, customization and easy collaboration.
While various ER diagram tools are available, Visme stands out as a top choice. Its intuitive interface, pre-built templates, extensive customization options, and real-time collaboration features make it exceptionally user-friendly and ideal for team projects. If you're looking for a powerful yet easy-to-use ER diagram tool, Visme is a great option.
Yes! Several online tools like Visme allow you to create, edit, and share ER diagrams directly in your browser, offering convenience and collaboration features.
Visme offers a free plan to create basic ER diagrams. To access advanced features, including extensive export and download options, you must upgrade to a paid plan.
Yes! Many resources offer ER diagram examples:
- Visme: Provides templates for common types of diagrams.
- Online Resources: Websites dedicated to database design often have example libraries.
- Textbooks: Database design textbooks often include illustrative examples.
Key components of an ER diagram include:
- Entities: Represented by rectangles (e.g., Customer, Product).
- Attributes: Characteristics of entities, shown as ovals (e.g., Customer Name).
- Relationships: Connections between diamond-shaped entities (e.g., Customer Places Order).
- Cardinalities: Specify the number of instances in a relationship (one-to-one, one-to-many, etc.).
ER diagrams are a data model focused on entities and relationships. Data models can be more broad, encompassing different aspects of data management.