Organize Your Data Easily
with Custom Tables
It’s free to sign up and easy to use.
Use Visme’s data table creator to structure and present your data in a clear, organized way.
Customize table colors, fonts and styles to match your brand or project theme.
Add interactive elements, such as links and tooltips, to make your data tables more engaging.
Upgrade to export your tables in various formats, including PNG, JPG and PDF, or share them online.
The leading visual communication platform empowering 34,300,000 users and top brands.
Easy to edit
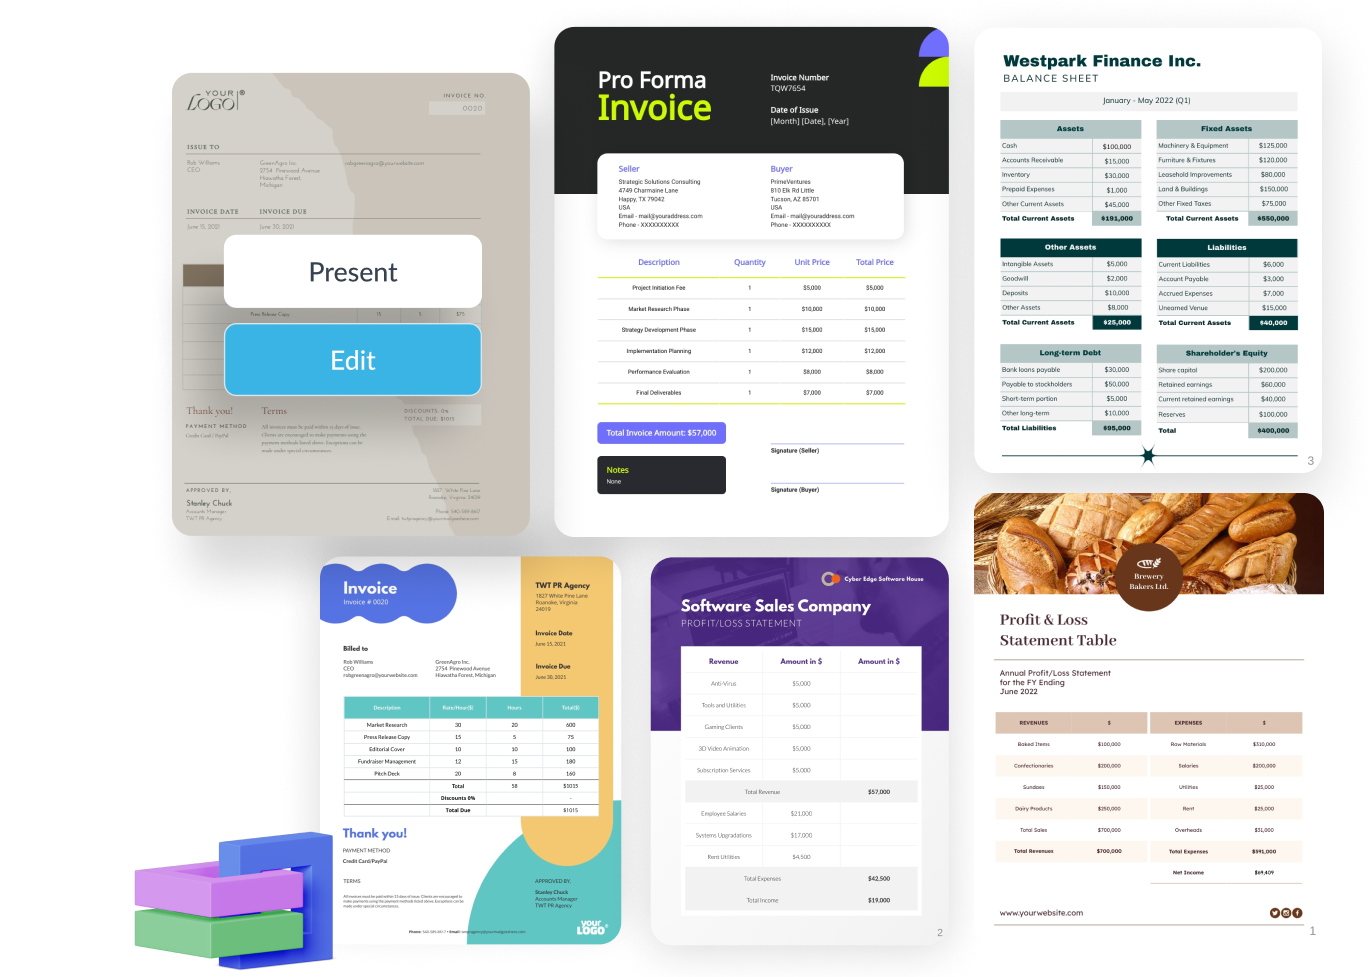
Data Table Templates for Any Need
Visme’s data table templates help you create a data table online in just a few clicks. Whether you need to build a financial report, sales comparison or structured dataset, our templates make data visualization effortless. Each template is fully customizable, allowing you to adjust fonts, colors, borders and cell alignment to match your needs. You can also incorporate icons, charts and interactive elements for a more engaging data presentation.


Data Table Maker Features
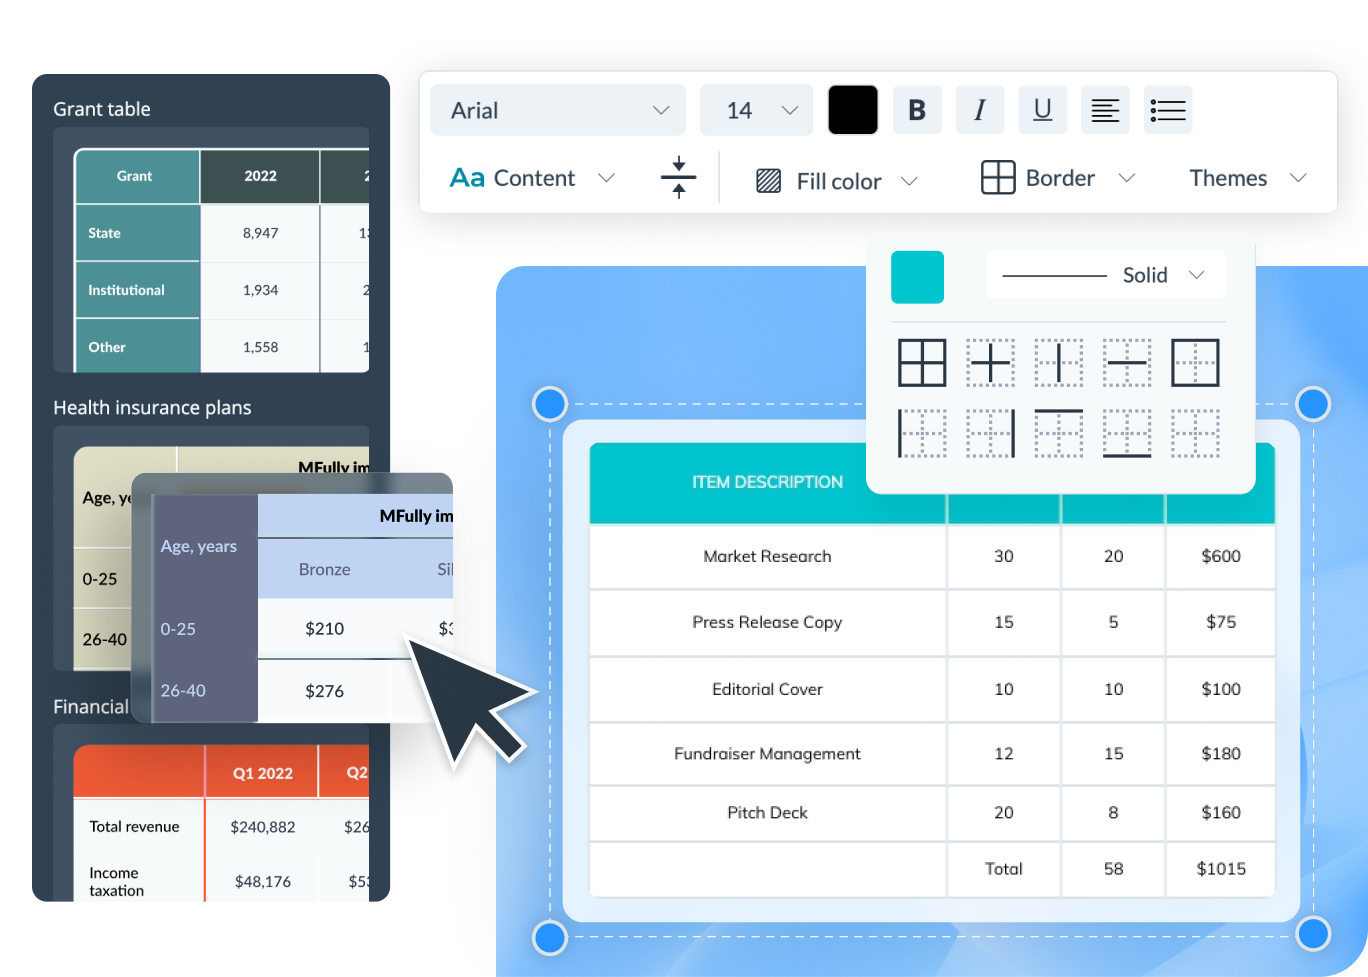
Easy Customization for Clear Data Presentation
Visme’s data table creator allows you to customize every part of your table to fit your needs. You can adjust column widths, modify fonts, change colors and add borders to make your data visually appealing. Whether you’re designing a financial report, project summary or business dashboard, Visme makes it easy to create a data table that is both professional and easy to read.
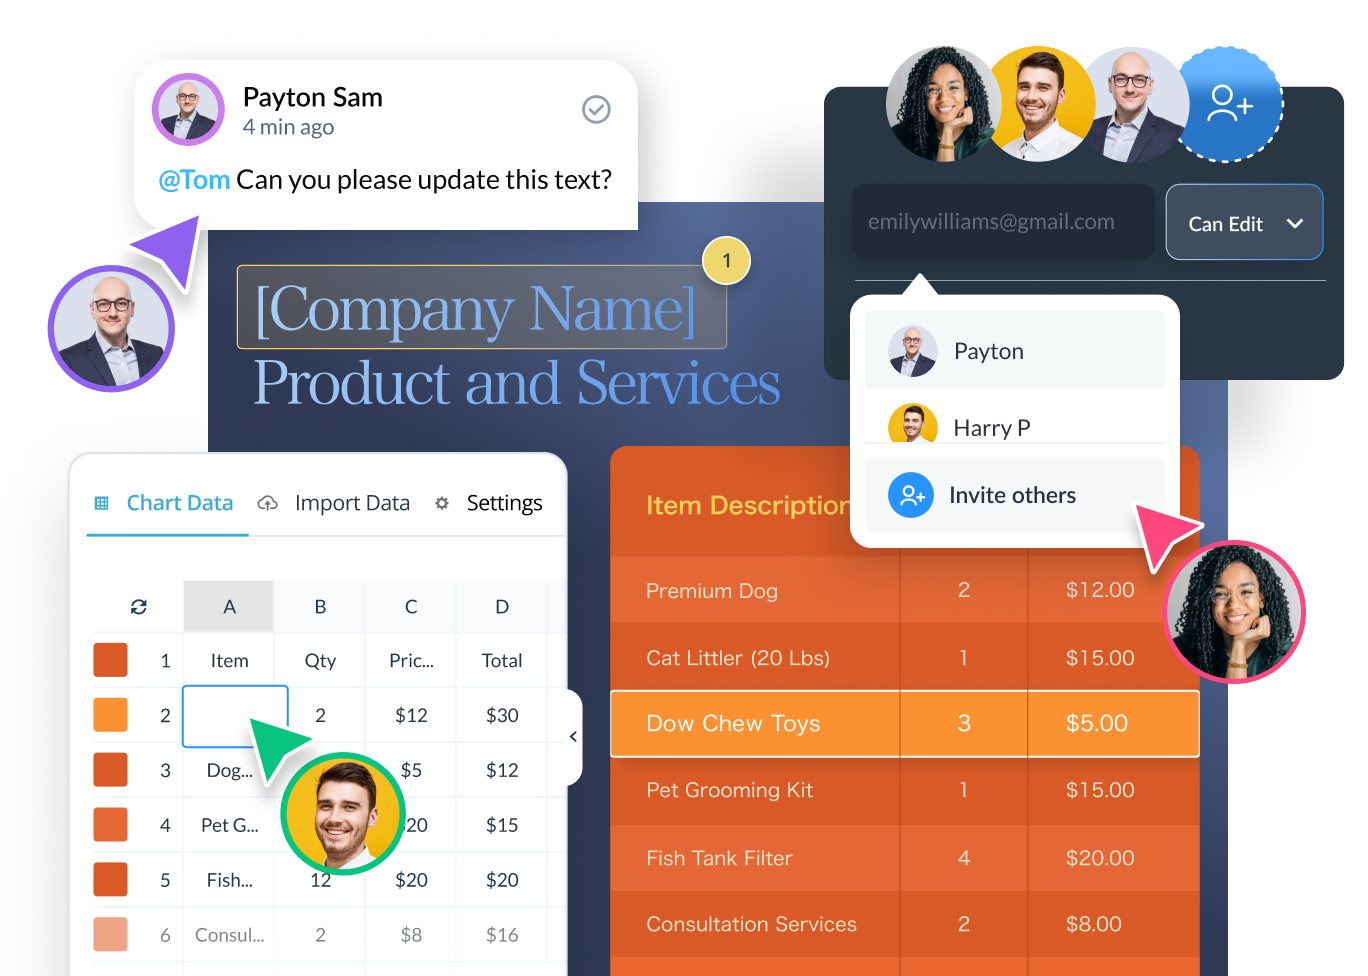
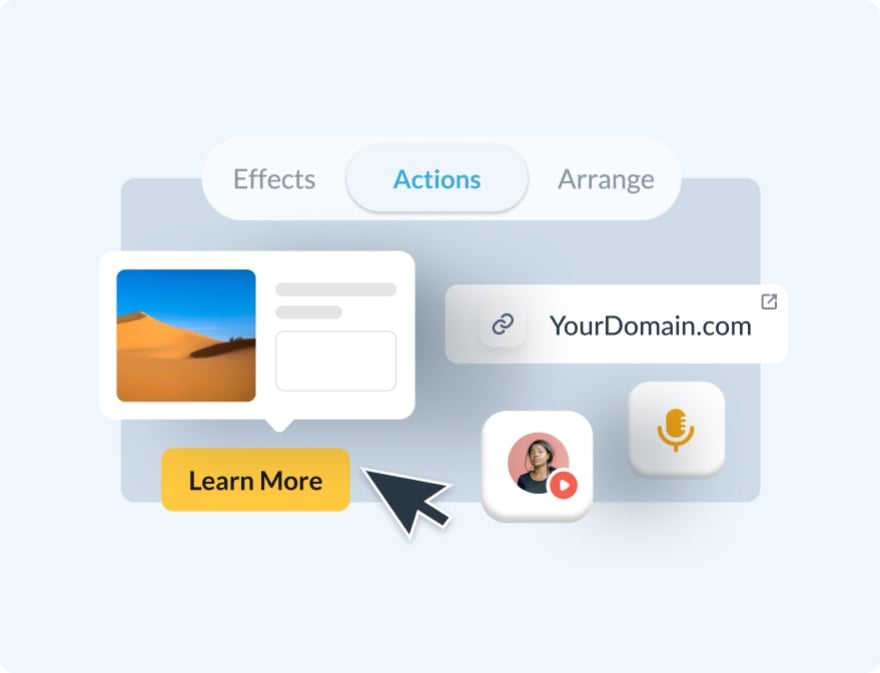
Interactive and Engaging Data Tables
With Visme, you can create interactive tables by adding hover effects, clickable elements and live data updates. This turns your tables into more than just static visuals, making them perfect for presentations, infographics and dashboards. Whether you are sharing research insights or marketing statistics, Visme helps you turn raw numbers into an interactive experience.
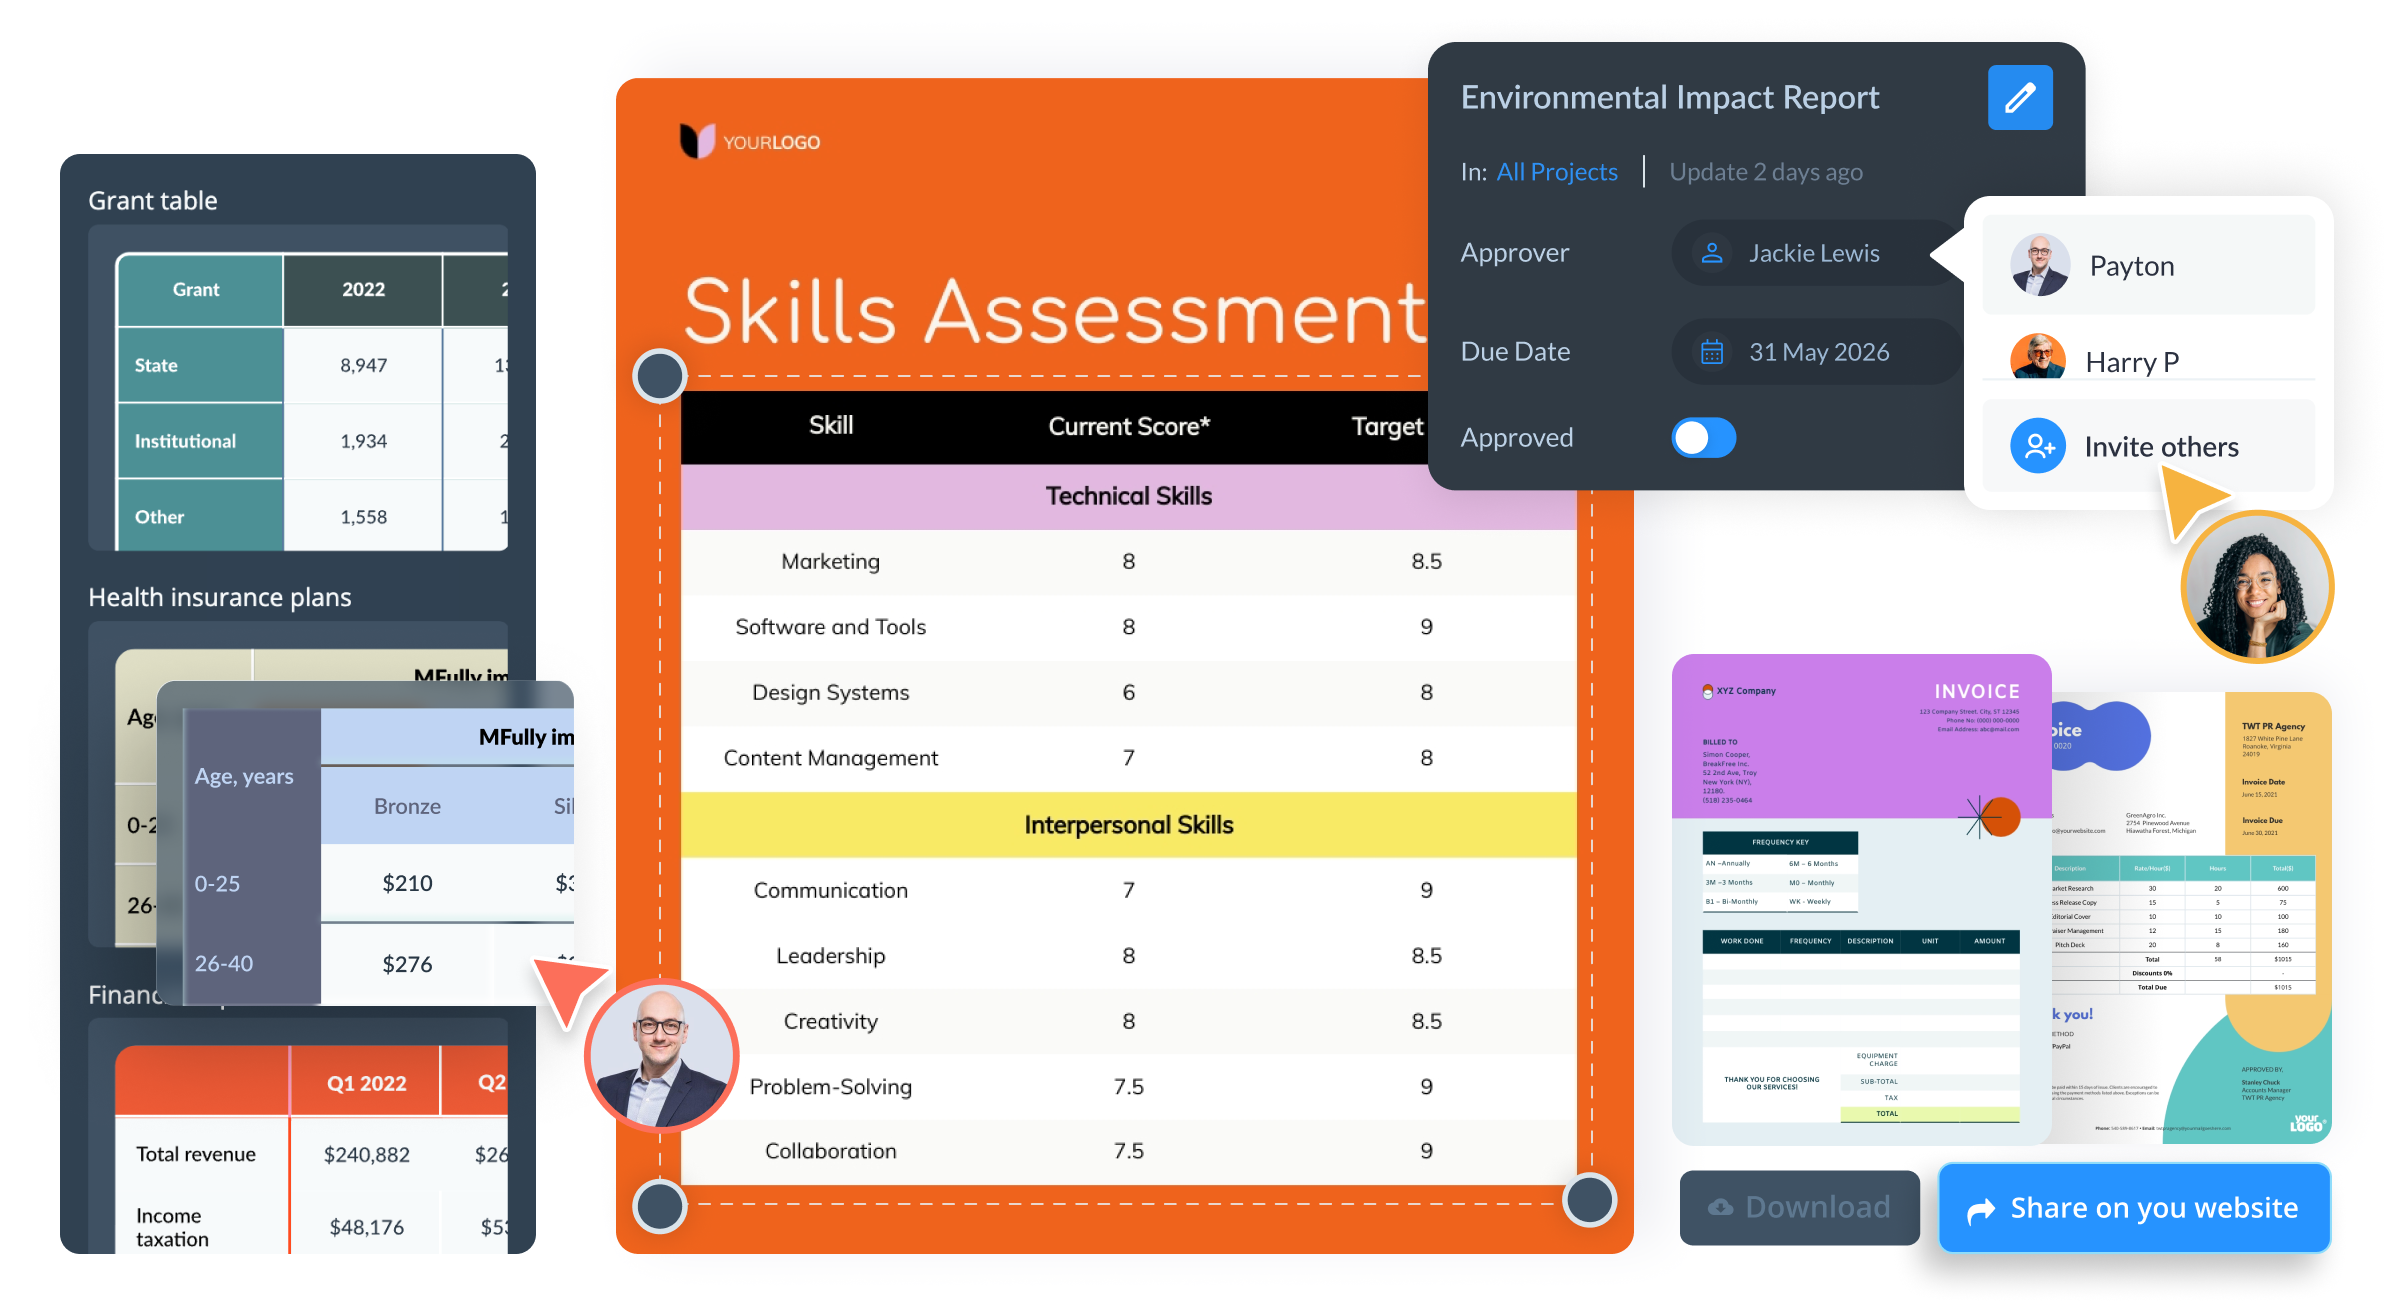
Collaborative Design and Workflow Management
Use Visme’s collaborative design features to enhance your teamwork. You can invite team members via email or a shareable link to comment, annotate and live-edit tables together. Additionally, Visme’s workflow management features help you assign roles, track progress, and manage deadlines. With an administrator view, you get a comprehensive look at your design process, ensuring smooth collaboration and timely completion of your data tables.
More Great Features
of the Data Table Maker
Drag-and-Drop Editor
Add rows, columns, and data effortlessly using Visme's intuitive drag-and-drop editor. No technical skills are required!
Customizable Cells
Personalize each cell by adjusting the font, color, borders and even adding icons or graphics.
Data Table Templates
Choose from various data table templates designed for different purposes, from simple lists to complex data sets.
Design Assets
Use design elements like icons, images and 3d graphics to make your data tables easier to understand.
Custom Color Schemes
Apply your brand colors or choose from custom color palettes to highlight key data sets.
Dynamic Fields
Save important data like contact info or financial data, and whenever you insert the dynamic fields to your projects, they display the saved information.
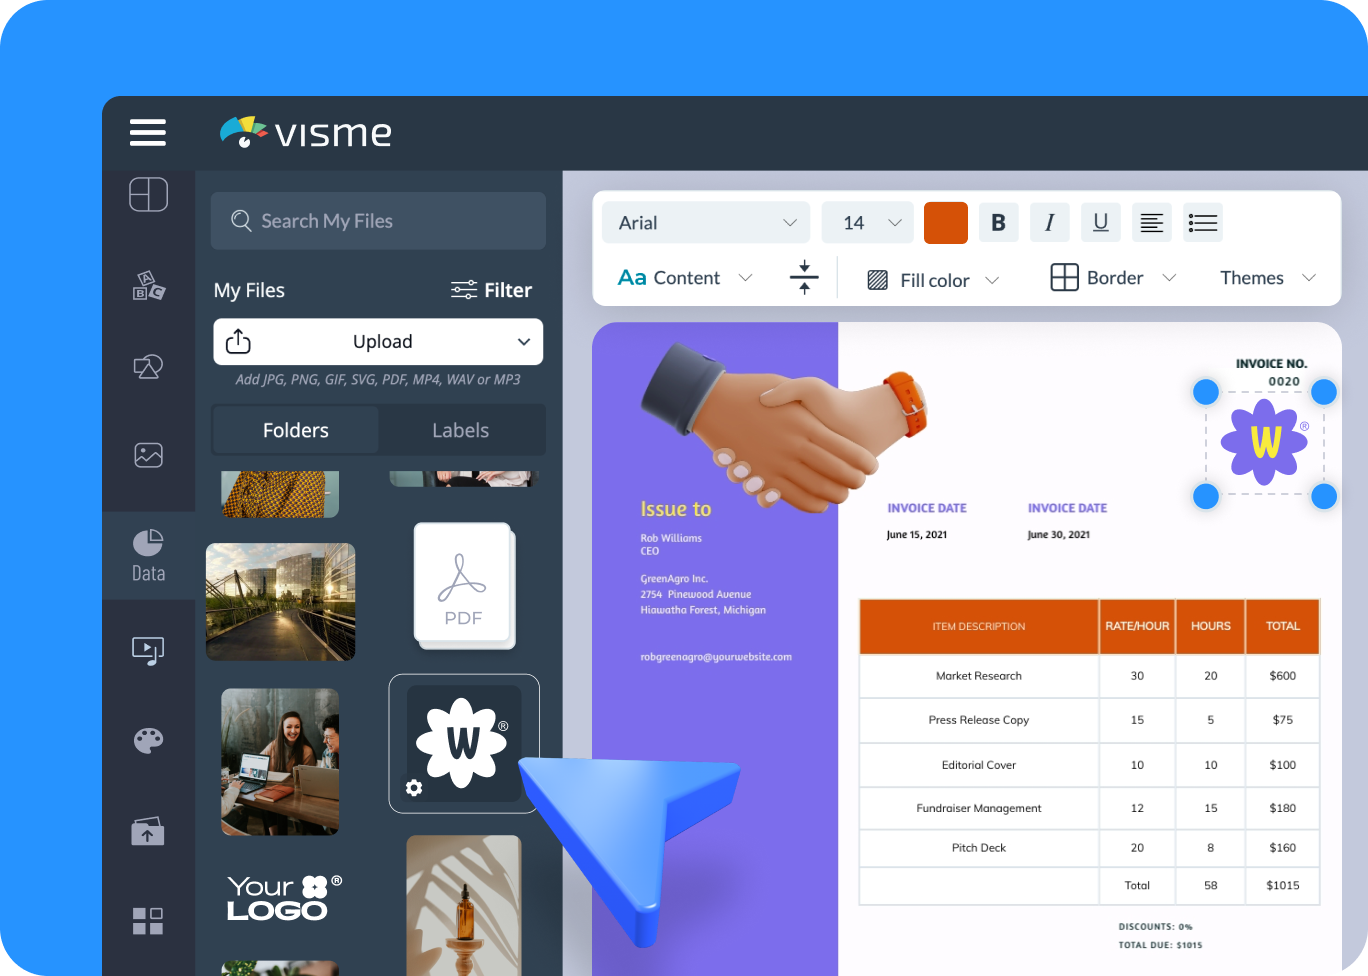
Brand Design Tool
Paste your company URL, and Visme's brand wizard will extract your brand colors, brand fonts and company logo to apply to your design.
Real-Time Collaboration
Use Visme's collaborative design features to invite others to view, comment on, and edit your data table together.
Interactive Data Tables
Make your data tables more engaging by adding interactive features like clickable rows, hover effects and expandable sections.
AI Resize Tool
Visme's AI resize tool helps you resize the data table to fit any screen size you want.
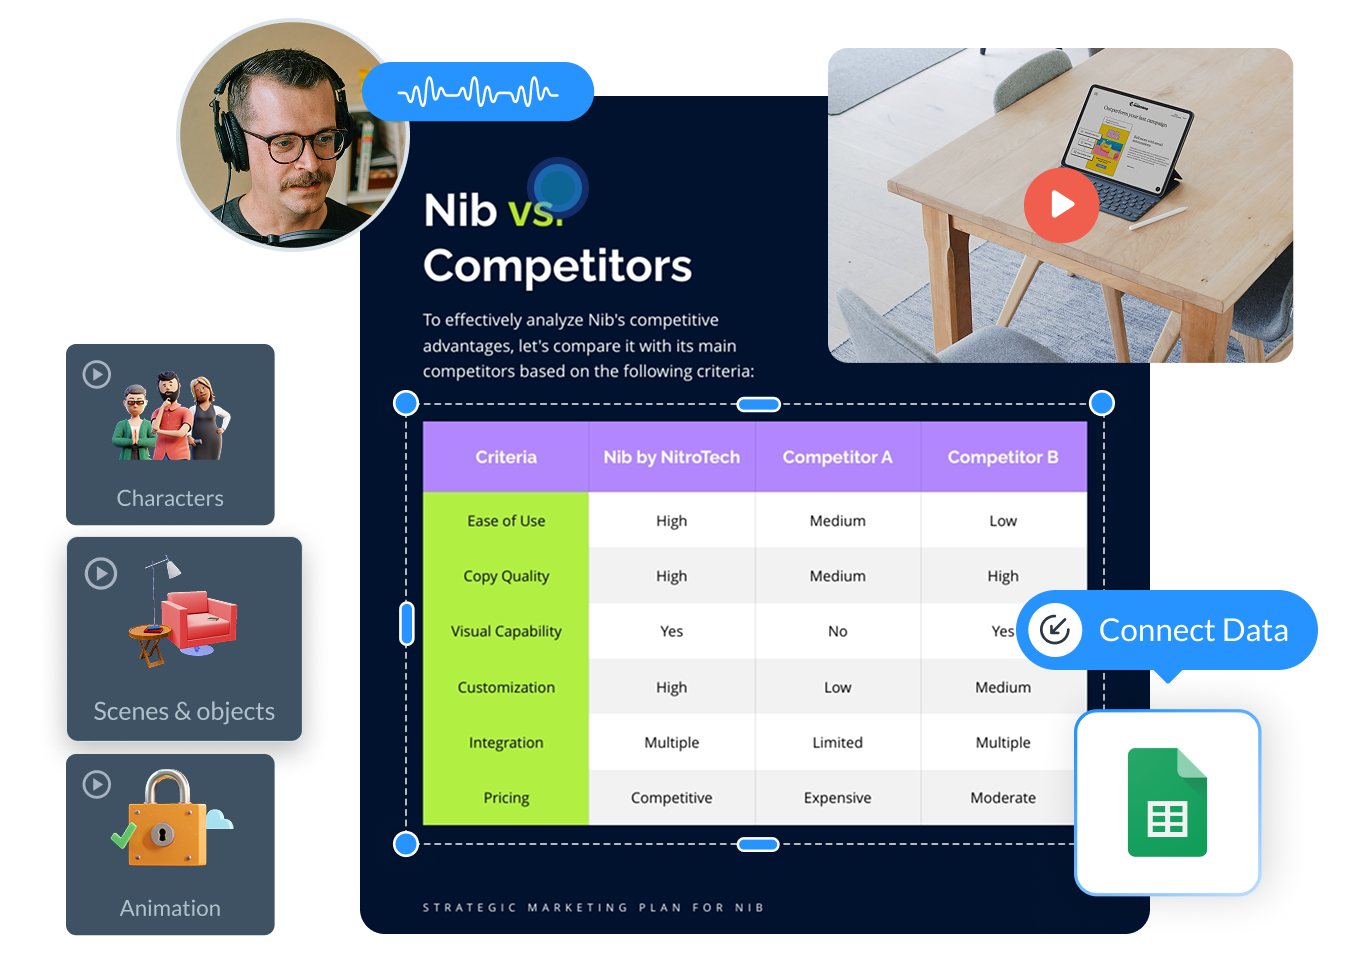
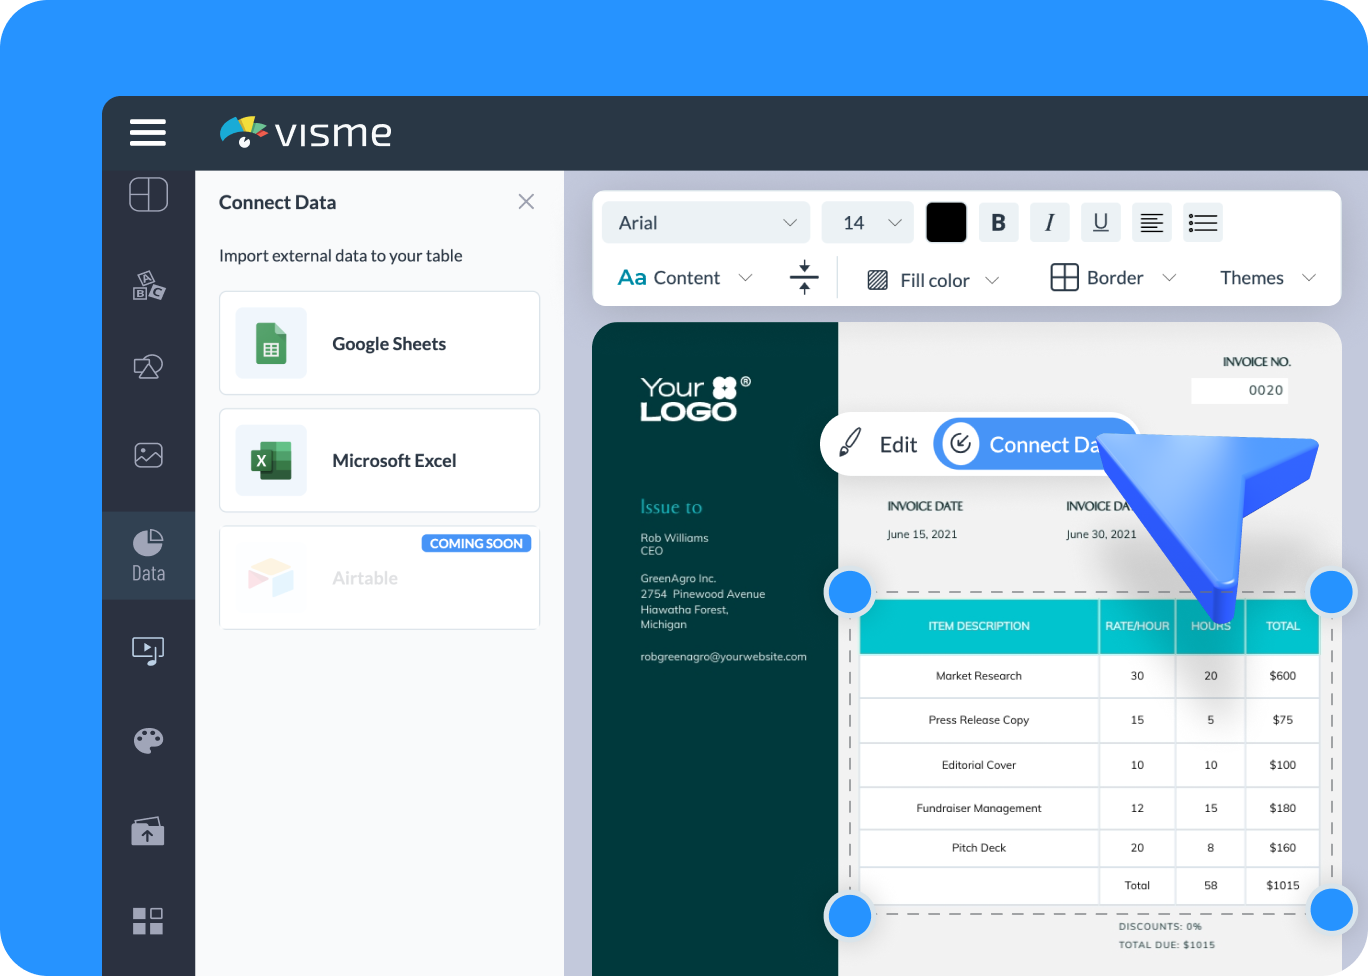
Real-Time Data Sync
Connect your data tables with data sources like Google Sheets and MS Excel to always display the most updated data and avoid manual data entry.
Lockable Rows and Columns
Freeze header rows and columns so they stay visible while you scroll through large datasets.

Learn More
What is a Data Table?
A data table is a simple layout that organizes data in rows and columns. Each row shows a single entry, and each column represents a type of data. This setup makes it easy to see trends and connections between different pieces of information, which is helpful for analysis and decision-making.
Data tables are important for managing and analyzing various types of data. Whether you’re tracking business statistics or organizing research results, a well-made data table provides the clarity needed to make informed choices.
Create and Customize Data Tables Easily with Visme's Data Table Maker
Visme’s data table maker allows you to create accurate and visually appealing data tables. Input your data manually or import it from an Excel or Google spreadsheet. Customize your table by adjusting fonts, colors and borders to match your needs. Use our data table templates to save time and focus on organizing your data in the most effective way.
Everything you need + more
More Than Just a Data Table Maker
Make it engaging
Interactivity
Create interactive reports with popup and rollover effects that allow your viewer to interact with your design to learn more information.

Visualize your data
Charts & Graphs
Showcase sales, marketing, website data and more in your reports with Visme’s easy-to-use charts, graphs and other data visualization tools.

Beautify your content
Video & Animation
Choose from over a million stock photos, icons, illustrations, characters, lines, shapes and more to create a completely unique report.
How it works
How to Create a Data Table in 5 Easy Steps
Creating data tables with Visme is easy and customizable, making it perfect for organizing and displaying your data. Whether you're building a simple table for an internal report or a complex one for a presentation, Visme's data table maker helps you generate clear, well-structured tables that are easy to personalize and update.
Let's take a look at how you can create your own data table:
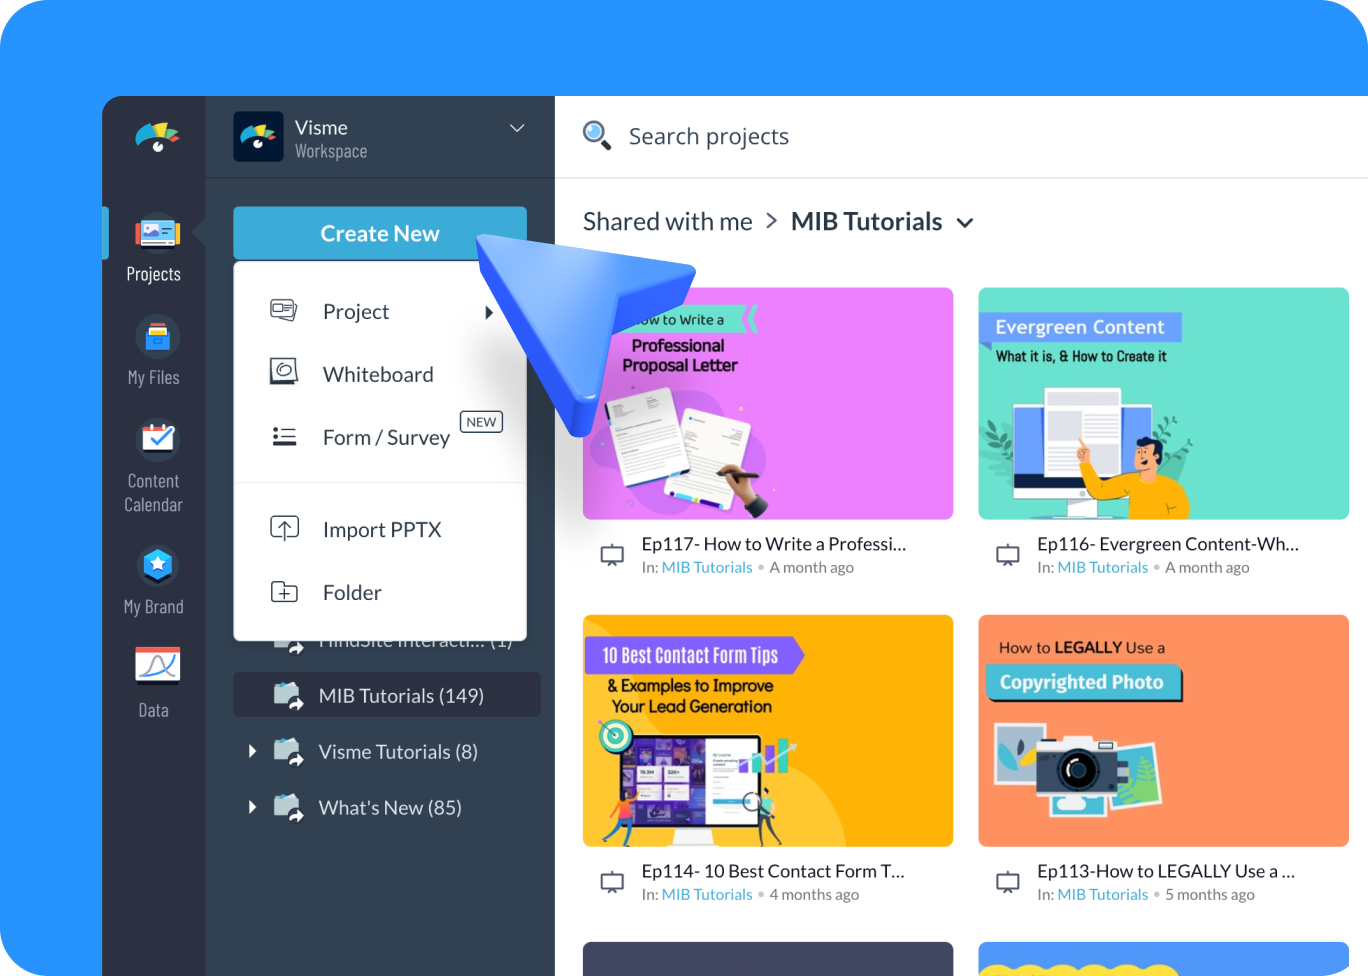
- Sign in to your Visme account and click on “Create New” to start a new project.
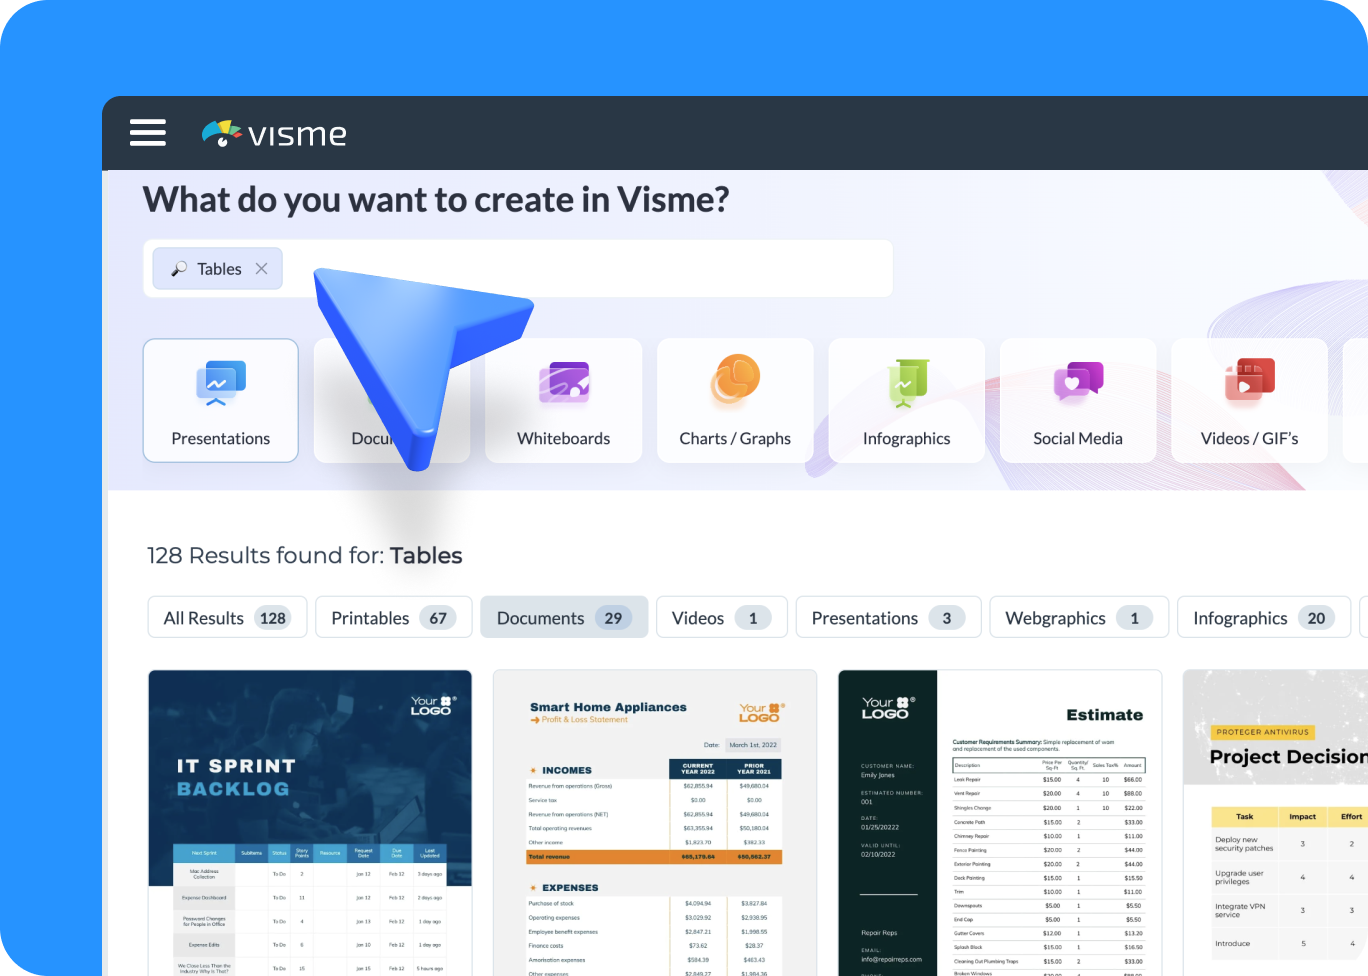
- Type “Table” in the search bar and choose from a variety of table templates based on your project needs.
- Select the template that best fits your data and start adding your rows, columns, and data points.
- Customize your table by adjusting the colors, fonts and borders to match your brand or project style.
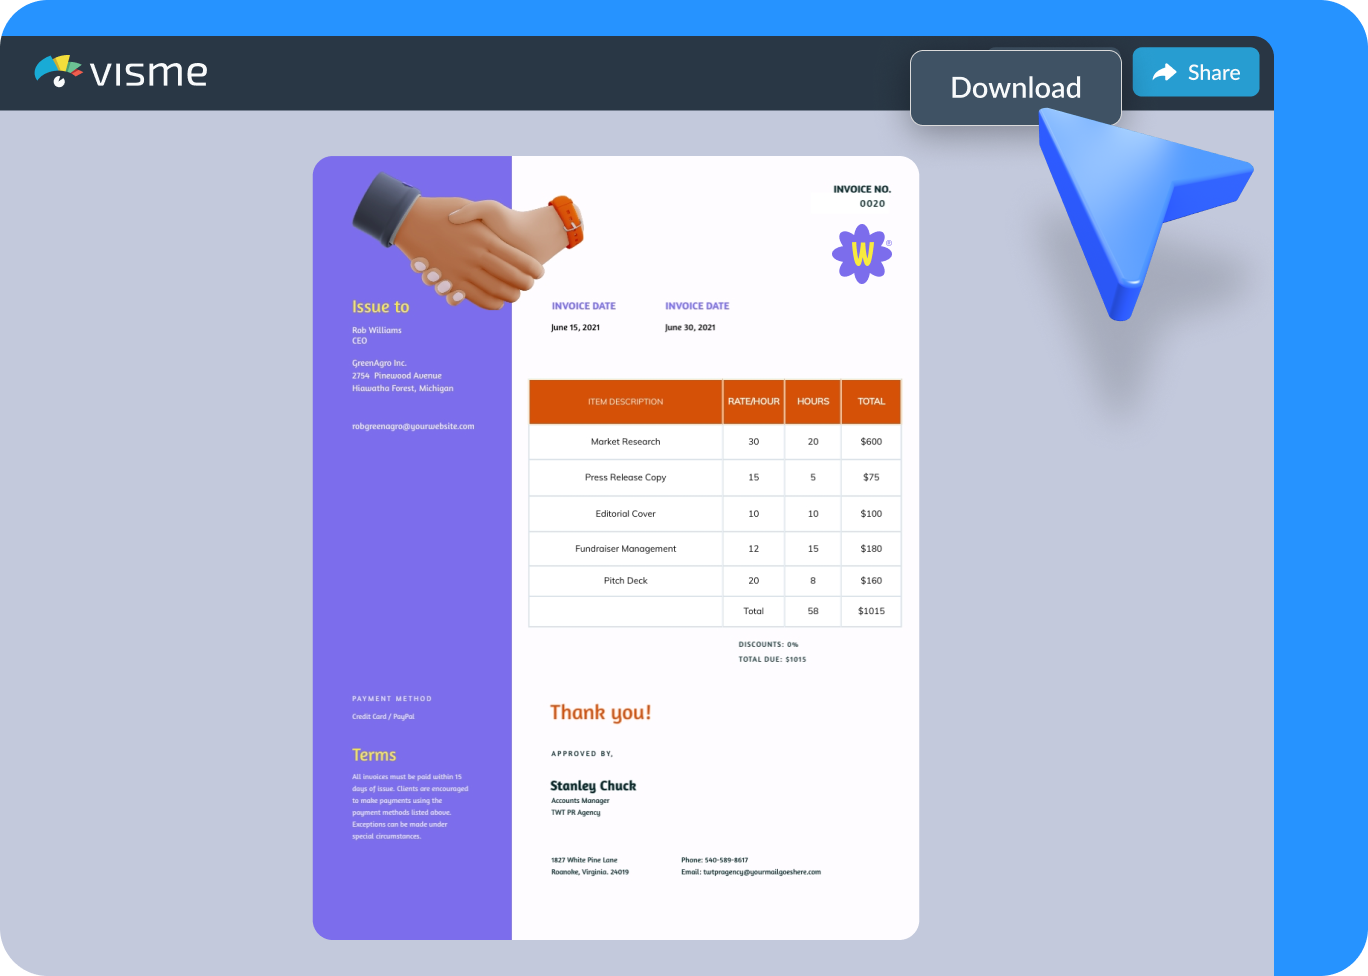
- Once you’re done, upgrade to save your table as a PDF, JPG or PNG file, share it directly via a link, or embed it onto a website for easy access.
Quick tips
Make Your Data Tables Work Harder for You with Visme
Highlight key data points using bold text or color to make important information stand out.
Personalize the table’s style and colors to match your brand and make it more visually appealing.
Make your table interactive with hover effects or clickable links to engage your audience more.
Keep your table simple by displaying only the most important data to make it easy to read.
Ensure your data table is mobile-friendly to improve accessibility and SEO performance across devices.
Add tooltips or notes to provide context and explanations for complex data points within the table.
Update your data table regularly to keep it relevant and improve its search engine ranking.
Use data visualization widgets like graphs to help users understand complex data at a glance.
Frequently Asked Questions (FAQs)
A data table maker is a tool that allows you to create and customize tables to organize data visually.
You can create a data table online with Visme by selecting a template, adding data and customizing it to your needs. It’s quick and easy.
Yes, Visme offers a free data table maker. Upgrade to a premium plan for more advanced features and download options.
Yes, Visme’s data table maker allows you to add interactivity, such as clickable elements and hover effects, to make your data tables more engaging.
Yes. Visme’s drag-and-drop interface makes it simple to edit and customize your data table without requiring any design experience.
Yes. Visme lets multiple users work on the same data table at the same time to streamine the collaboration process.