Get Your Team Aligned
with RACI Charts
It’s free to sign up and easy to use.
Create detailed RACI charts with Visme to streamline project roles and responsibilities.
Choose from versatile RACI chart templates in Visme and customize them effortlessly using the drag-and-drop editor.
Share your RACI charts with project stakeholders in Visme to foster effective team collaboration and alignment.
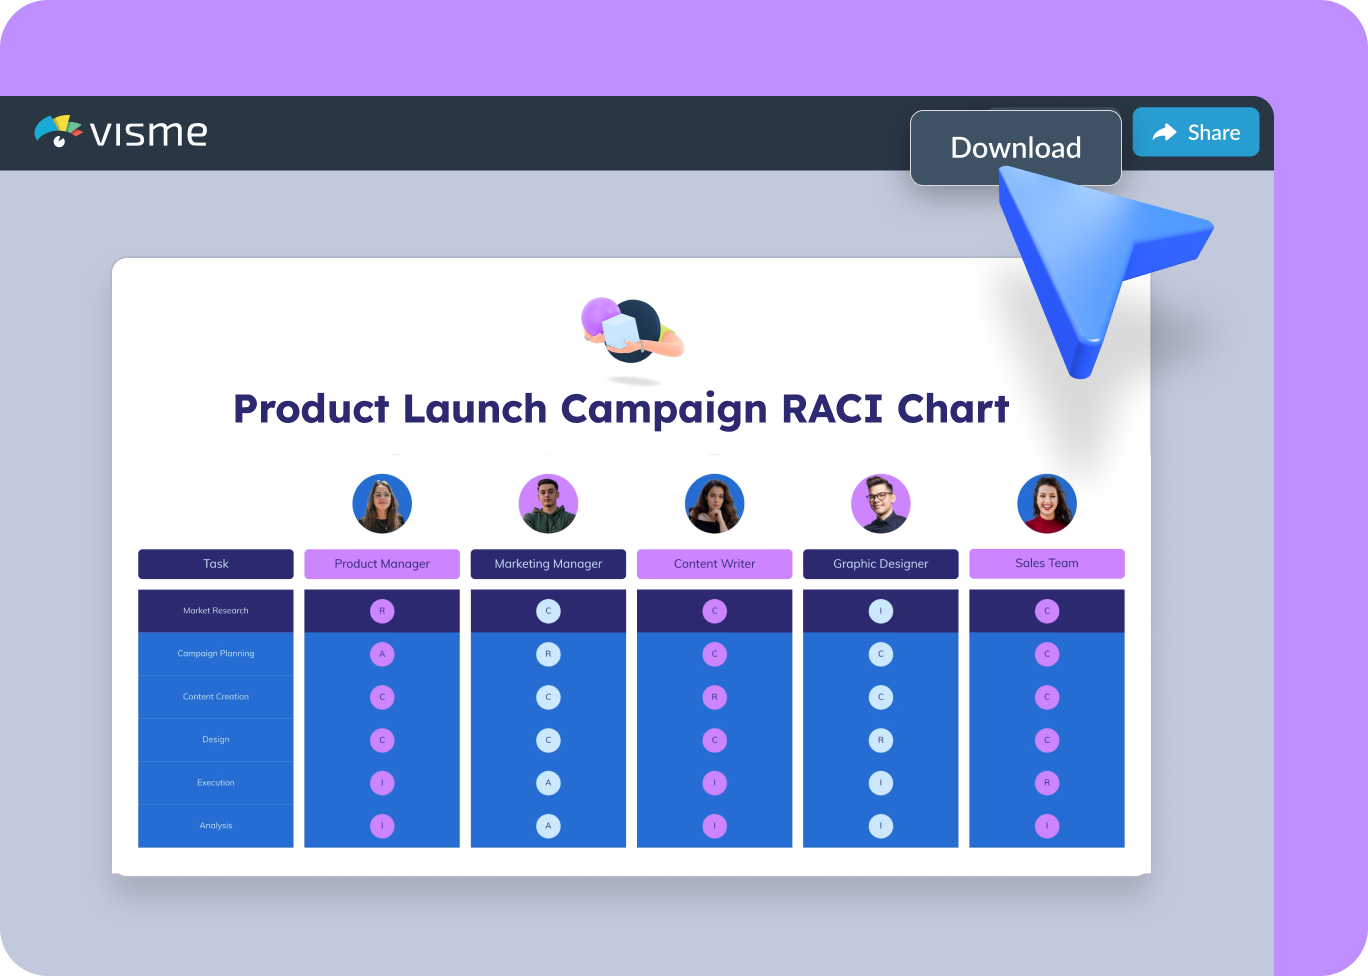
Upgrade to download your RACI chart as PNG, JPG or PDF or share it online with a public or private link.
The leading visual communication platform empowering 34,300,000 users and top brands.
Easy to edit
RACI Chart
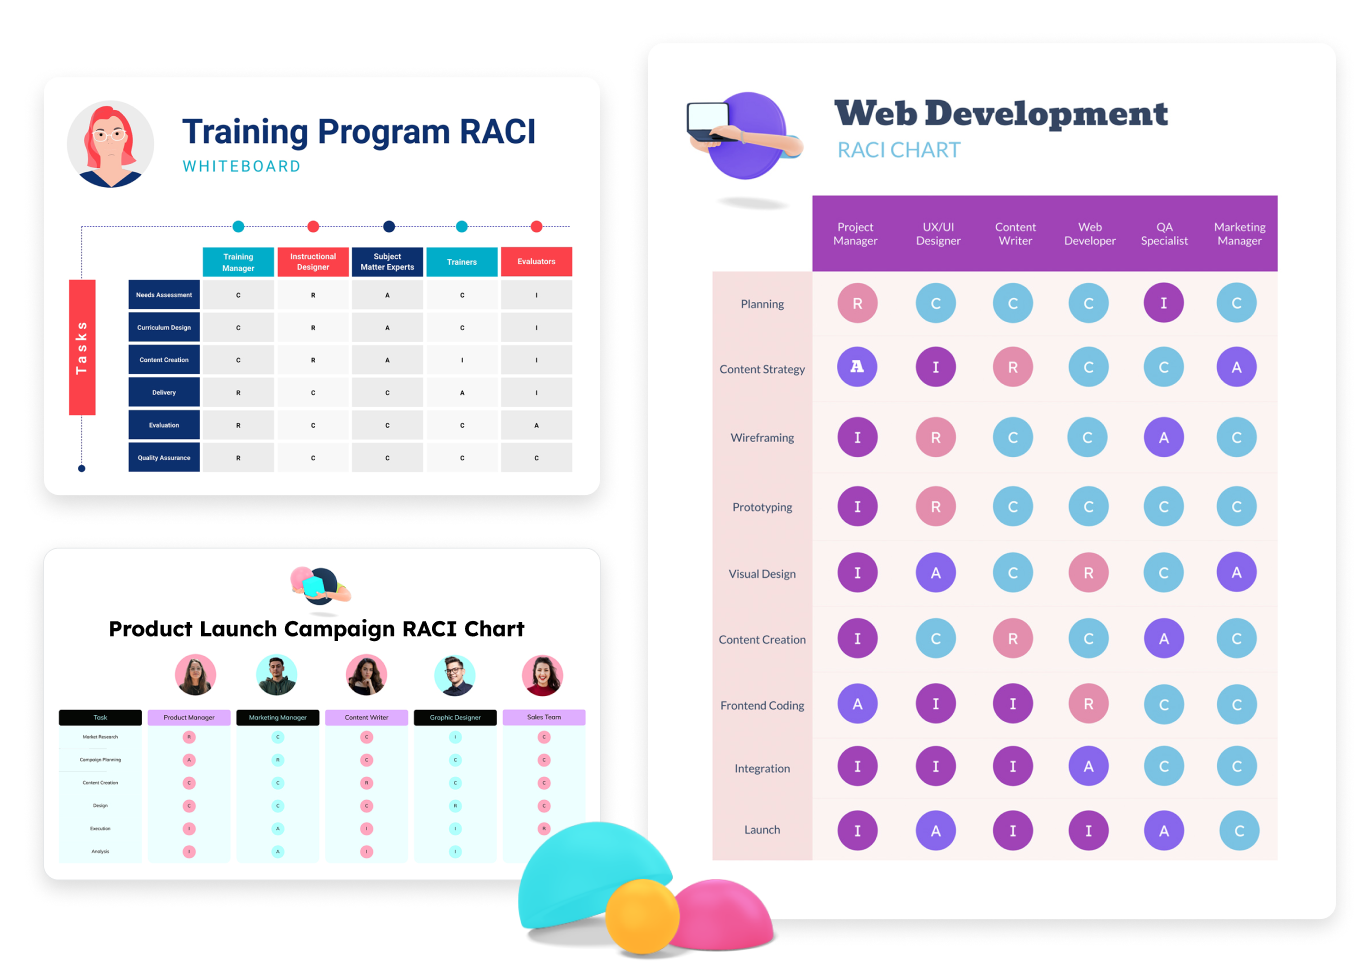
Templates
Kick off your project on the right foot with customizable RACI chart templates from Visme. Whether you're managing a traditional project or navigating agile methodologies, select a template that fits your scenario. Use the intuitive tools to adjust roles, responsibilities, and deliverables and highlight the key contributors at each stage of your project.


RACI Chart Features
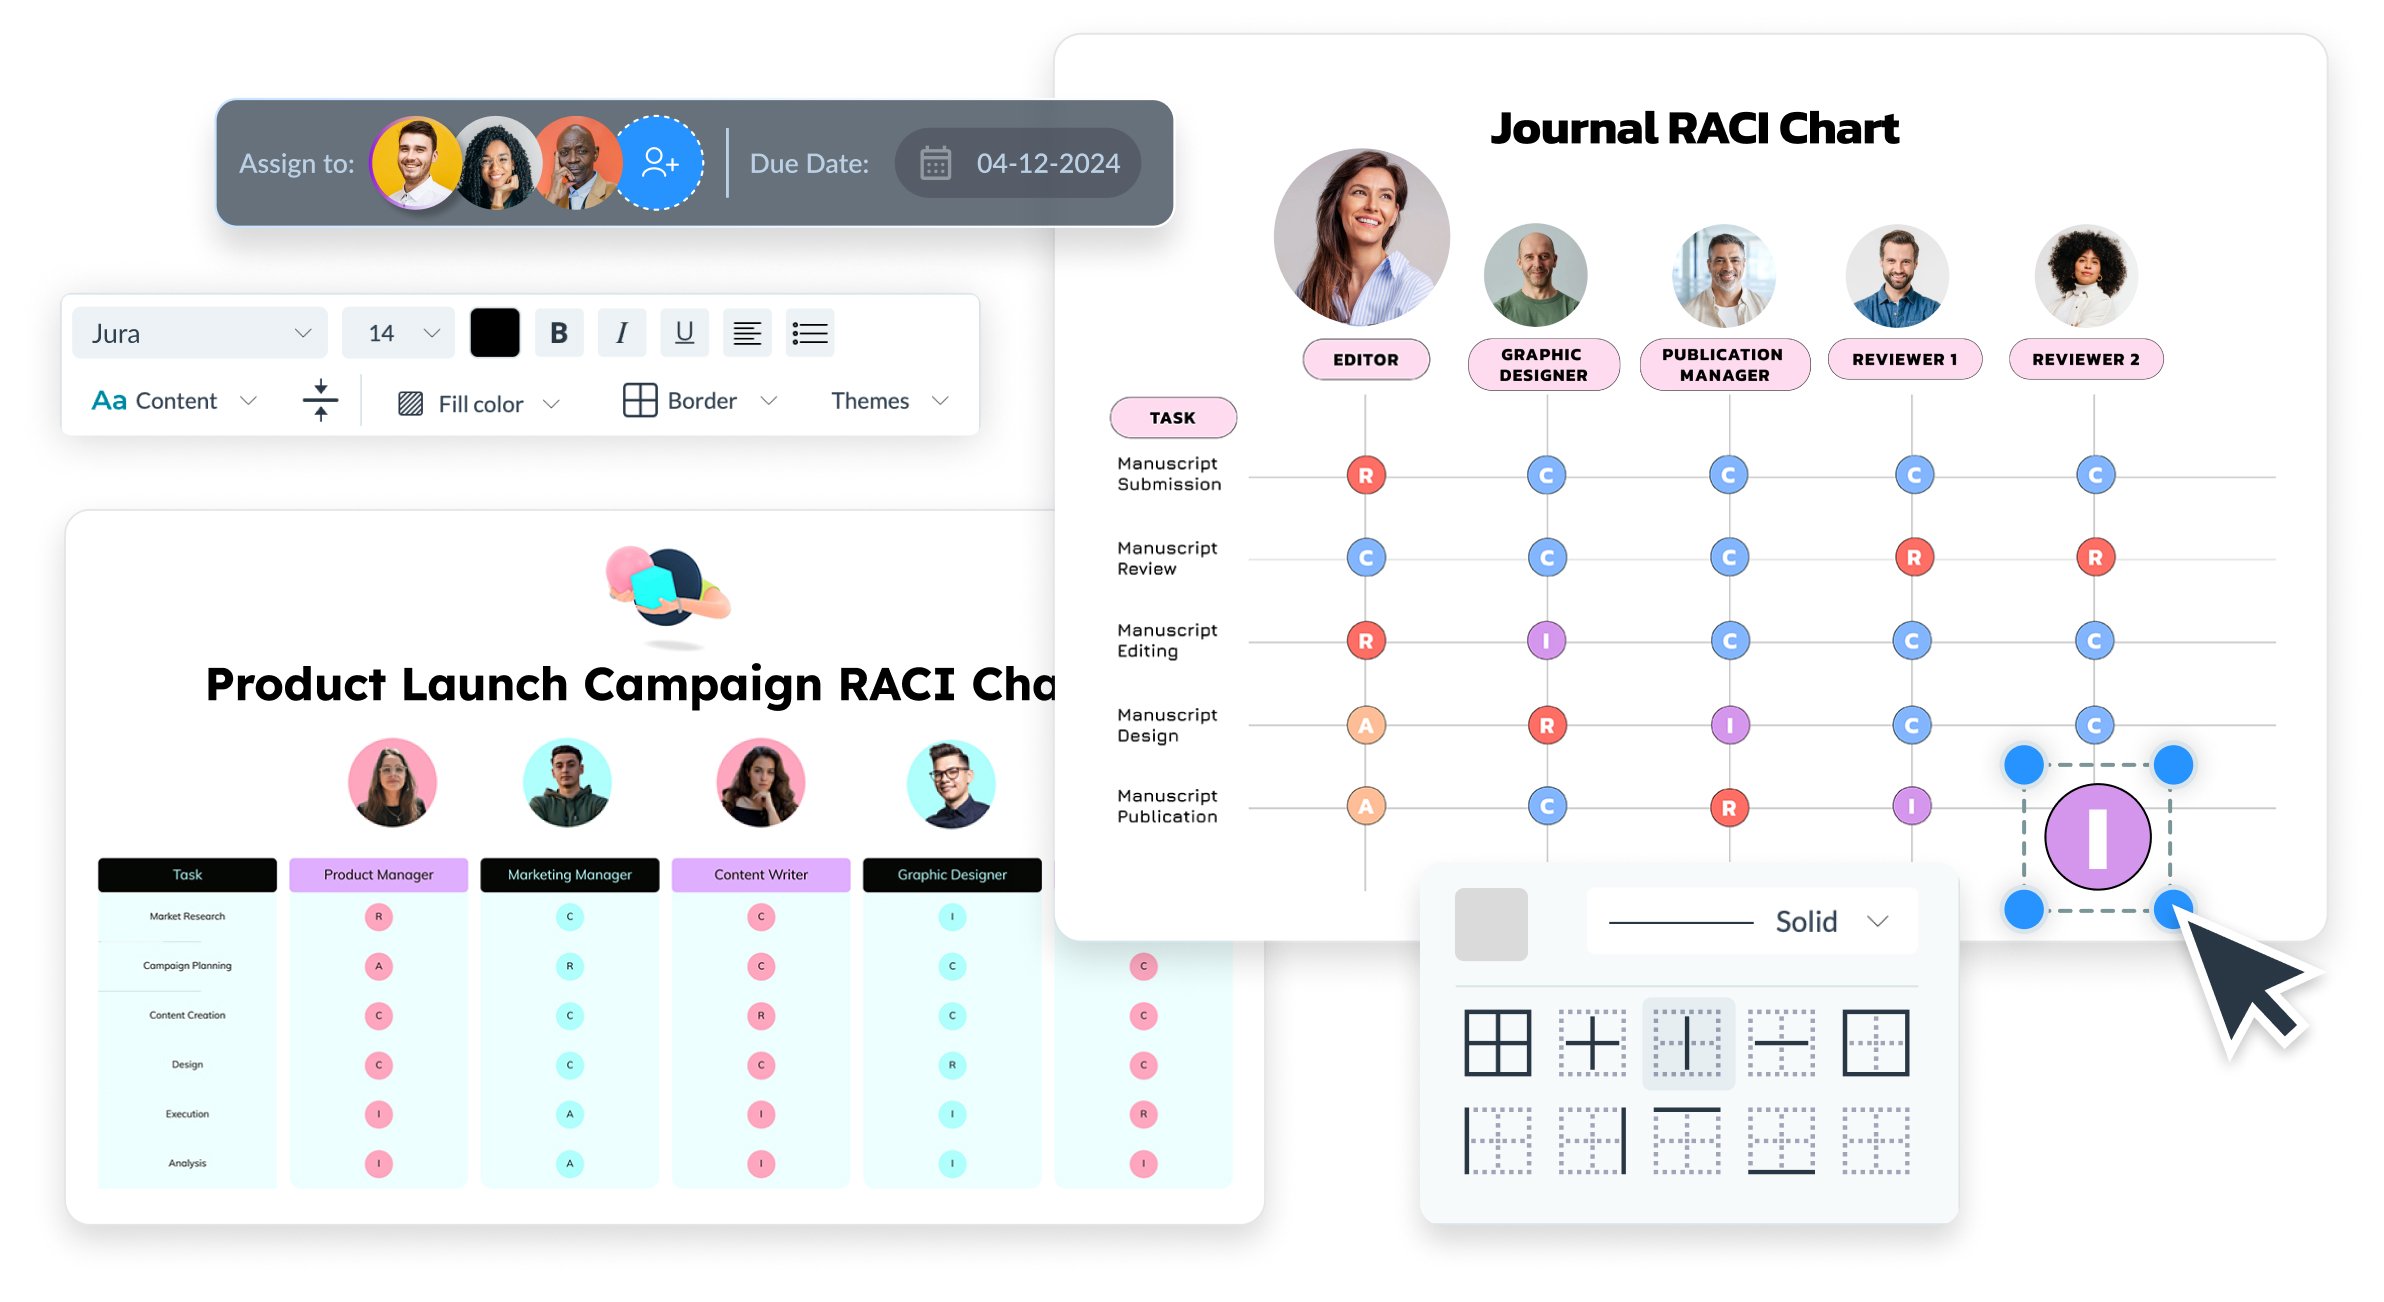
Assign and Modify Project Roles Smoothly
Quickly assign and modify roles and responsibilities using Visme’s intuitive interface for your RACI chart. This simple process enables you to make real-time adjustments, ensuring your chart is both organized and professional. The interface is designed to cater to both experienced project managers and beginners to the RACI methodology.

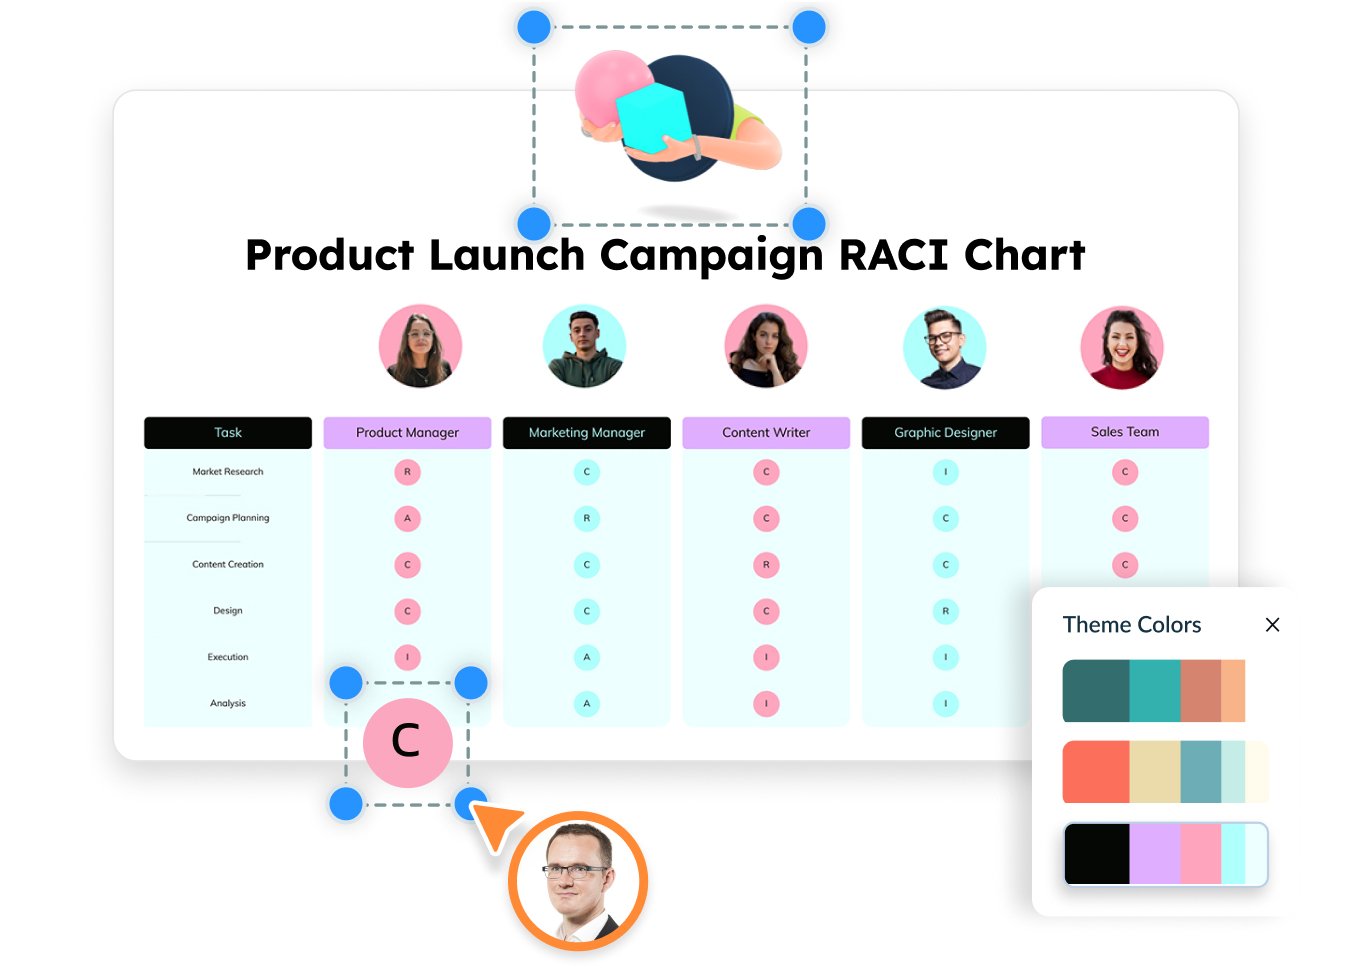
Personalize Your Chart for Maximum Clarity
With Visme, customize your RACI chart to make it as clear as possible. Add color codes to differentiate roles at a glance, insert photos of team members for a personal touch, and use icons and illustrations to make the chart engaging. Tailor your chart to meet project demands and impress stakeholders, ensuring it’s not just functional but also visually aligned with your project’s identity.
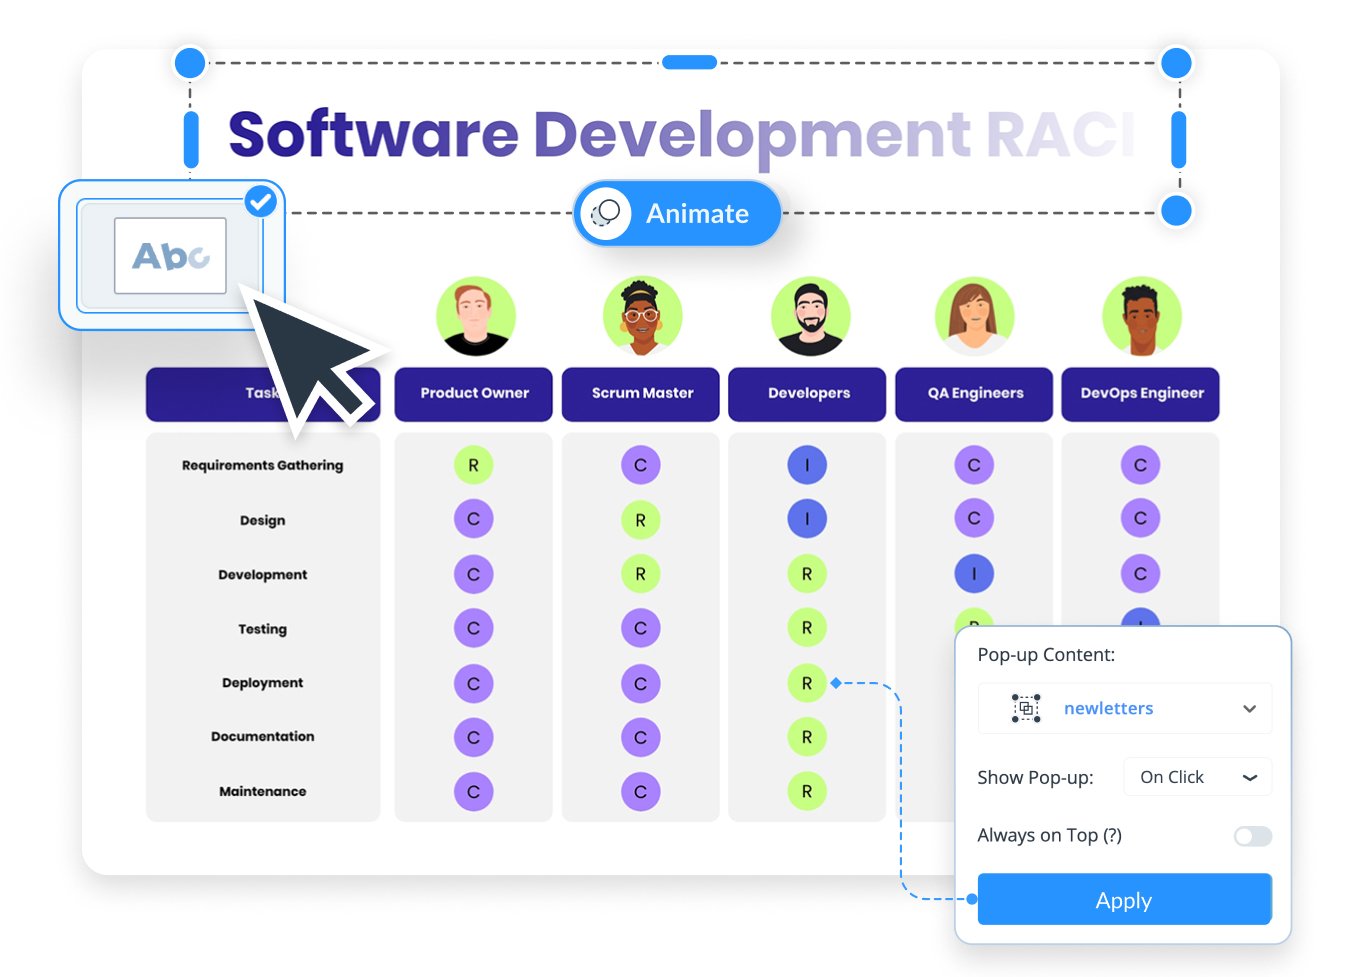
Interactive and Insightful Charts
Make your RACI chart not just informative but engaging. Incorporate interactive elements such as clickable legends that reveal more details, direct links to task descriptions and animations to guide viewers through the chart. These interactive features help viewers easily understand project roles and responsibilities.
More Great Features of the RACI Chart
Drag-and-Drop Chart Maker
No experience is needed to design RACI charts with our user-friendly editor.
Custom RACI Chart Templates
Choose a template that resonates with your project and customize it effortlessly to fit your team's structure.
Direct Role Assignment
Easily assign responsibilities by typing names and roles directly into the chart to ensure clarity among team members.
Color-Coded Clarity
Choose from various color schemes to effortlessly apply color coding and distinguish between different roles and responsibilities at a glance.
Dynamic Customization Options
Tailor everything from fonts to color schemes, ensuring your RACI chart matches your project's branding.
Interactive Elements
Make your RACI chart interactive with clickable elements like buttons, menus and hotspots, keeping stakeholders engaged and informed.
Secured Online Sharing
Share your RACI chart with a secure link, ensuring only authorized viewers have access.
Effortless Export Options
Download your RACI chart in high-quality formats like PNG, JPG, or PDF for presentations or printouts.
Engaging Design Elements
Enhance your chart with illustrations, vector icons and animated graphics that depict tasks or processes.
Real-Time Collaboration
Collaborate with your colleagues to gather feedback and make real-time adjustments to your RACI chart.
Track Engagement Analytics
Gain insights into how stakeholders interact with your RACI chart with metrics like unique views, average time spent, visitors' IP and more.
Workflow Management
Control who can view, edit or comment on your RACI chart, managing team access for optimal security and collaboration.

Learn More
What is a RACI Chart?
A RACI chart—also known as a responsibility assignment matrix—is a simple diagram that clarifies everyone’s role in a project by categorizing tasks into four types: responsible, accountable, consulted and informed. This method helps map out tasks and decision-making responsibilities, ensuring team members know their specific roles.
Using a RACI chart, your team can avoid confusion over duties, streamline communication and efficiently manage project tasks. It’s beneficial in large projects with multiple stakeholders, where clearly defining who does what is crucial for smooth execution. The RACI model improves team coordination and focuses efforts where they’re most needed, making complex project management more manageable.
Streamline Project Management with Visme's RACI Chart
Make your project management more efficient with Visme's RACI Chart tool. By clearly defining roles and responsibilities, you can pinpoint critical tasks and focus on what truly needs attention. Our easy-to-use features allow you to assign tasks, reduce overlap and ensure everyone understands their role. Transform your team's collaboration with our visually powerful RACI charts, making complex team structures simple and actionable.
Everything you need + more
More Than Just RACI Charts

Make it engaging
Interactivity
Create interactive reports with popup and rollover effects that allow your viewer to interact with your design to learn more information.

Visualize your data
Charts & Graphs
Showcase sales, marketing, website data and more in your reports with Visme’s easy-to-use charts, graphs and other data visualization tools.

Beautify your content
Video & Animation
Choose from over a million stock photos, icons, illustrations, characters, lines, shapes and more to create a completely unique report.
How it works
How to Make a RACI Chart in 5 Simple Steps
With Visme's intuitive platform, creating a RACI chart is simple and hassle-free. Visme streamlines the process of visualizing team roles and project tasks. Our selection of customizable templates gives you a head start in organizing your project's structure. Simply choose a RACI chart template that works for you, input your project details and customize the design to fit your needs.
Follow these easy steps to construct your RACI chart with Visme:
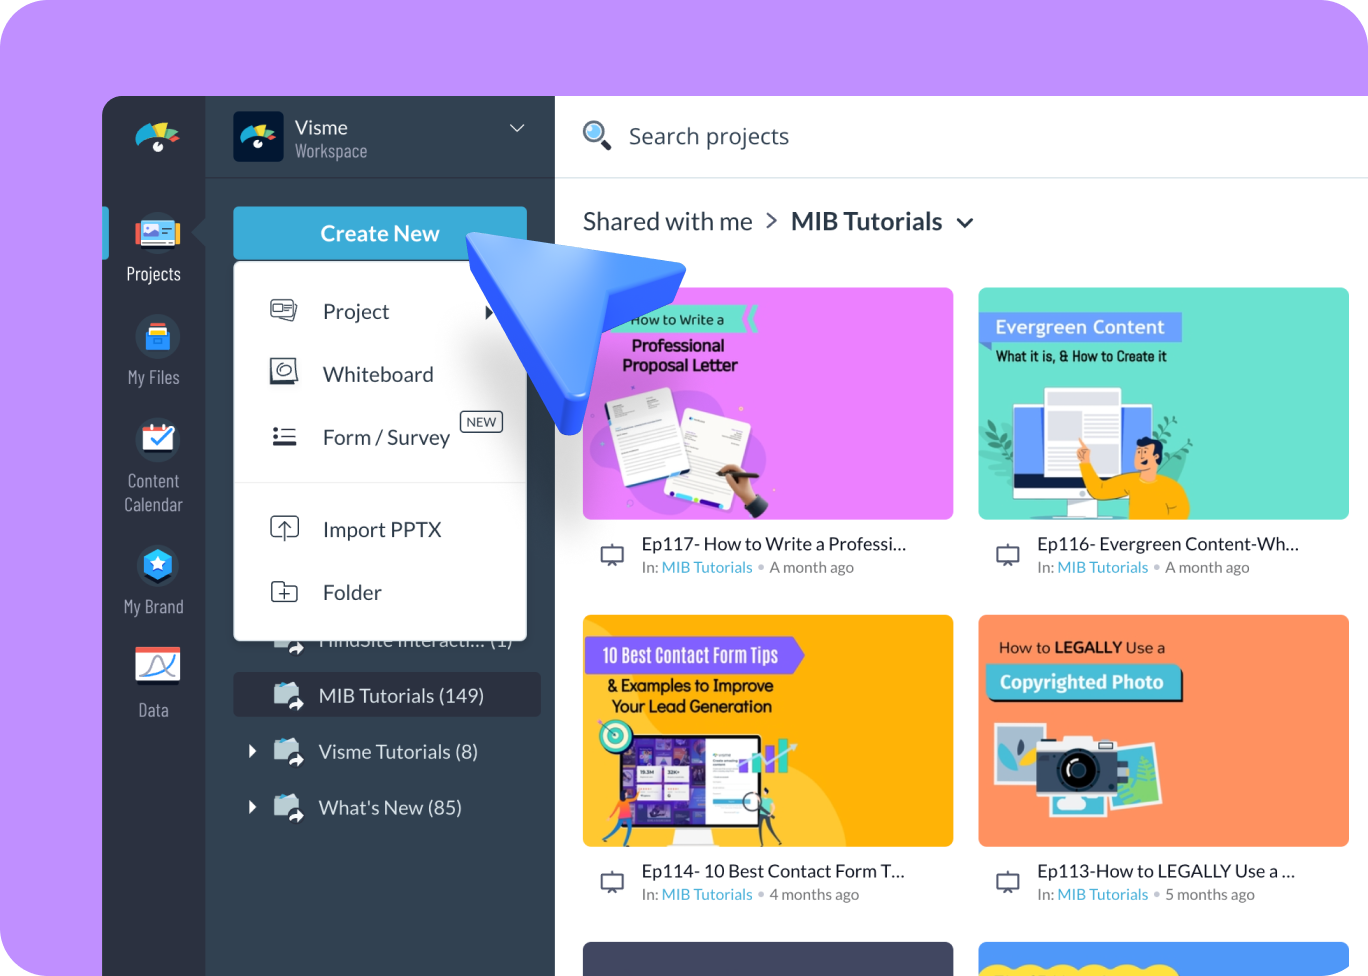
- Log in to your Visme account and click “Create New” to start a new project from your dashboard.
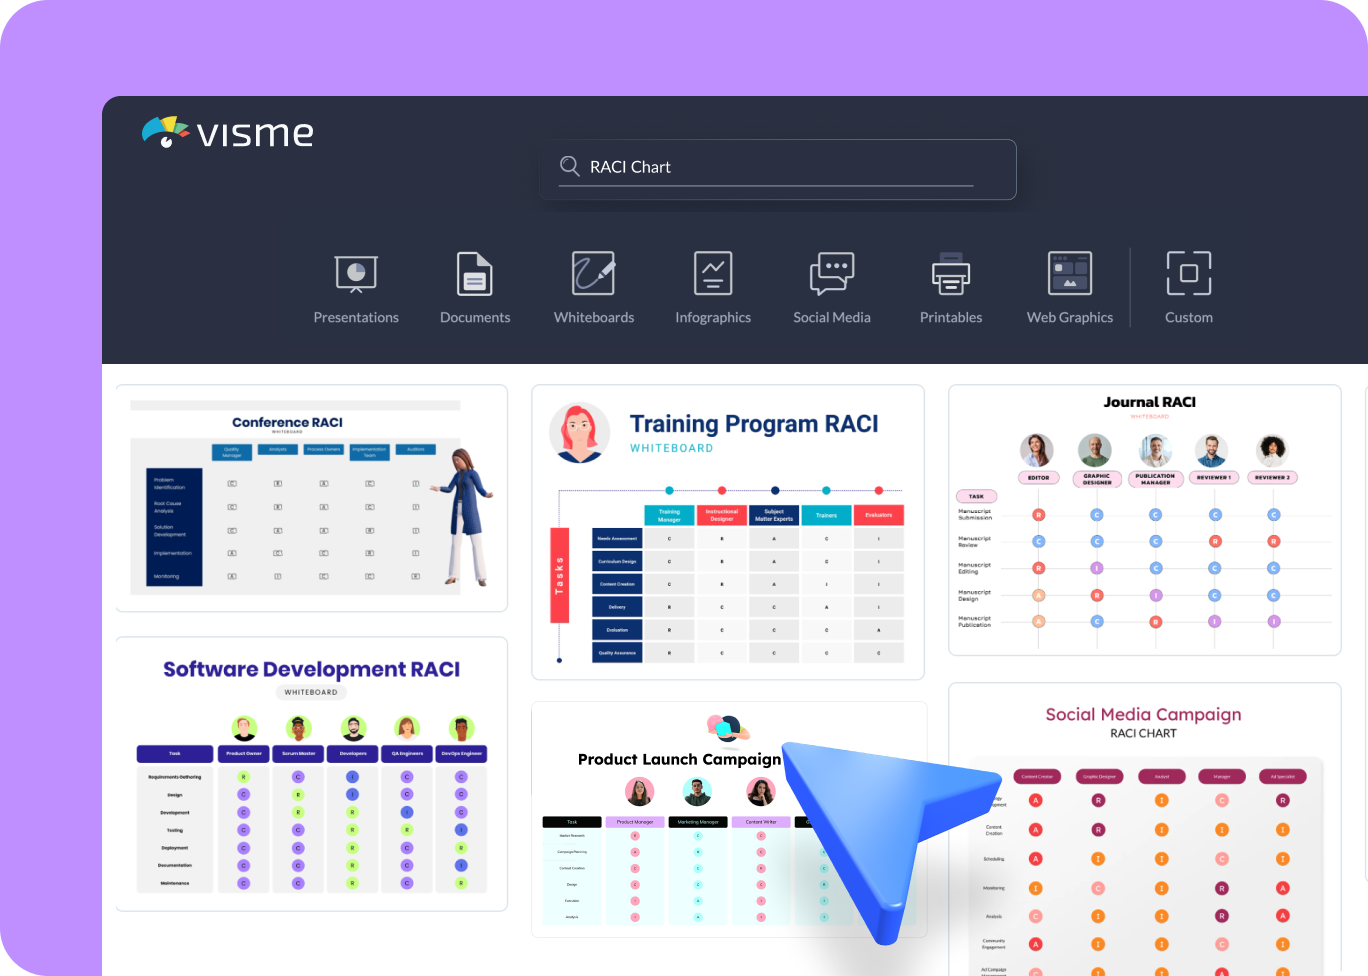
- Use the search bar to search for “RACI Chart” in the relevant category and view template options.
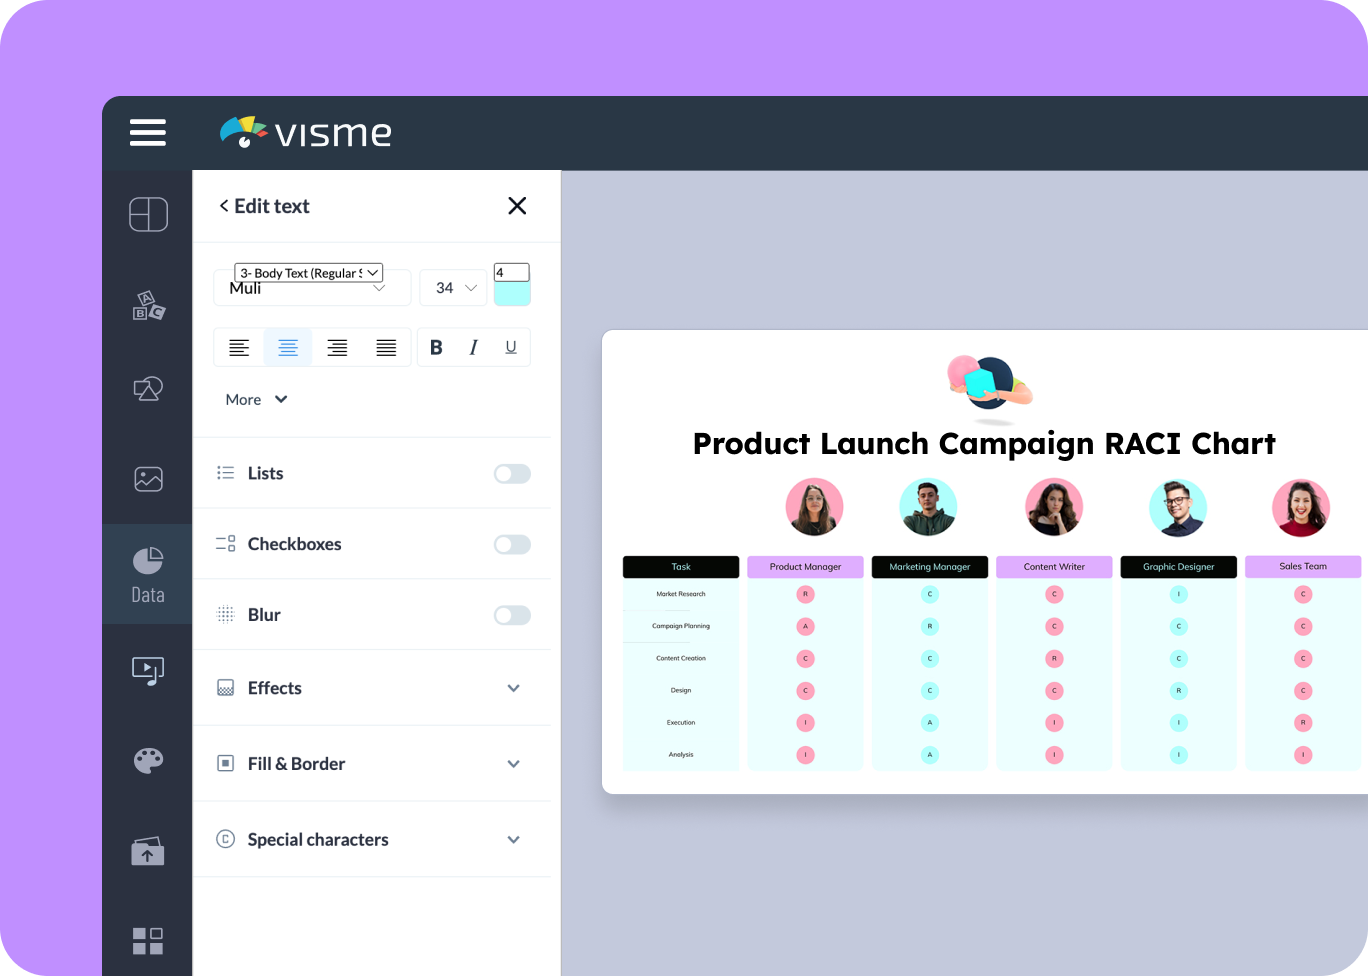
- Choose a RACI chart template that fits your project needs and input your roles and responsibilities.
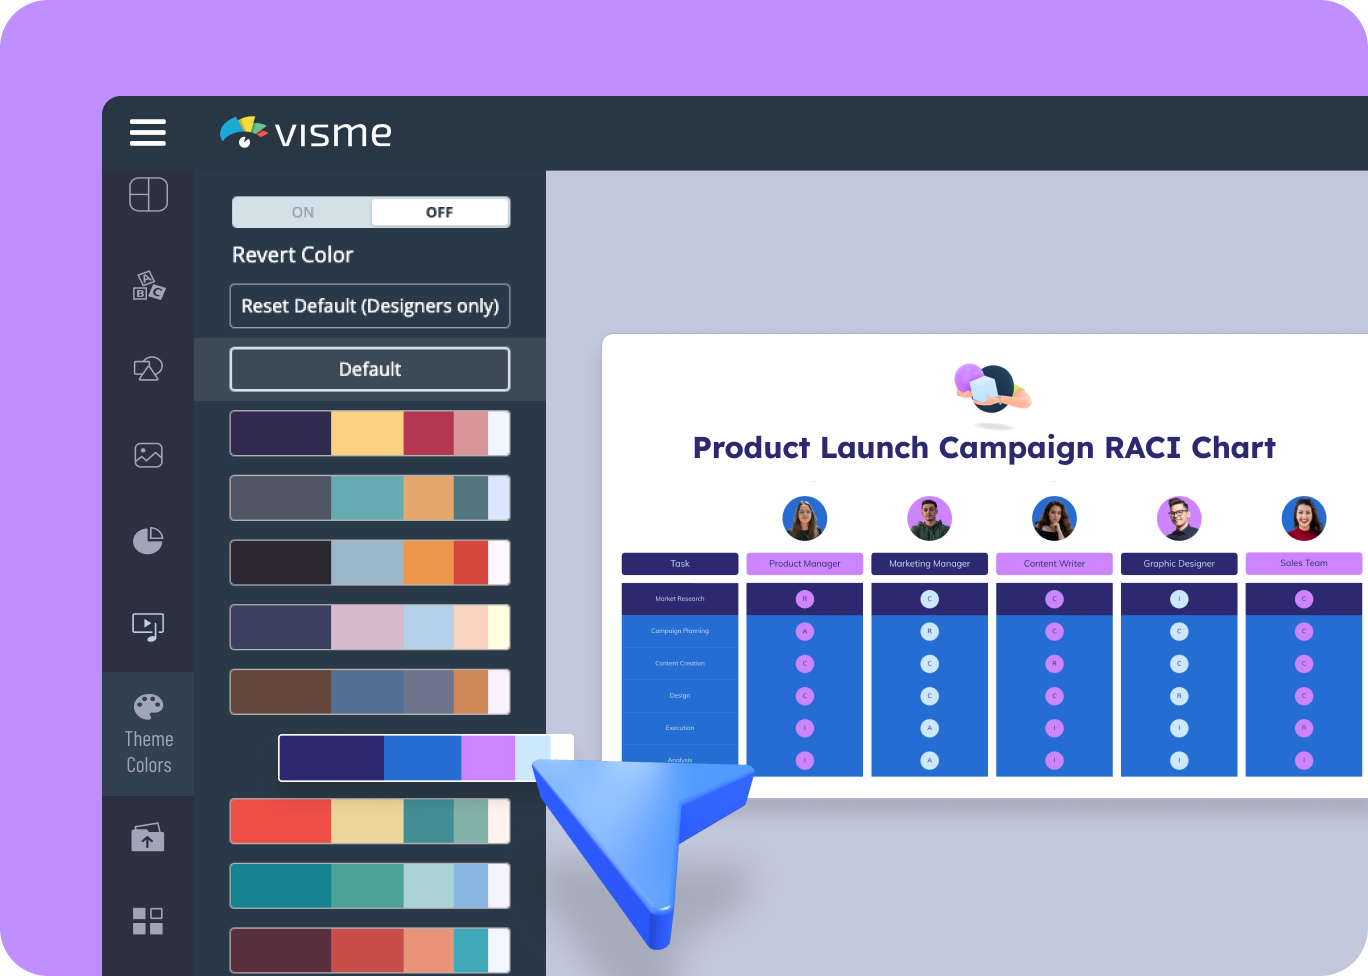
- Customize your chart by altering colors, fonts, and graphics to match your team or company branding.
- Once finished, download your RACI chart in formats like PDF, JPG, or PNG, share via a direct link, or embed it on your website for wider access.
Quick tips
Optimize Your RACI Chart for Better Team Coordination
Use your brand colors and brand fonts to make your RACI chart recognizable and consistent with your brand identity.
Organize roles within the chart using color-coded rows or columns to separate duties and reduce potential overlap.
Identify roles and tasks with unique icons or shading patterns, ensuring they stand out for easy recognition and understanding in your RACI chart.
Strive for a minimalist design focused on readability to prevent confusion about the chart's communicated responsibilities and accountabilities.
Include hyperlinks in your chart that lead to detailed role explanations, task documents, or supportive external content.
Implement interactive tooltips or pop-ups that provide additional task details on hover, keeping your chart informative yet neat and tidy.
Use clear, brief text for labeling, opting for direct language to maintain focus and let viewers grasp the information presented.
Consider using annotations or comments to explain recent changes, helping everyone stay in sync with team dynamics.
Frequently Asked Questions (FAQs)
A RACI chart is a matrix-style tool used in project management to define the roles and responsibilities of team members for each task or deliverable. RACI stands for:
- Responsible: The person(s) who actively do the work.
- Accountable: The person ultimately answerable for the task's success.
- Consulted: People who provide input or expertise.
- Informed: People who need to be kept updated on progress.
RACI charts are important because they:
- Eliminate confusion: Clearly outline who does what, preventing delays.
- Boost accountability: Ensure someone is ultimately responsible for each task.
- Streamline communication: Establish who should be involved in decision-making.
- Increase efficiency: Prevent duplication and wasted effort.
Here are the options for you to create a RACI Chart:
- Manually: Use a spreadsheet or table with tasks down one side and roles (Responsible, Accountable, etc.) across the top.
- Templates: Many free RACI chart templates are available online.
- Dedicated software: Tools like Visme offer customizable RACI chart templates with drag-and-drop simplicity and all the necessary features.
Here are some important tips:
- Involve your team: Get input from those working on tasks for accurate role allocation.
- Keep it simple: Avoid complex charts and focus on clarity.
- One 'Accountable' per task: Ensures clear ownership.
- Review regularly: Adapt the RACI chart as your project evolves.
Absolutely! Agile teams often benefit from RACI charts as they provide adaptability while maintaining clarity. In Agile, you can visit the RACI matrix in each sprint as roles evolve with project needs.
Visme simplifies creating RACI charts with the following:
- Intuitive interface: Drag-and-drop design; no special skills are needed.
- Customizable templates: Start with a solid framework and tailor it to your project.
- Collaboration tools: Team members work together in real time.
- Easy sharing: Share via links, downloads or embed the chart in websites.