PERT Chart Generator for Simplified Project Management
- Easy-to-use PERT chart generator.
- Connect various shapes and line designs.
- Customize text, colors, sizes and positions.

Chosen by brands large and small
Our PERT chart maker is used by over 34,300,000 marketers, communicators, executives and educators from over 133 countries that include:
EASY TO EDIT
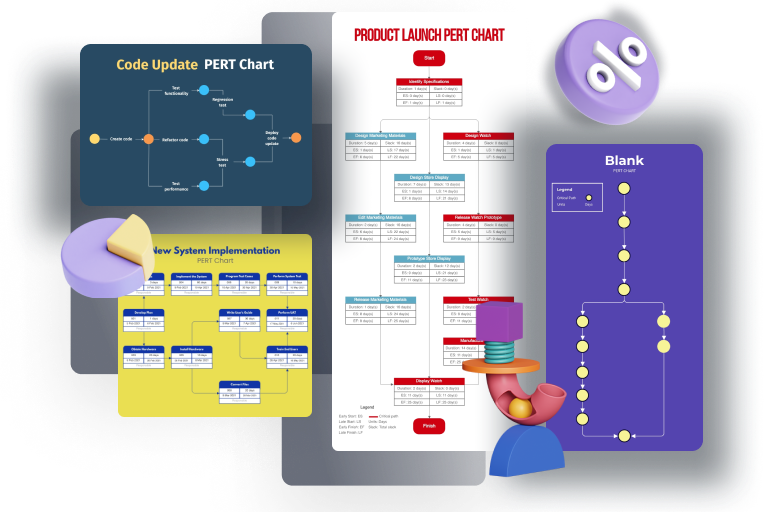
PERT Chart Templates
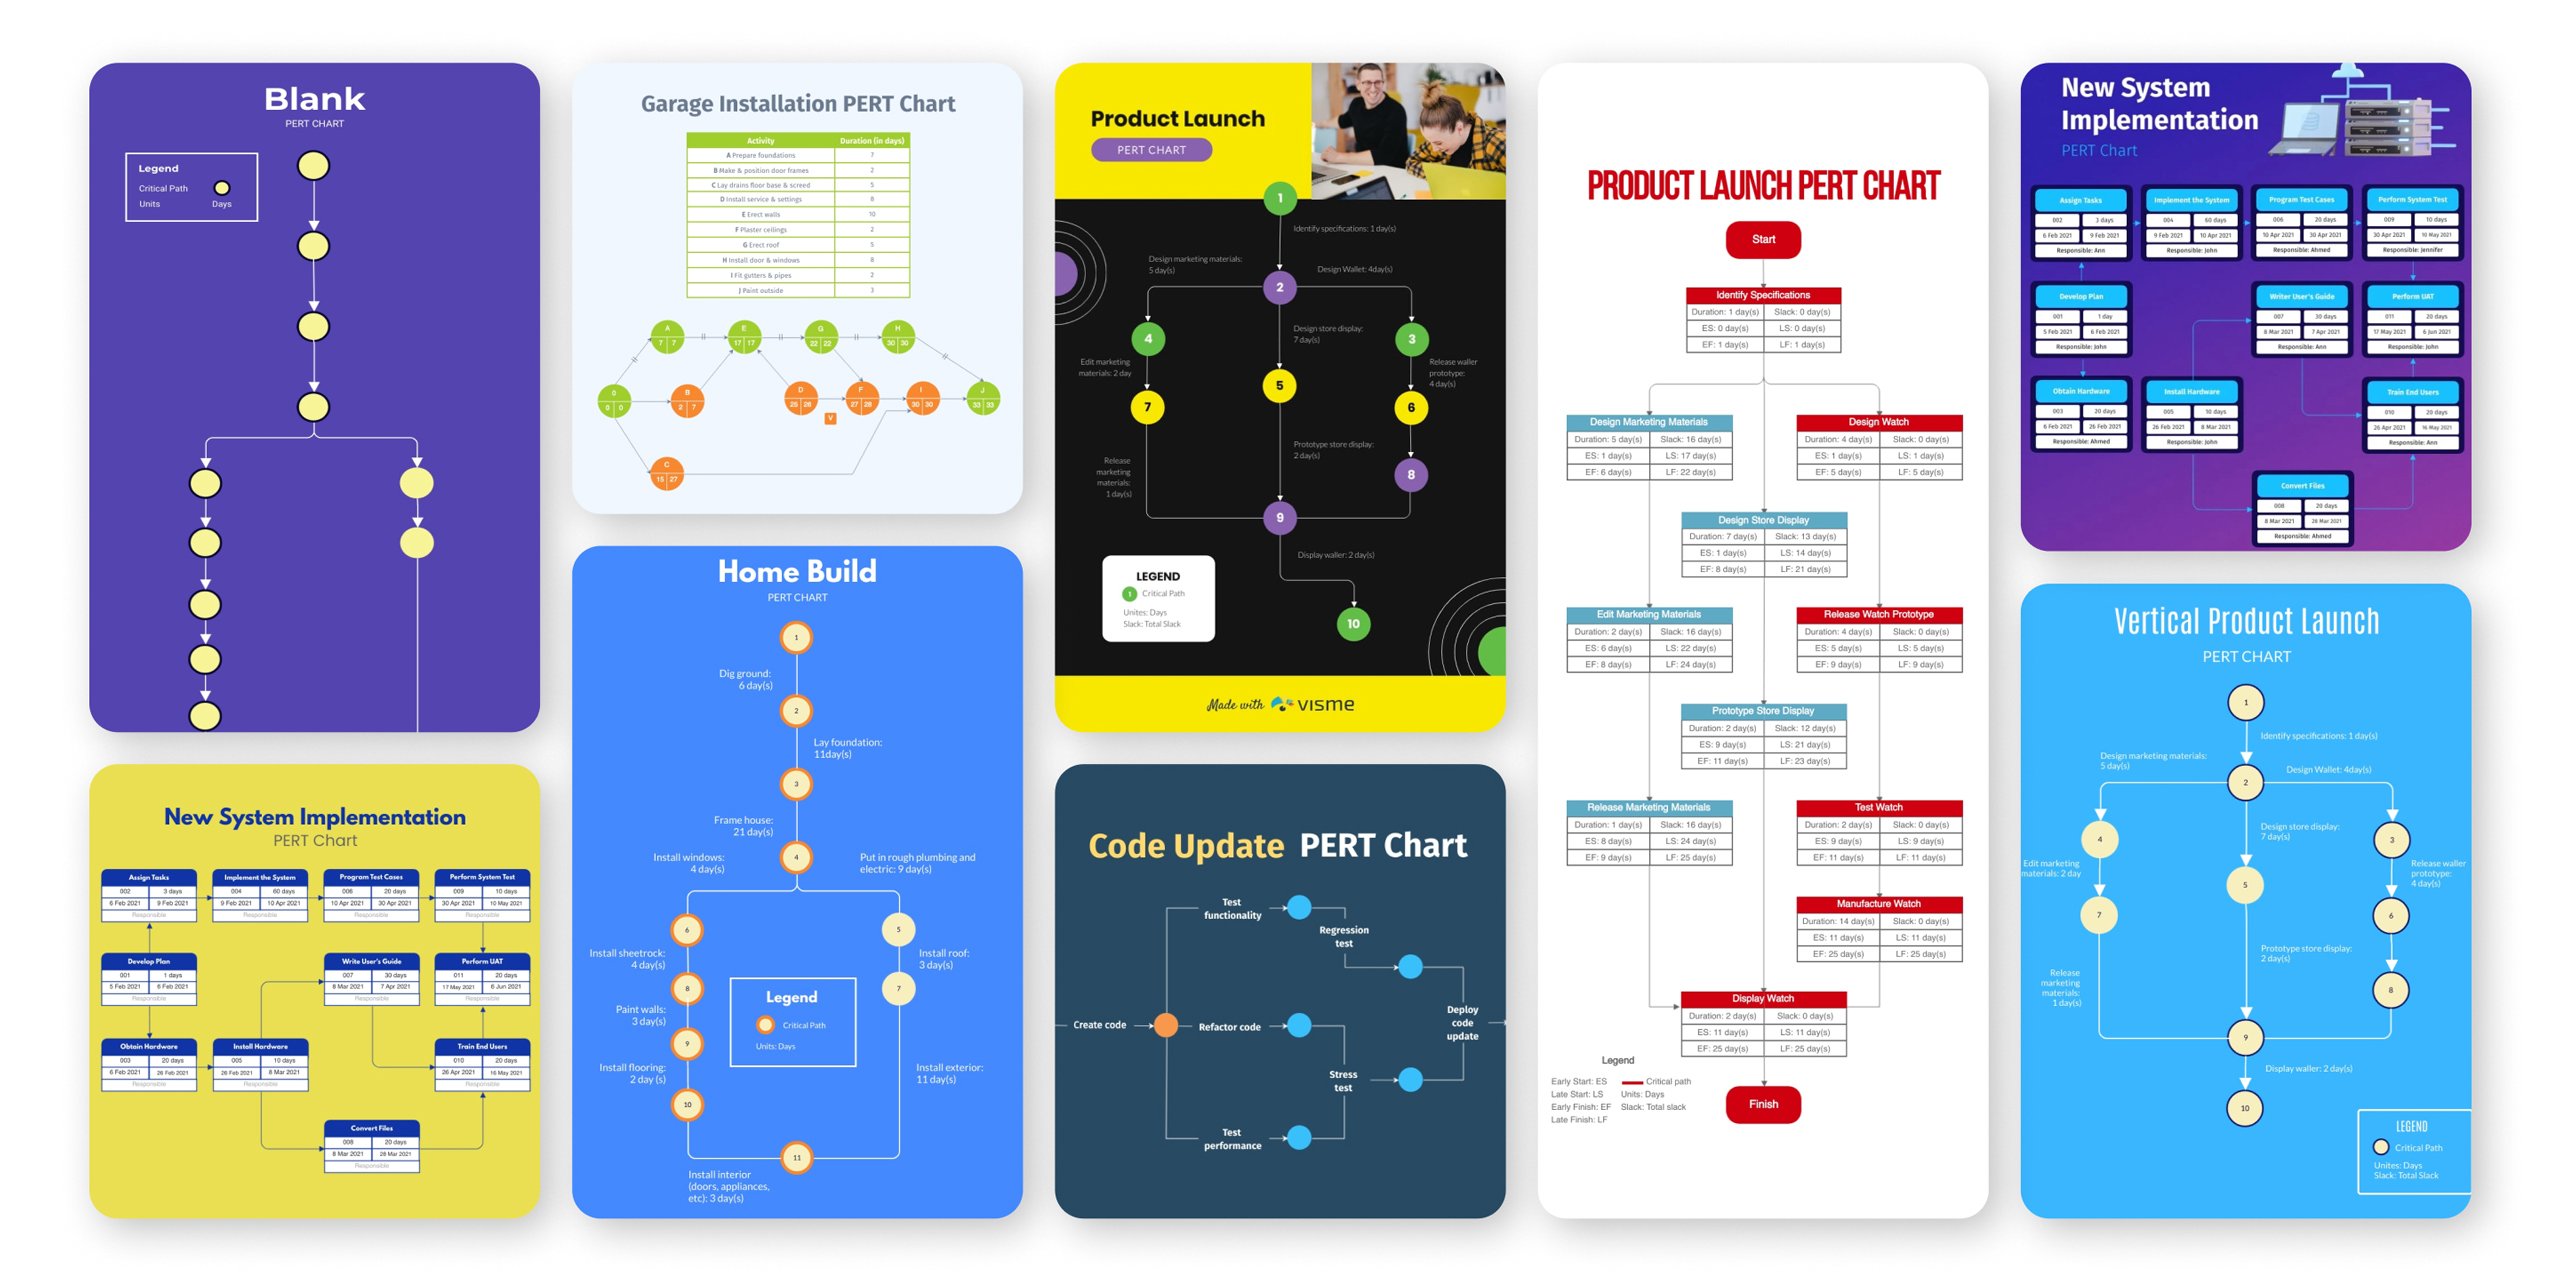
While you can always start a design from scratch, Visme also provides pre-built PERT chart templates designed by professionals. These templates empower you to create high level designs fast. All you have to do is swap out the content, connect and reconnect lines where necessary, and modify the color and fonts.
Features of the PERT Chart Generator
Choose from PERT chart templates
Want a starting point for your next project design? Visme offers plenty of beautifully designed PERT chart templates to help jumpstart your design and create the perfect PERT chart for your next big project.
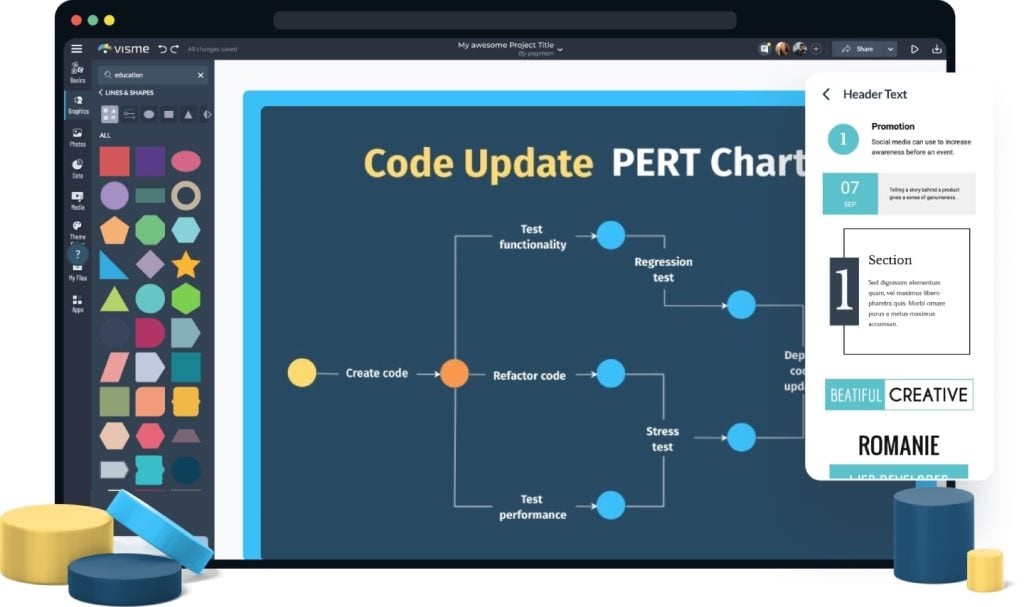
Build your PERT chart
Visme’s PERT chart software for teams helps you rapidly prototype PERT charts by quickly adding shapes, connecting them to lines, and moving them around the canvas to properly illustrate the timeline of your project.
Customize every aspect of your PERT chart
Customize everything inside the free online PERT chart generator. It's simple to resize your shapes while keeping the relevant lines connected. You can also customize the lines making them thicker, longer, or changing their direction. You can also insert your custom text inside the shapes and modify the color and shape at will.

More Great Features of the PERT Chart Generator
-
Library of premade templates to help diagram your project
-
Hundreds of thousands of icons and photos to choose from
-
Add in your own branded fonts and colors to make it your own
-
Easy drag-and-drop design tools, made with the non-designer in mind
-
Choose a custom line and shape style, then draw out your PERT chart
-
Download as an image file or embed on a webpage
Share Your PERT Chart
After you finish your creation, there are many ways to share your PERT chart with Visme. After finishing with the PERT chart generator you can quickly and easily share it with your audience by embedding your chart on a webpage, generating a shareable link or downloading it in a variety of different formats.

LEARN ABOUT PERT CHARTS
What is a PERT Chart?
A PERT chart is a graphic representation of all the important data involved in your project. PERT stands for the program evaluation and review technique.
A PERT chart represents the data you collect from an analysis of all the steps you need to take to complete a project.
Use the PERT chart generator to visualize your project.
The PERT chart generator will help you create PERT charts online. You can access the tool inside the Visme editor. When you use the generator, you’ll gain access to many graphic options to improve your chart, from custom shapes, line designs, icons and more.
EVERYTHING YOU NEED + MORE
More Than a PERT Chart Generator
Create a PERT chart online with Visme’s easy-to-use PERT chart generator. With a variety of shapes and line designs to choose from, the ability to drag and drop different elements all over the canvas, you’ll be able to make a PERT chart in minutes.

BEAUTIFY YOUR CONTENT
Images & Graphics
Choose from over a million stock photos, icons, illustrations, characters, lines, shapes and more to emphasize your content.
MAKE IT ENGAGING
Interactivity
Add popup and rollover effects to your PERT chart so viewers can interact with your chart to learn more information.

EASY-TO-USE DATA VISUALIZATION TOOLS
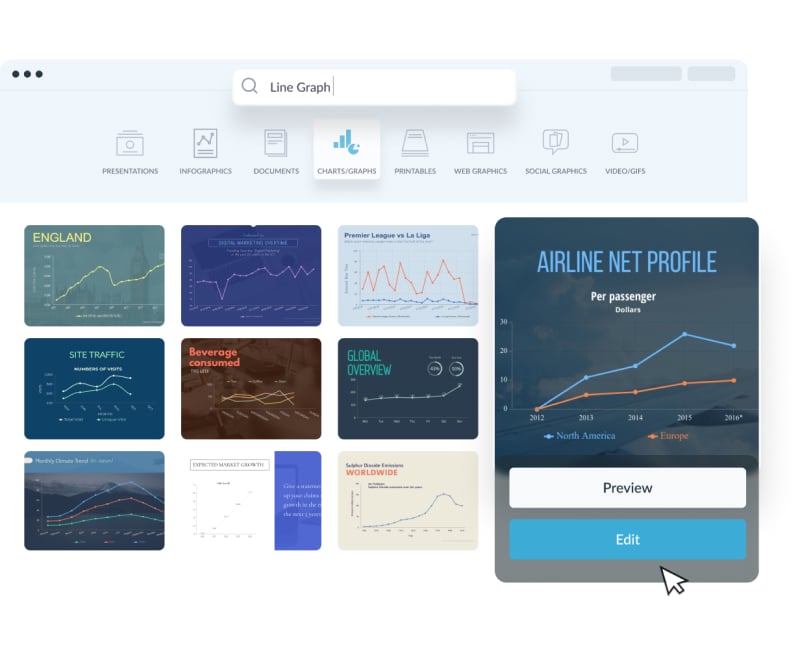
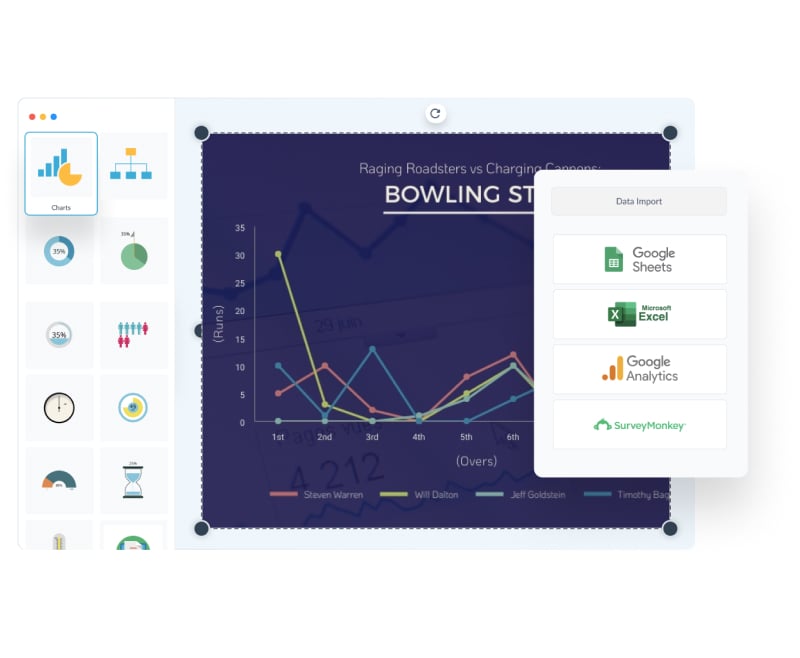
Charts & Graphs
Incorporate tables, charts, graphs and other data widgets to better explain your PERT chart.
HOW IT WORKS
How to Make PERT Charts in 5 Steps
It’s easy to simplify the most complex projects using Visme’s PERT chart software. Need to make precise connections between project stages. Simply edit and attach shapes as you go.
Our drag and drop design tools make it simple to control your PERT chart. Follow this five-step tutorial to learn more.
- Log into your Visme dashboard and create a new project. Choose a PERT template to jumpstart your design.
- To use the PERT generator, click on the Data tab and choose the PERT chart icon. Choose a shape to start building your PERT chart.
- Click on the first shape on the canvas and you’ll see the sizing tabs along with a grey arrow on each side.
- Click on an arrow and pick from one of the six building options. You can add one, two or three connected shapes at a time.
- Make your PERT chart public or private and share online or download as a PDF or high-resolution image file.
QUICK TIPS
How to Use the PERT Chart Generator
Start by getting an idea of the entire project that you need to represent and its various steps.
Sketch a quick rough draft of your PERT chart to understand how you want it to look.
Log in to the Visme dashboard and choose a blank canvas or a PERT chart template.
Click on the Data tab, located on the left-hand panel. Choose the PERT chart tool from the menu.
Select the first shape to start building your chart. You’ll likely use several of this same shape throughout, so make sure your choice fits well in your design.
Add symbols to your PERT chart to represent the project milestones.
Customize the size of shapes and lines. If you need to move a line and shapes to another section, just un-attach it and attach it somewhere else.
Make sure to label all project stages correctly. Before finalizing your PERT chart, send it to a team member through Visme to get their comments.
Change the font, color and size of the text inside your PERT chart to match your brand or project.
Download your chart, and add it to an email or message. Also, you can embed the PERT chart to your website with just a little snippet of code.
Frequently Asked Questions (FAQs)
What is a PERT chart used for?
Use PERT charts to show step-by-step the steps you need to take to complete a project. They can be useful in many different ways, such as making your pitch more persuasive, helping to onboard new team members or to keep your team on track.
How much does it cost to create a PERT chart with the generator?
It’s completely free to design custom PERT charts with Visme. You can add a PERT chart to any graphic you need and download it as an image file.
Are the PERT charts completely customizable?
Yes! The PERT chart maker will let you create something that matches your vision. Every single section is customizable for shape, size and position.
How can I make a PERT chart online?
Learning how to create a PERT chart is easy. Start by logging into the PERT chart generator in Visme. Start adding shapes, customize them in the way you need and finish by sharing your chart with the people who need it.
You can return to this page anytime you need and follow our detailed 10 step process.
Are there any PERT chart templates to use?
Absolutely! You can find the PERT chart templates inside the dashboard and we are creating more all the time!
Is there a size limit for my PERT chart?
Not at all! With Visme, you can resize the canvas and adjust the PERT chart to the size you need.