Free Generative AI Feature for Creating Customizable Charts
- Generate beautiful charts from a text prompt.
- Specify a chart type, choose a style, and Visme’s AI will generate data, and text.
- Easily customize the chart’s fonts, colors, legends and data if needed.
Beautiful Charts Generated With
Visme’s AI Chart Maker
AI Chart Prompt 1
Plot a line chart of monthly real estate sales for a year to analyze trends and identify peak sales periods throughout the year.

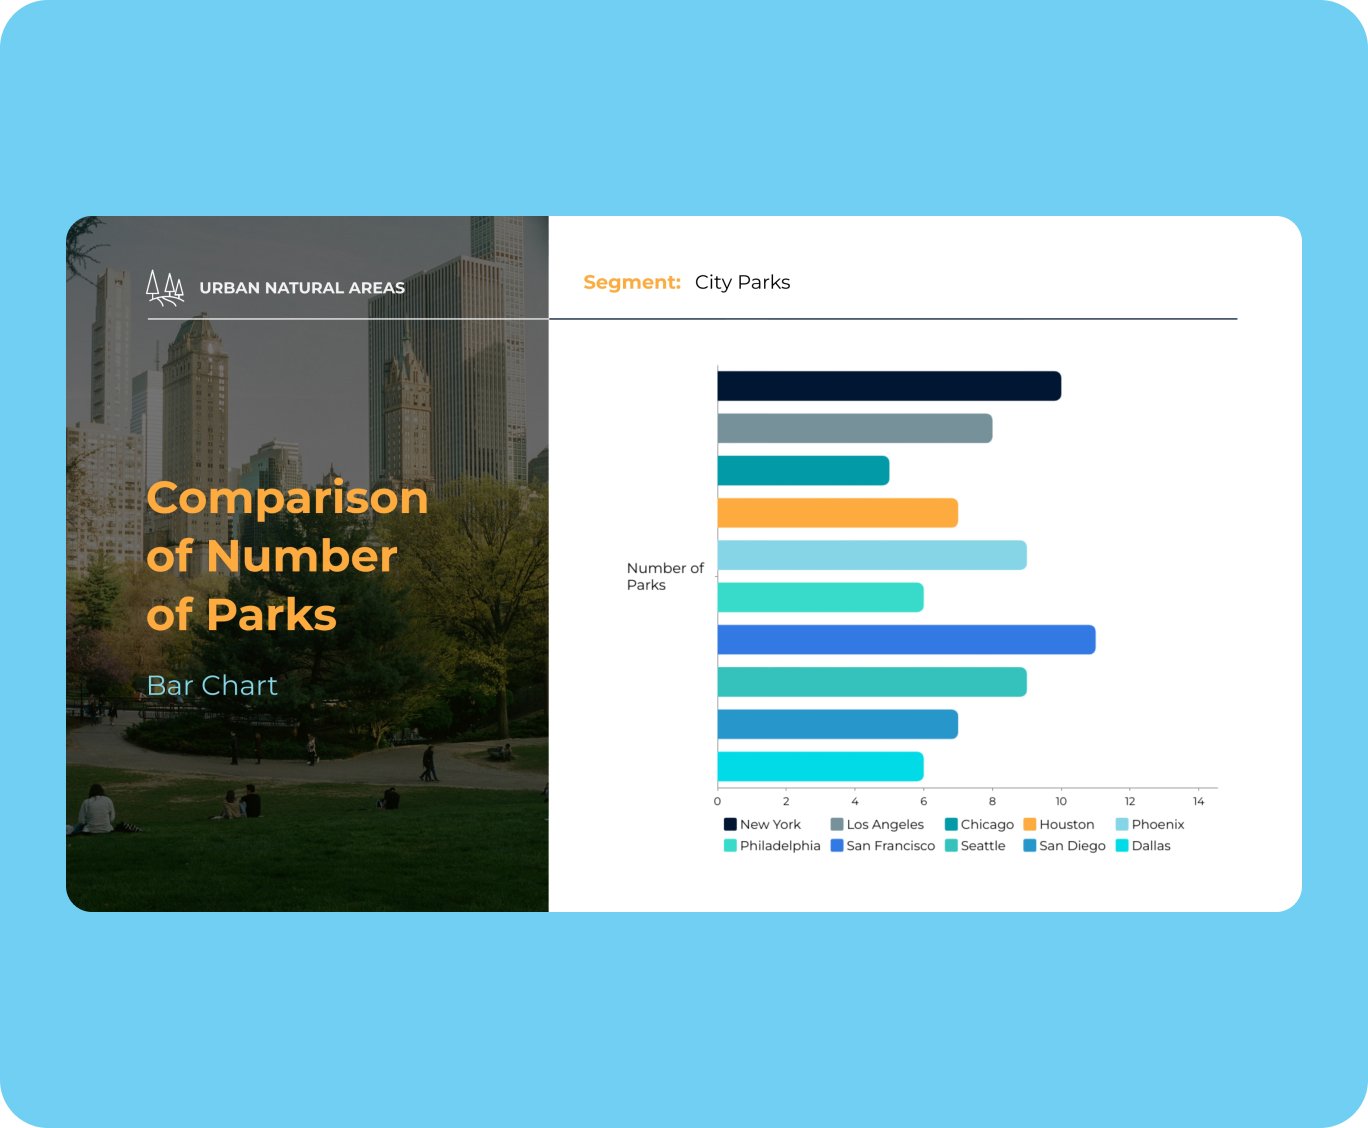
AI Chart Prompt 2
Generate a bar chart showing the number of parks in ten large cities to compare and visualize urban natural areas.
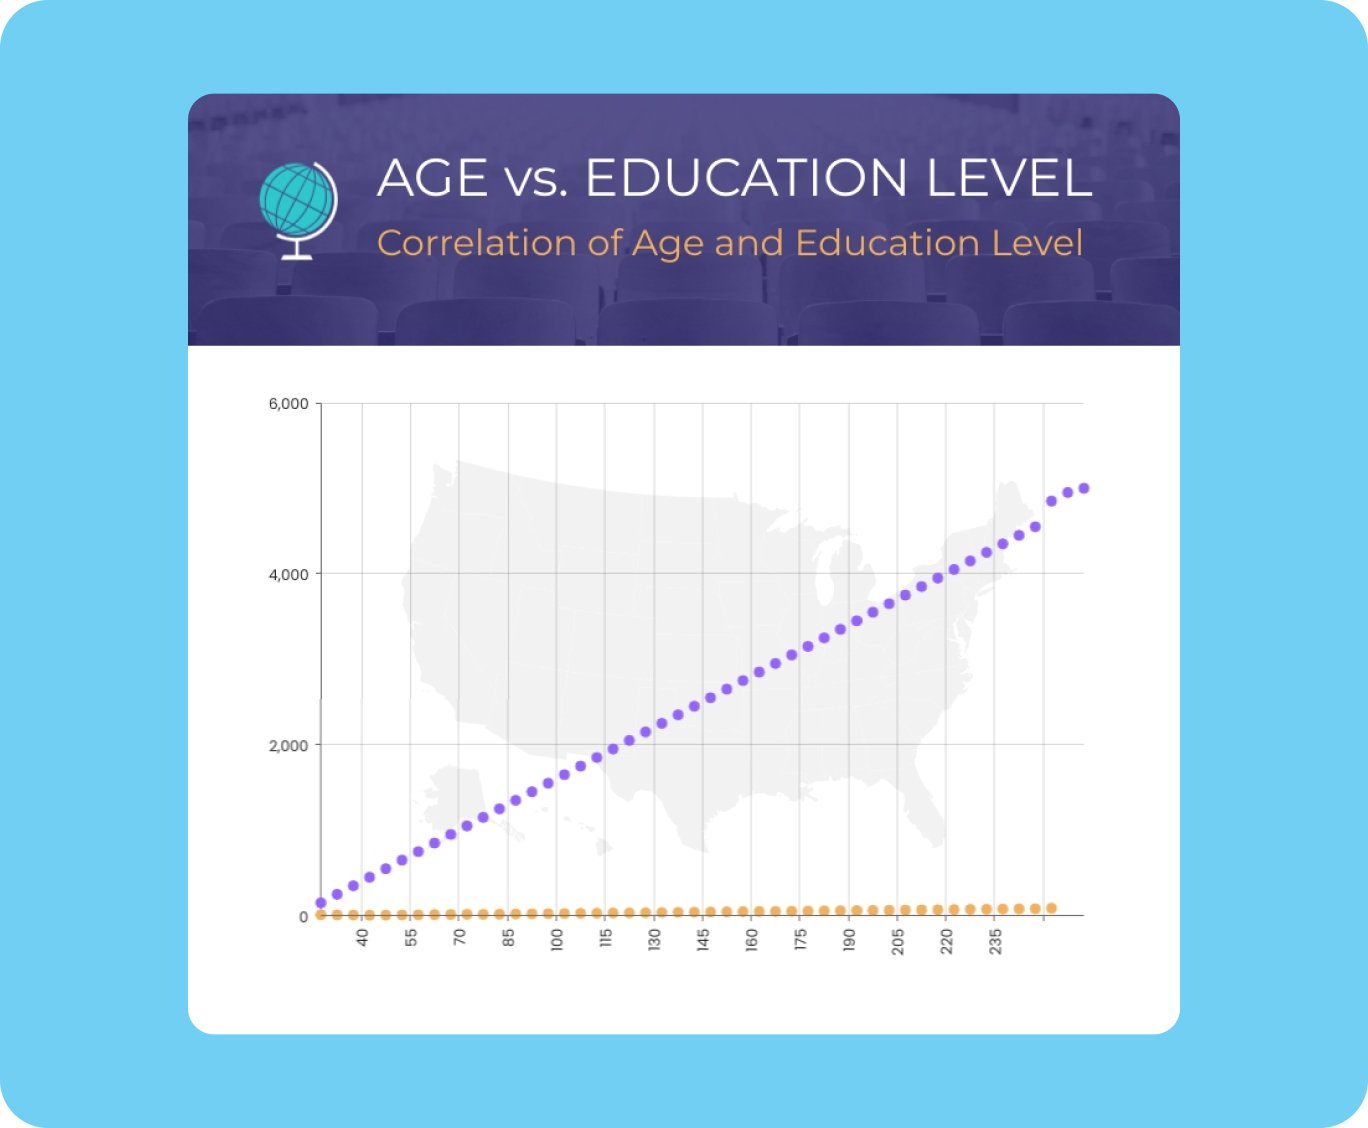
AI Chart Prompt 3
Generate a scatter plot comparing age and education level of a set of individuals to explore the correlation between the two.
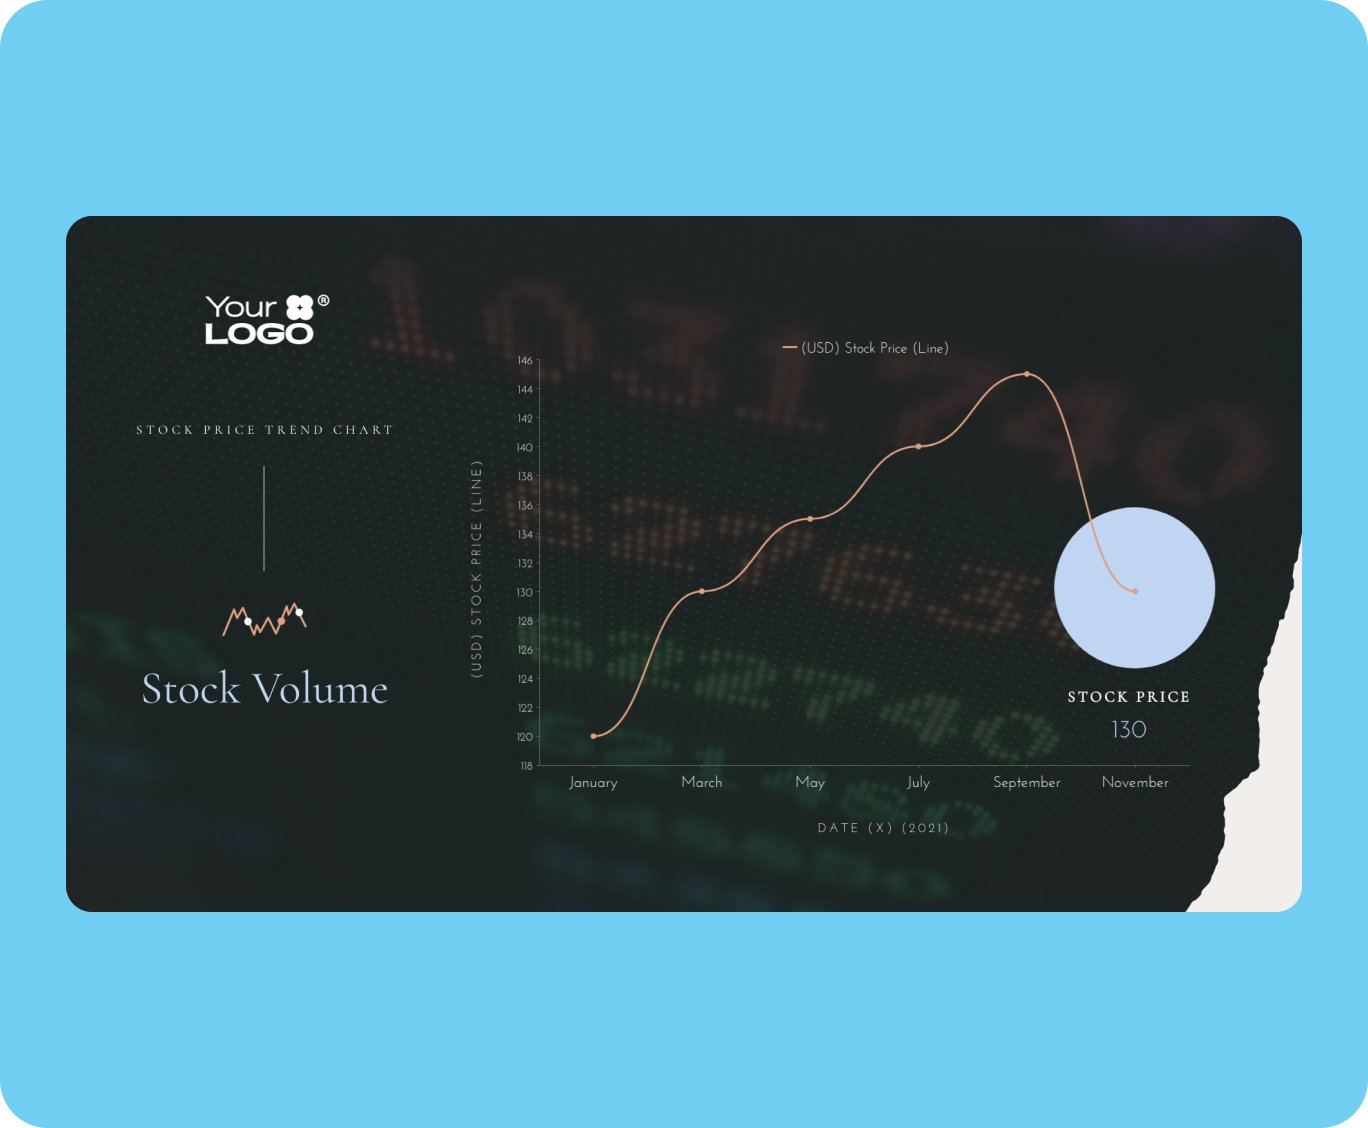
AI Chart Prompt 4
Create a line chart depicting weekly stock prices for one year to monitor stock price movements and identify trends.
HOW IT WORKS
How to create charts with Visme AI
Make charts fast by generating customizable first-draft data visualizations. Find the chart maker inside the Visme dashboard or in the template library. It’s always prepared to receive your descriptive text prompts and generate pie charts, area charts, and more, in less than two minutes.
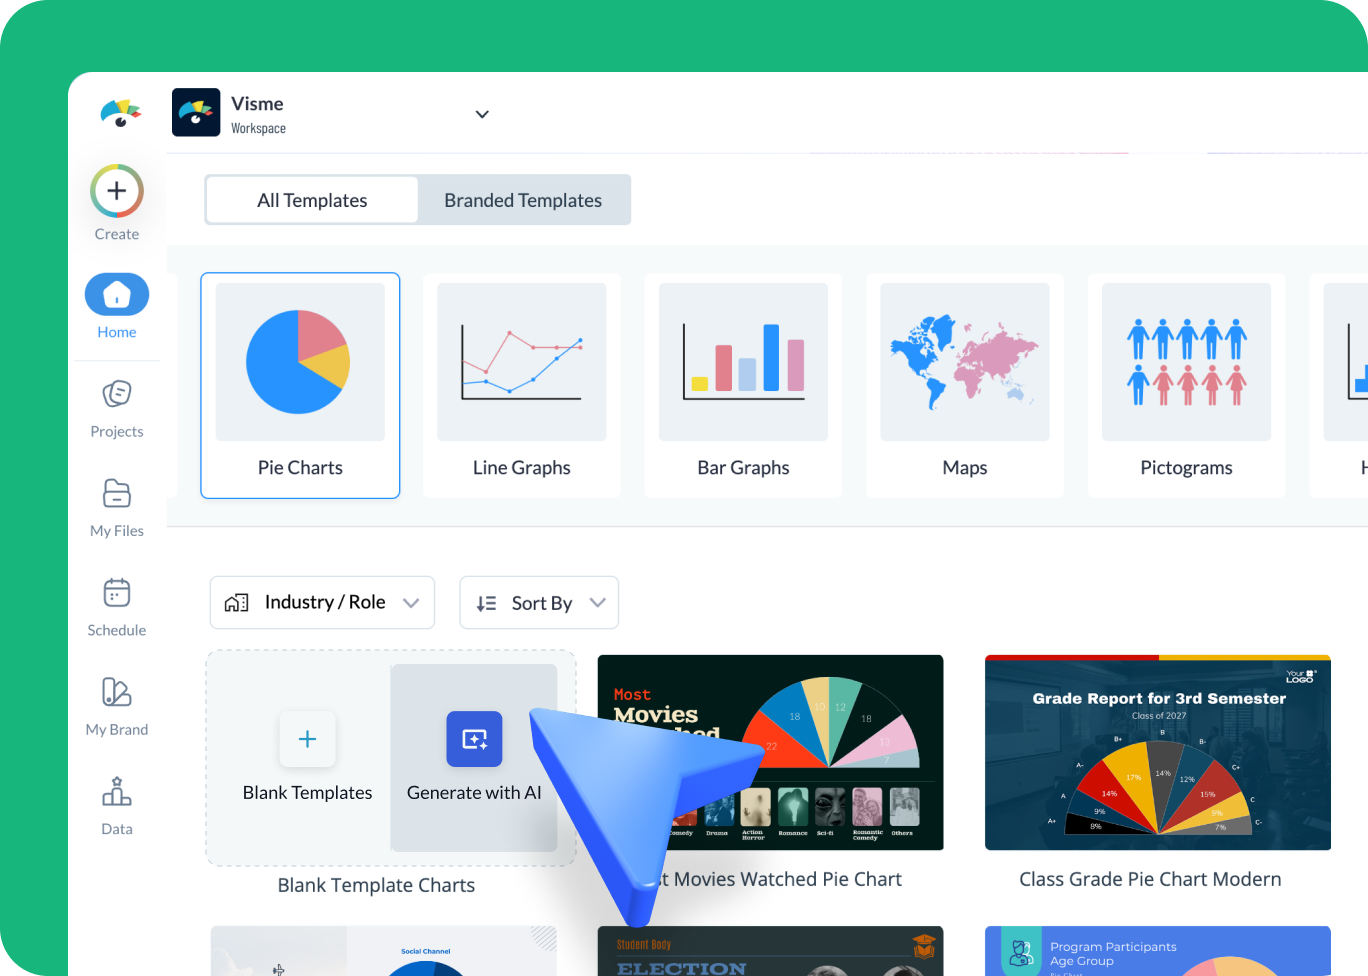

- Log in to the Visme dashboard to get started. Then, to open the template library, select Create New -> Project -> Generate with AI. The chatbot popup window will open.
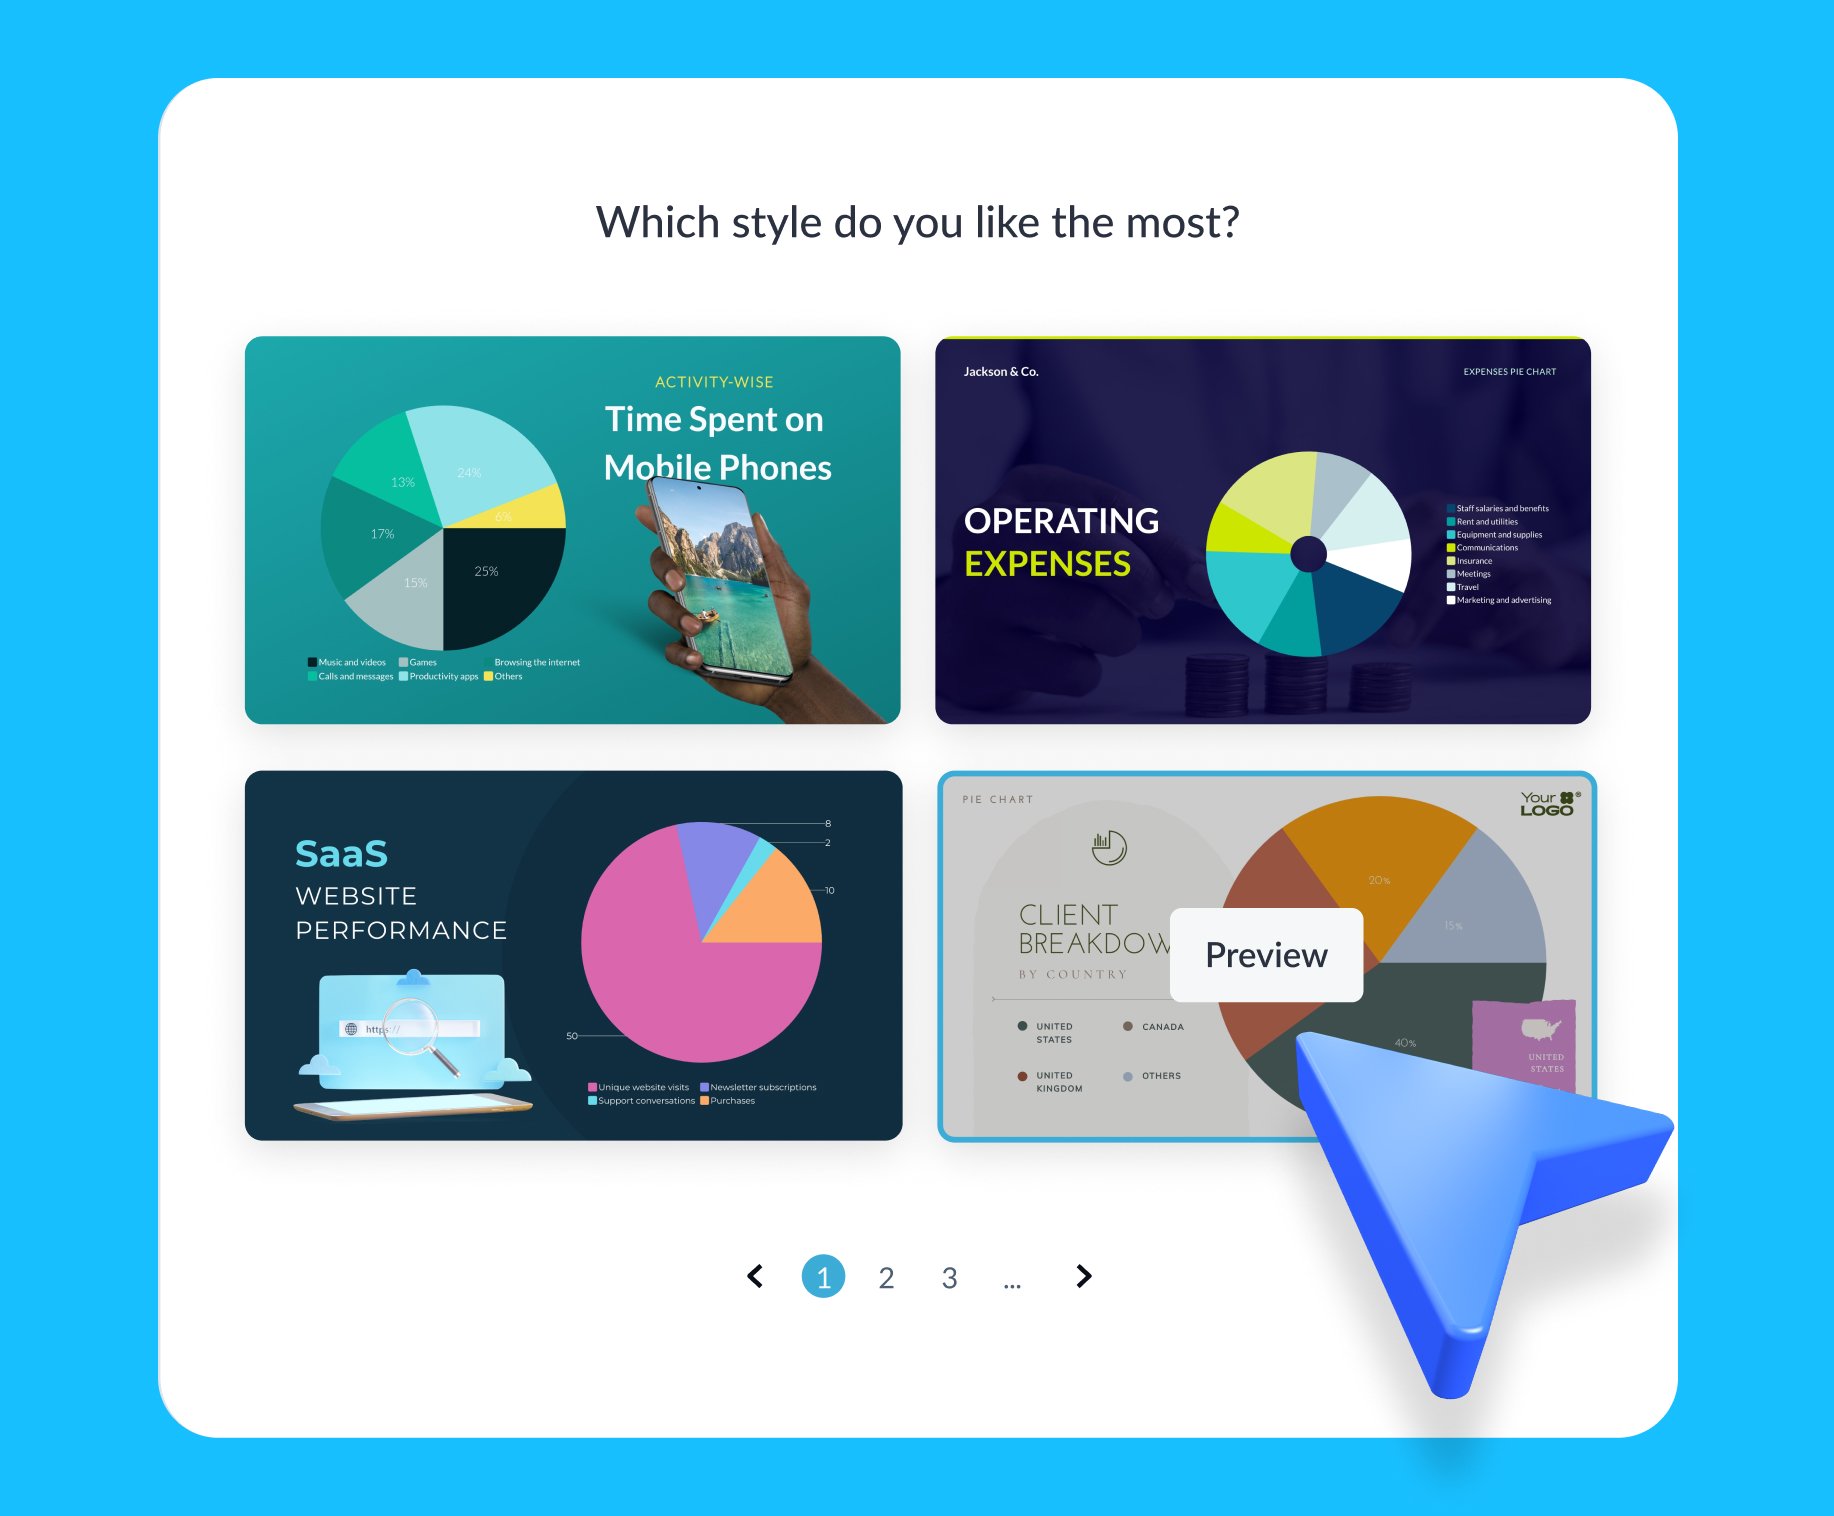
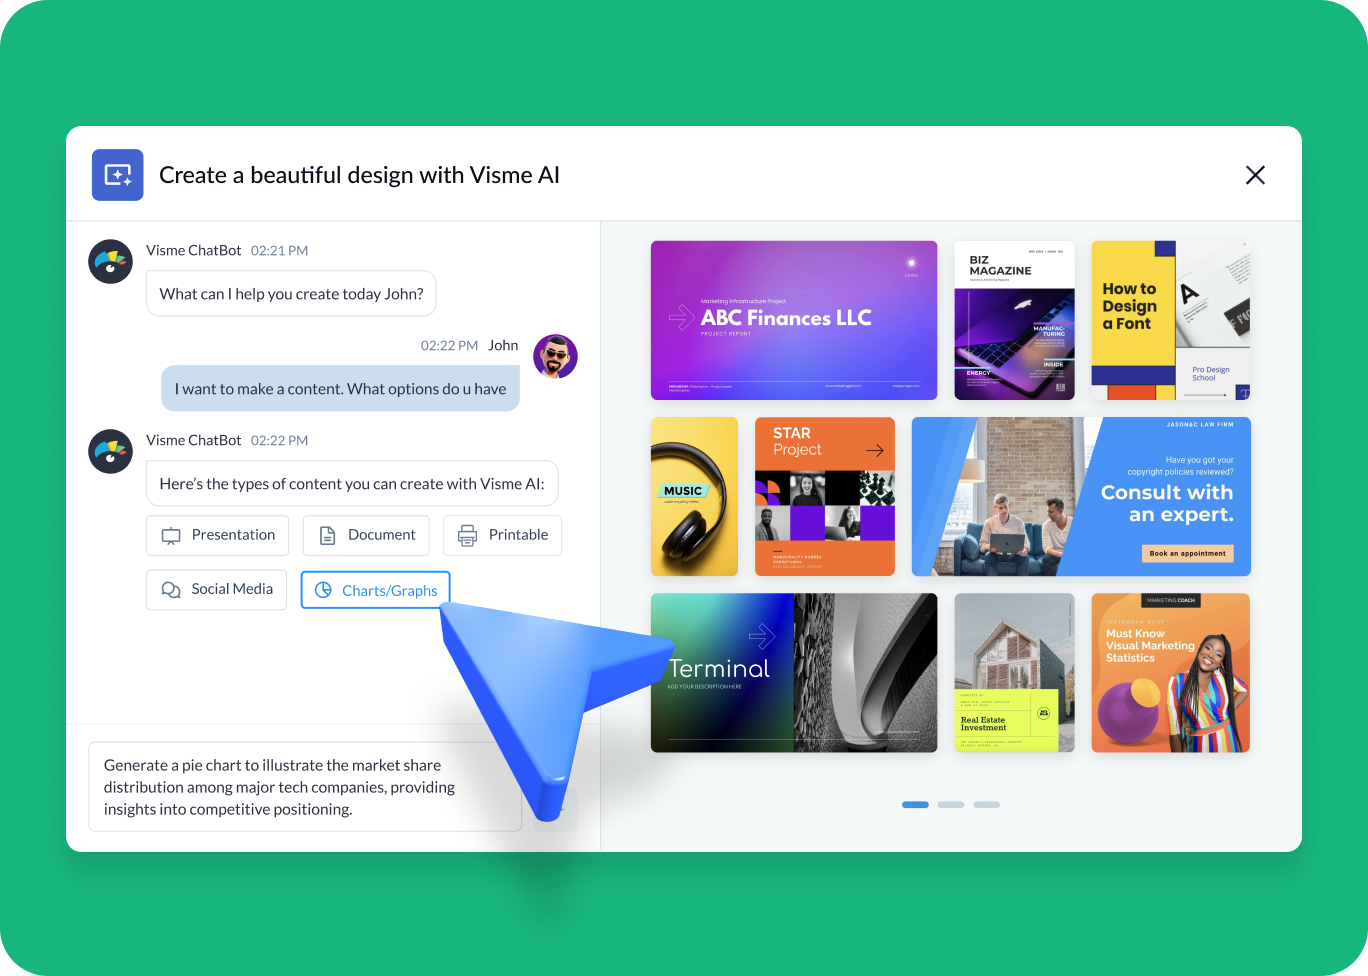
- In the popup, type a prompt to describe in detail what you want the chart to include. Specify what type of chart you need and include other relevant information.
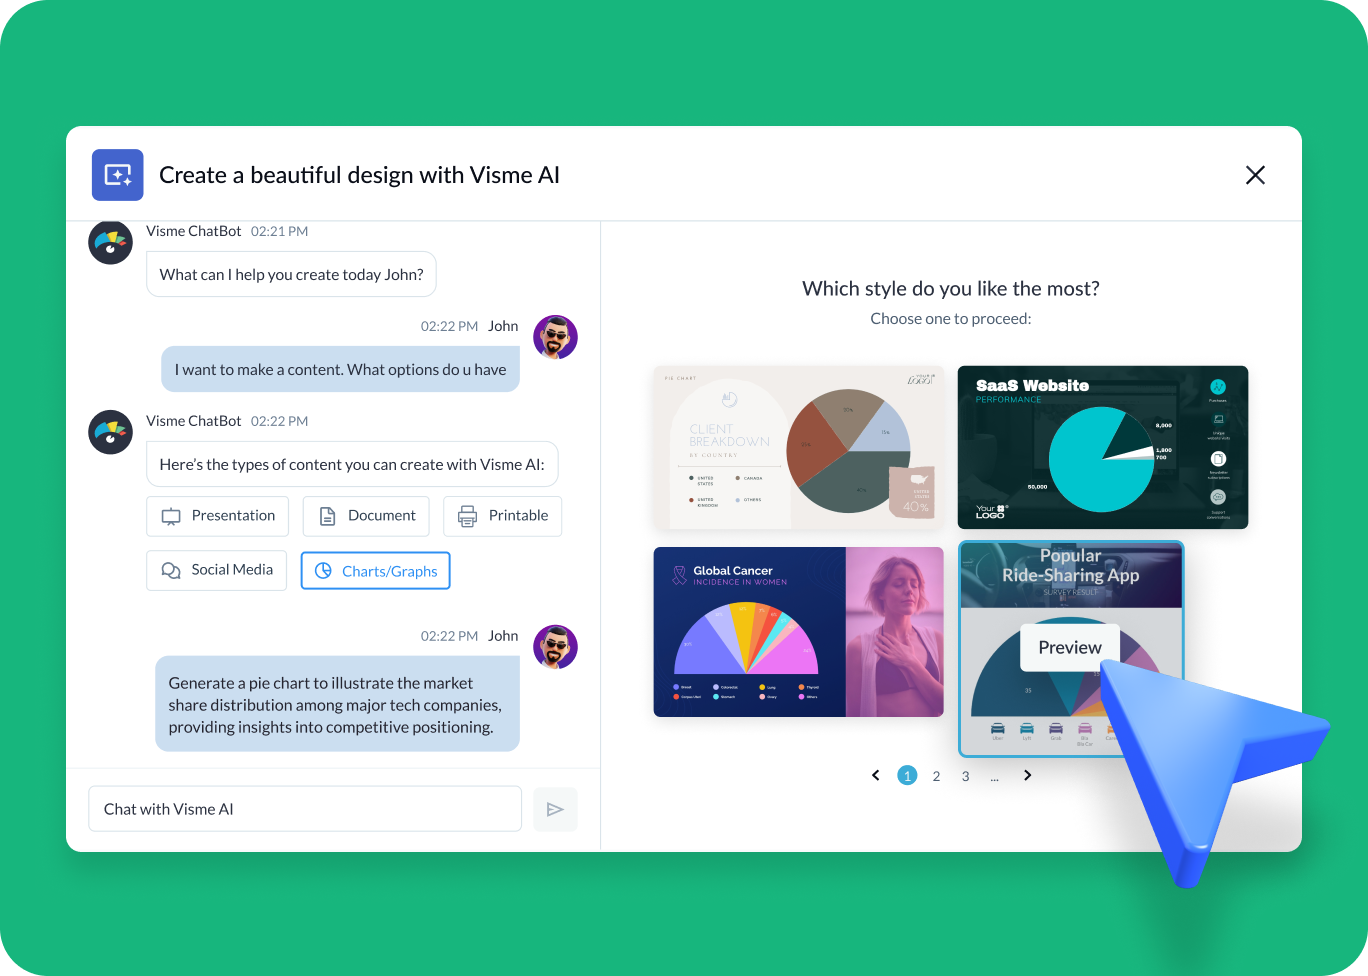
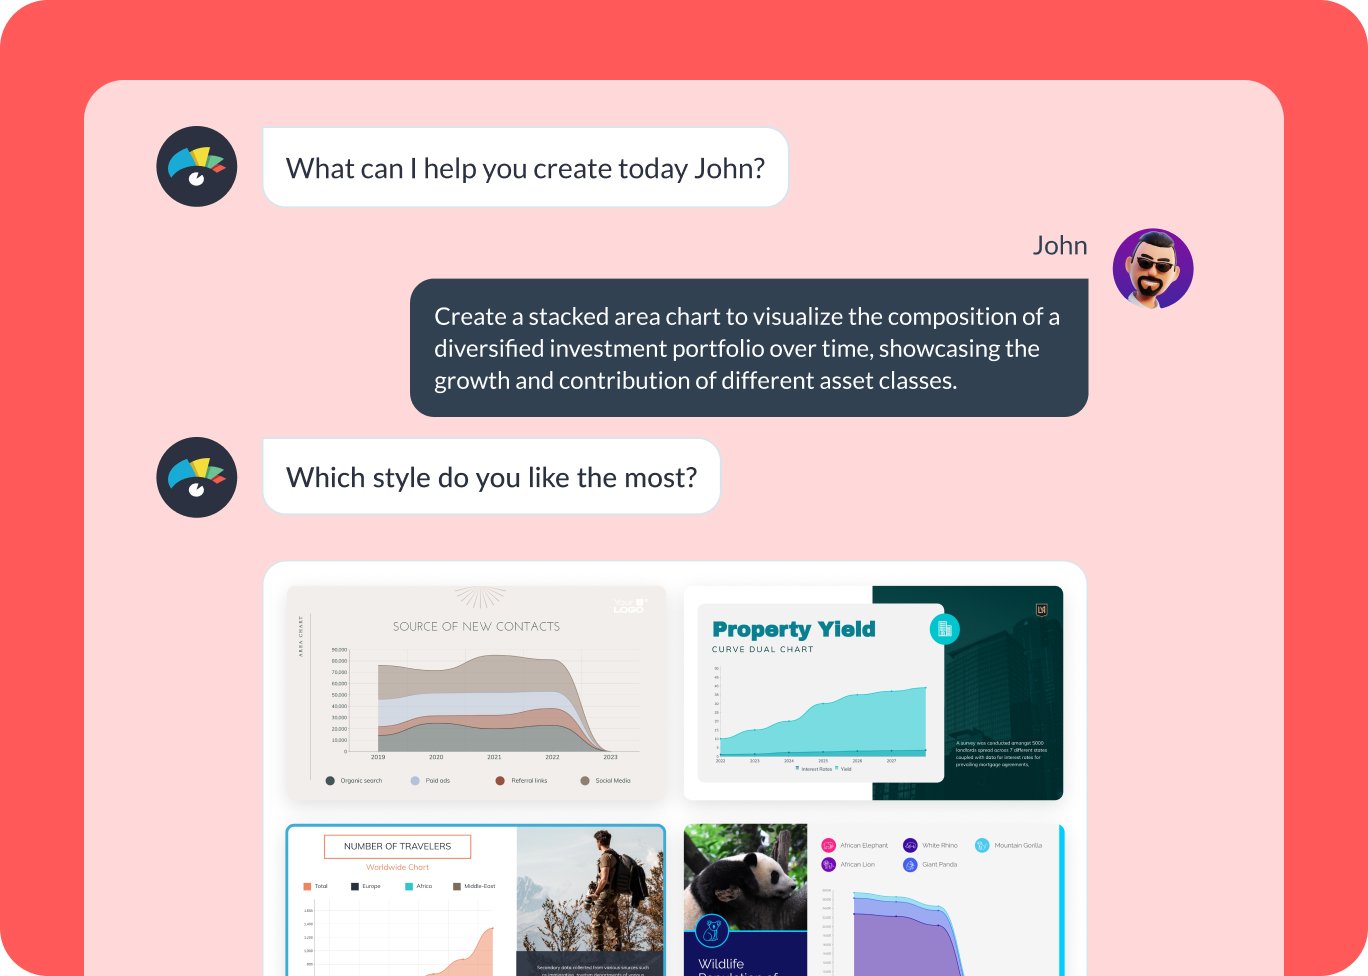
- Visme Chatbot will suggest visual styles. Select one that you like the most and let AI create text, data, and layout. Then preview, edit or regenerate your chart.
- Visme allows infinite project customization. Change a color theme, and fonts, add photos or graphics from Visme’s royalty-free gallery, or upload your images and assets.
Features of the AI Chart Maker
Ready-to-customize data visualizations in seconds
Creating professional-looking charts (especially if you’re not a data visualization designer) is typically the most challenging part of visual analysis. Visme’s free AI chart maker helps you overcome this obstacle by offering results in a short time. Input your prompt and include your data, chart/graph type and any other information you want the design to cover. Choose a style and less than a minute for Visme AI Designer to generate your design.
Vast customization options for all charts and data visualizations
Visme-made charts are user-praised for offering full control of functionalities. For example, after opening a generated chart in the editor, you can switch the type from over 15 options. Then, connect to live data or import from spreadsheets. In the settings tab, you can customize data positioning, axis and legend alignment or bar stacking. And choose if values should be visualized as percentages or numbers and their minimums and maximums.
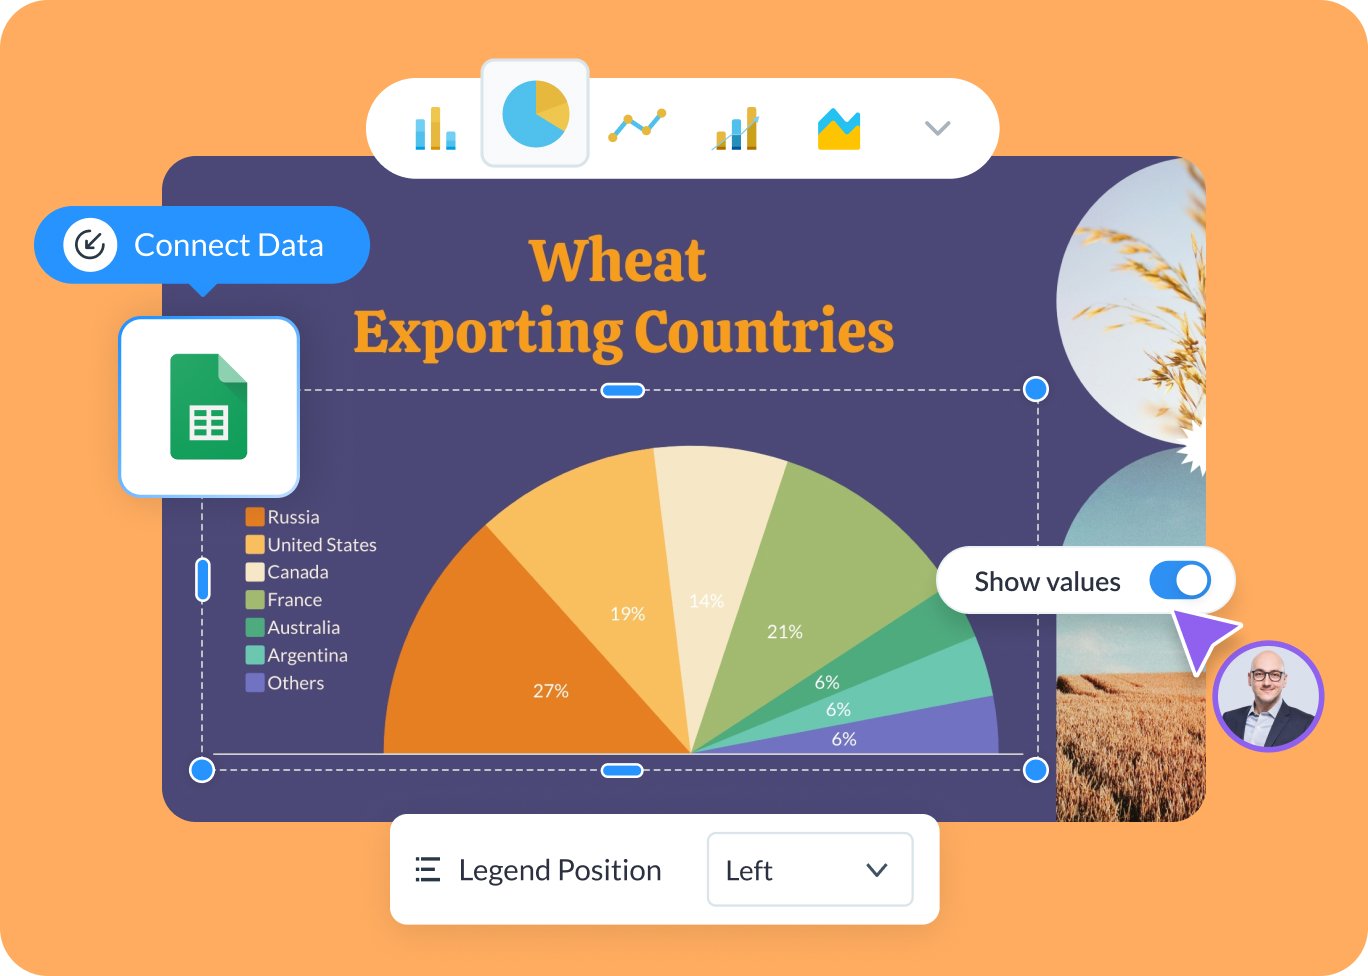
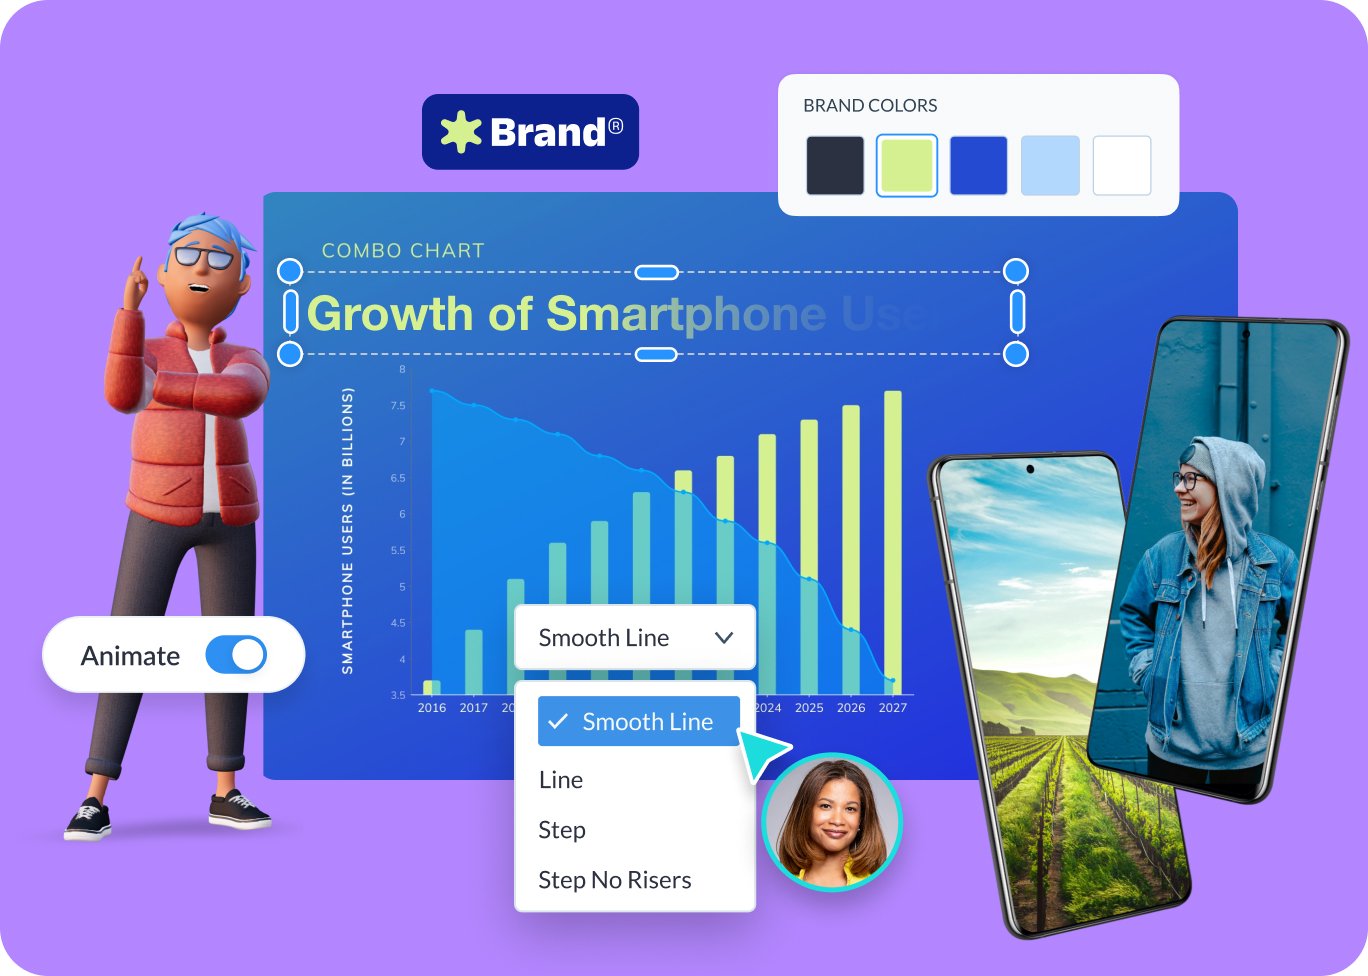
Easily adjust the design of your chart
The Visme editor is easy to use and offers numerous design personalization options. You can quickly change the AI-generated chart’s appearance like colors, fonts, legend placement and animation. Plus, there are 3D designs, characters, text effects, graphics and illustrations which you can drag into your design from the design elements library.
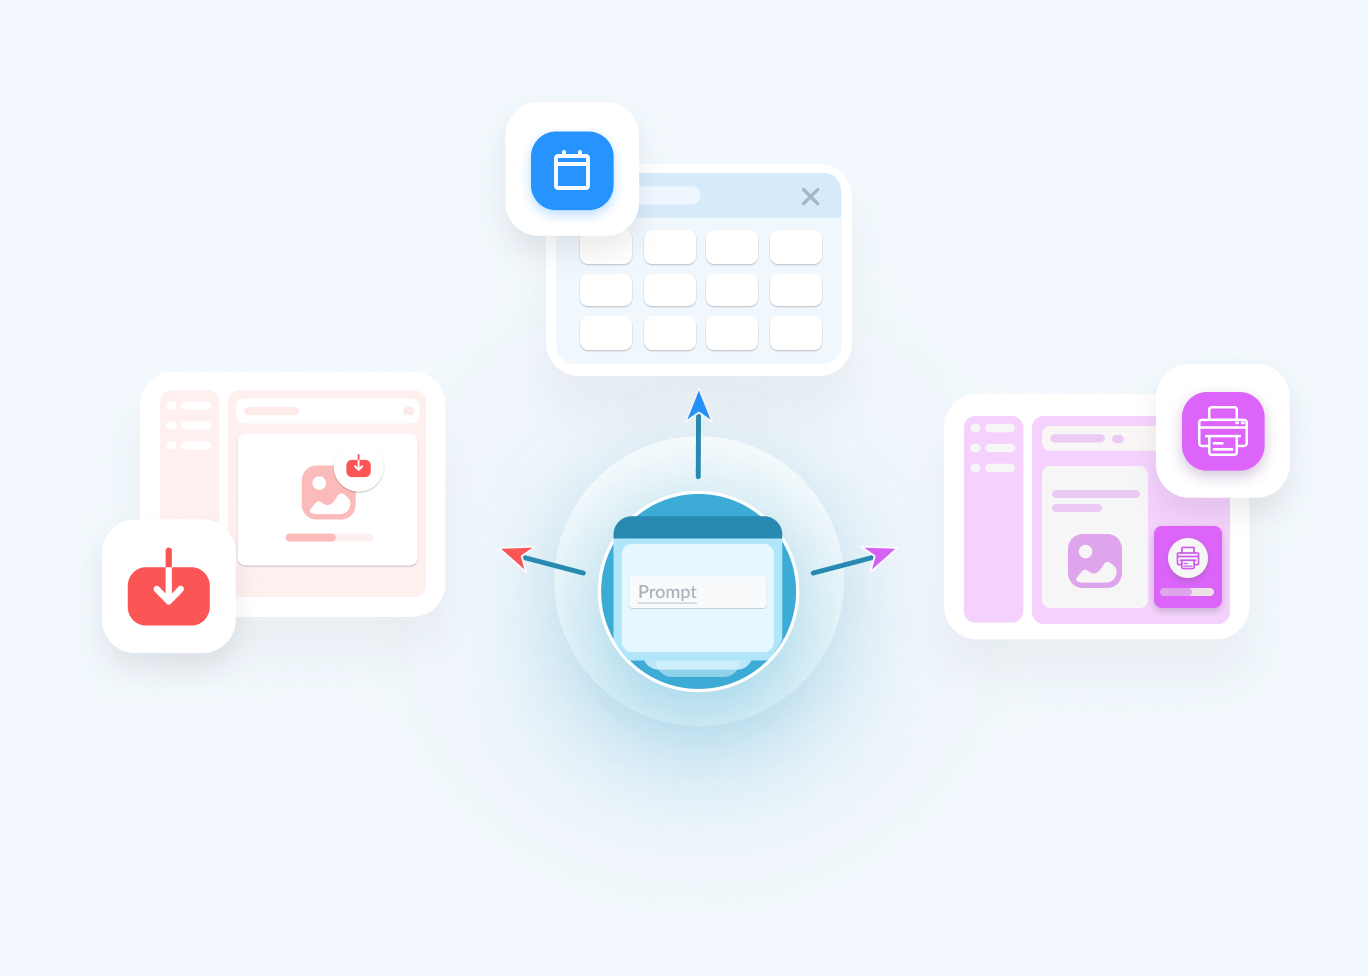
Download as image, PDF file & video, share or save as a content block
Save your chart created with Visme AI Designer as a content block to use in reports, proposals, plans, infographics and other projects. Download the chart as a JPEG, PNG, GIF, MP4, or PDF file type to use on its own. Or share as a live Visme link or on social media.
More than 15 types of charts you can create with Visme AI Designer
The Visme AI Designer lets you create more than 15 types of charts for your work or business. Design anything from bubble charts, funnel charts, cone charts and more. They’re all available within the Visme AI chatbot, accessible from the template library.
AI Pie charts
AI Area charts
AI Funnel charts
AI Mekko charts
AI Pyramid charts
AI Cone charts
AI Radar charts
AI Scatter Plots
AI Line charts
AI Combination charts
AI Bar charts
10 More Data Visualization Types


More than just an AI chart generator

Beautify your content
Unique Elements & Graphics
Browse our collection of customizable, one-of-a-kind design assets like icons, shapes, illustrations, 3D characters and more to accompany your AI-powered charts.

Make text pop
Text Effects
Make your chart titles more attractive with Visme’s text effects. Select a style from the settings window like shadow, reverb, outline, gap, cyber, neon, glow, mask and more.

Make it visually rich
Stock Photography
Enhance AI-powered chart designs with royalty-free images that can save time from searching elsewhere. Likewise, the library eliminates the need to spend money on photos from other sites.
Make the most of Visme's features
Choose the perfect visual from our extensive photo and video library. Search and find the perfect image or video using keywords that are relevant to your chart. Drag and drop it into the canvas and adjust as needed.
Create infographics easily from one of the hundreds of full-size templates and infographic shapes. Choose from statistical, anatomical and informational styles. Customize them however you wish and use the draggable edit bar to expand or minimize their length.
Quickly visualize key statistics, metrics and data points with data widgets. There are several available styles, including 3D animated gauges and thermometers. Use the widgets to show percentages, distance, time and space within your content.
Find the perfect font combination for your chart with Visme’s font pairings. Choose a pairing from the left side tool tab and apply it to your chart design easily. Select all the text you want to switch and click on the new font to change it all in one click.
Finalize your chart design using Visme’s pre-designed content blocks. Select from a variety of options; header and subtitle, short content and more. Turn your AI-generated chart design into a custom content block to reuse on any other project.
With Visme, you can make, create and design over a hundred types of content. We have templates for digital documents, presentations, infographics, social media graphics, videos, GIFs, wireframes, whiteboards, flowcharts and more.
With Visme interactive maps you can visualize geographic data in several ways. For example, you can create a regional map about social and demographic trends or a global comparative map about the differences between countries. Easily customize your data using the integrated spreadsheet using colors and visibility options.
Easily create tables to supplement your chart projects. Select from the different styles or customize your own. Use separate tables to create unique sections with information and match the colors to the chart and rest of your project, ensuring brand visibility throughout.
Frequently Asked Questions (FAQs)
Like any AI generator that depends on a text prompt, the prompt is everything. To get better results with the AI chart generator, you need better prompts. Write the prompt as detailed as possible. Mention what your chart is analyzing and what it’s about. As for style elements, there’s no need to include them in the prompt. Focus on choosing the style that you like from the Chatbot suggestions. Try to select the style that already features the color palette and chart type that you like. AI will change design elements based on text it generates.
Visme’s AI chart generator is available in all plans and works on a per-credit basis. Every free account gets 10 credits, Starter accounts get 200, Pro gets 500 and Enterprise is unlimited. Every design generation costs 3 credits and usage of other AI tools costs 1 credit.
No, Visme AI chart generator was developed in-house and is a unique tool. However, it does use third-party APIs: ChatGPT and Unsplash.
All designs you create with AI Design Generator are copyright and royalty-free. You can use them both for personal and commercial use without any problems.
Visme’s AI design generator can:
- Generate full designs for various content types, including presentations, documents, printables, and social media graphics. Click here to view the full list of document, printable, and social media graphics subcategories.
- Follow your instructions for the text you want in your projects, although not word for word.
- Adapt photos and icons to complement the generated text.
- Create charts, graphs, data widgets and tables.
- Customize designs based on your specifications for color.
- Handle one project at a time.
- Include animations in projects only if the selected style features animation.
- Generate designs with a maximum length of 10 pages.
Visme’s AI design generator can’t:
- Generate infographics, whiteboards, web graphics, videos, or GIFs.
- Reproduce your text verbatim.
- Customize based on your specifications for shapes, graphics, and design style. Select a style that already resembles what you want in your project, and you can manually edit all design elements in the Visme editor.
- Create or modify diagrams, or infographics.
- Crawl external websites and gather information from them.
- Handle multiple projects at once.
- Generate designs more than 10 pages in length.