Turn Complex Data Into Clarity Insurance Clients Can Trust
Why Data Visualization Matters in Insurance
- Claims data is messy: Visualizing trends, timelines, and outcomes makes decisions faster.
- Underwriting insights need clarity: Charts help brokers and clients understand risk without spreadsheets.
- Policy updates require simple explanations: Visuals reduce confusion and improve communication across regions.
- Regulatory teams need transparency: Add disclaimers, version stamps, and audit notes directly inside visuals.
- Distributed teams stay aligned: Regional offices interpret data the same way with standardized visual formats.
How Visme Helps You Tell the Story
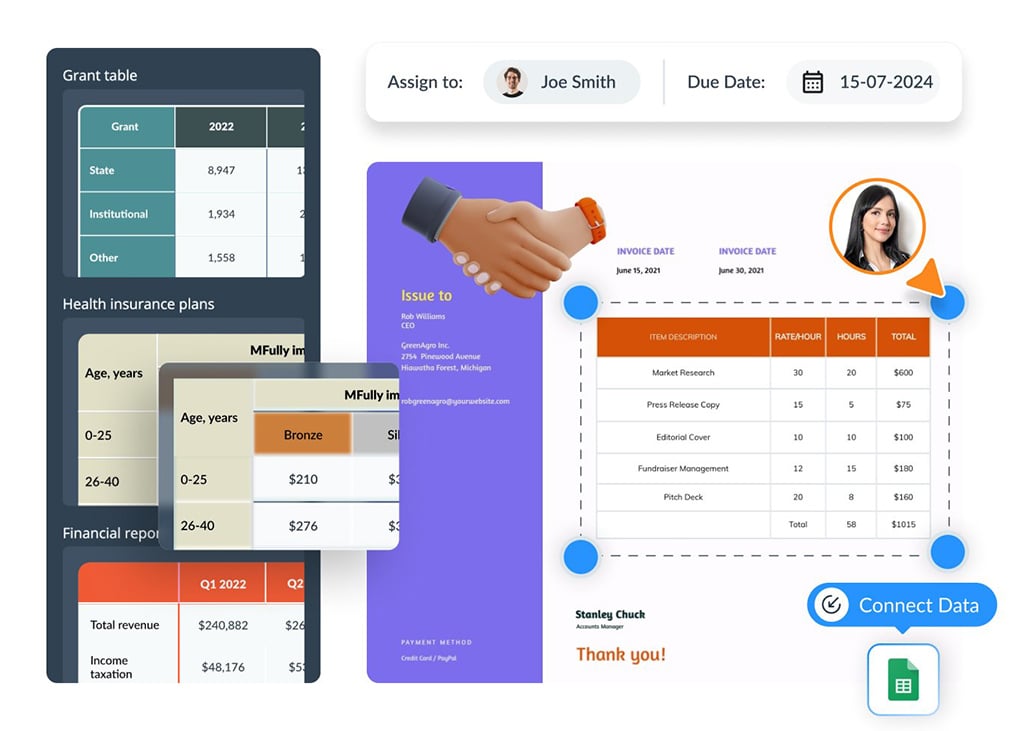
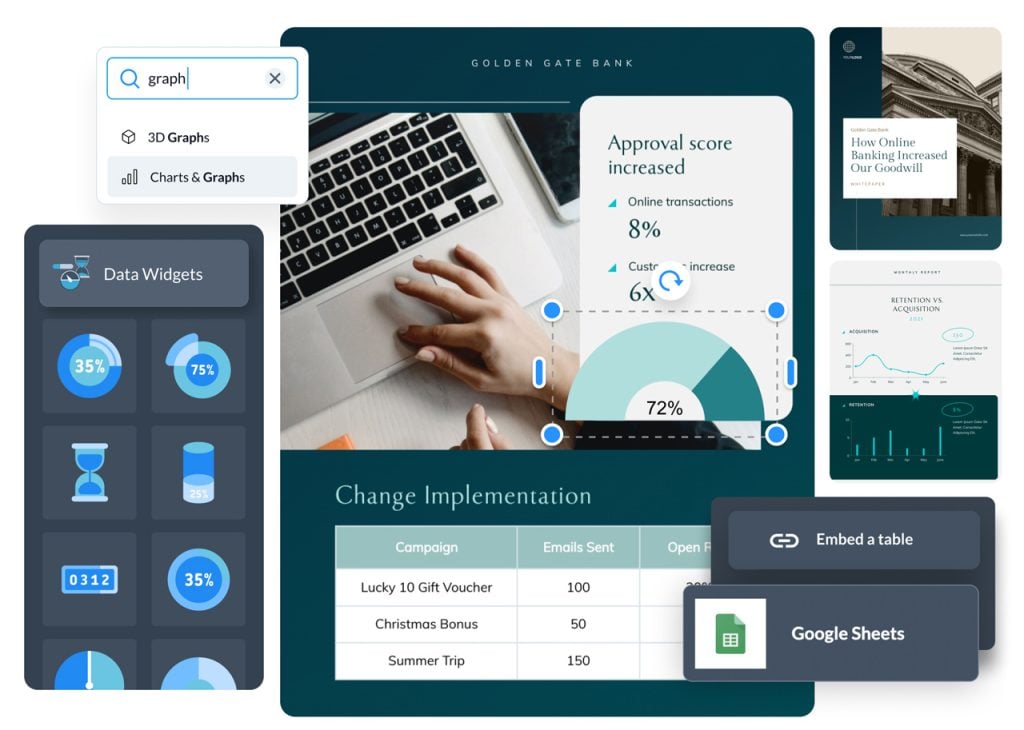
- Live Data Sync: Connect Excel/Sheets so claims or risk data in projects update automatically.
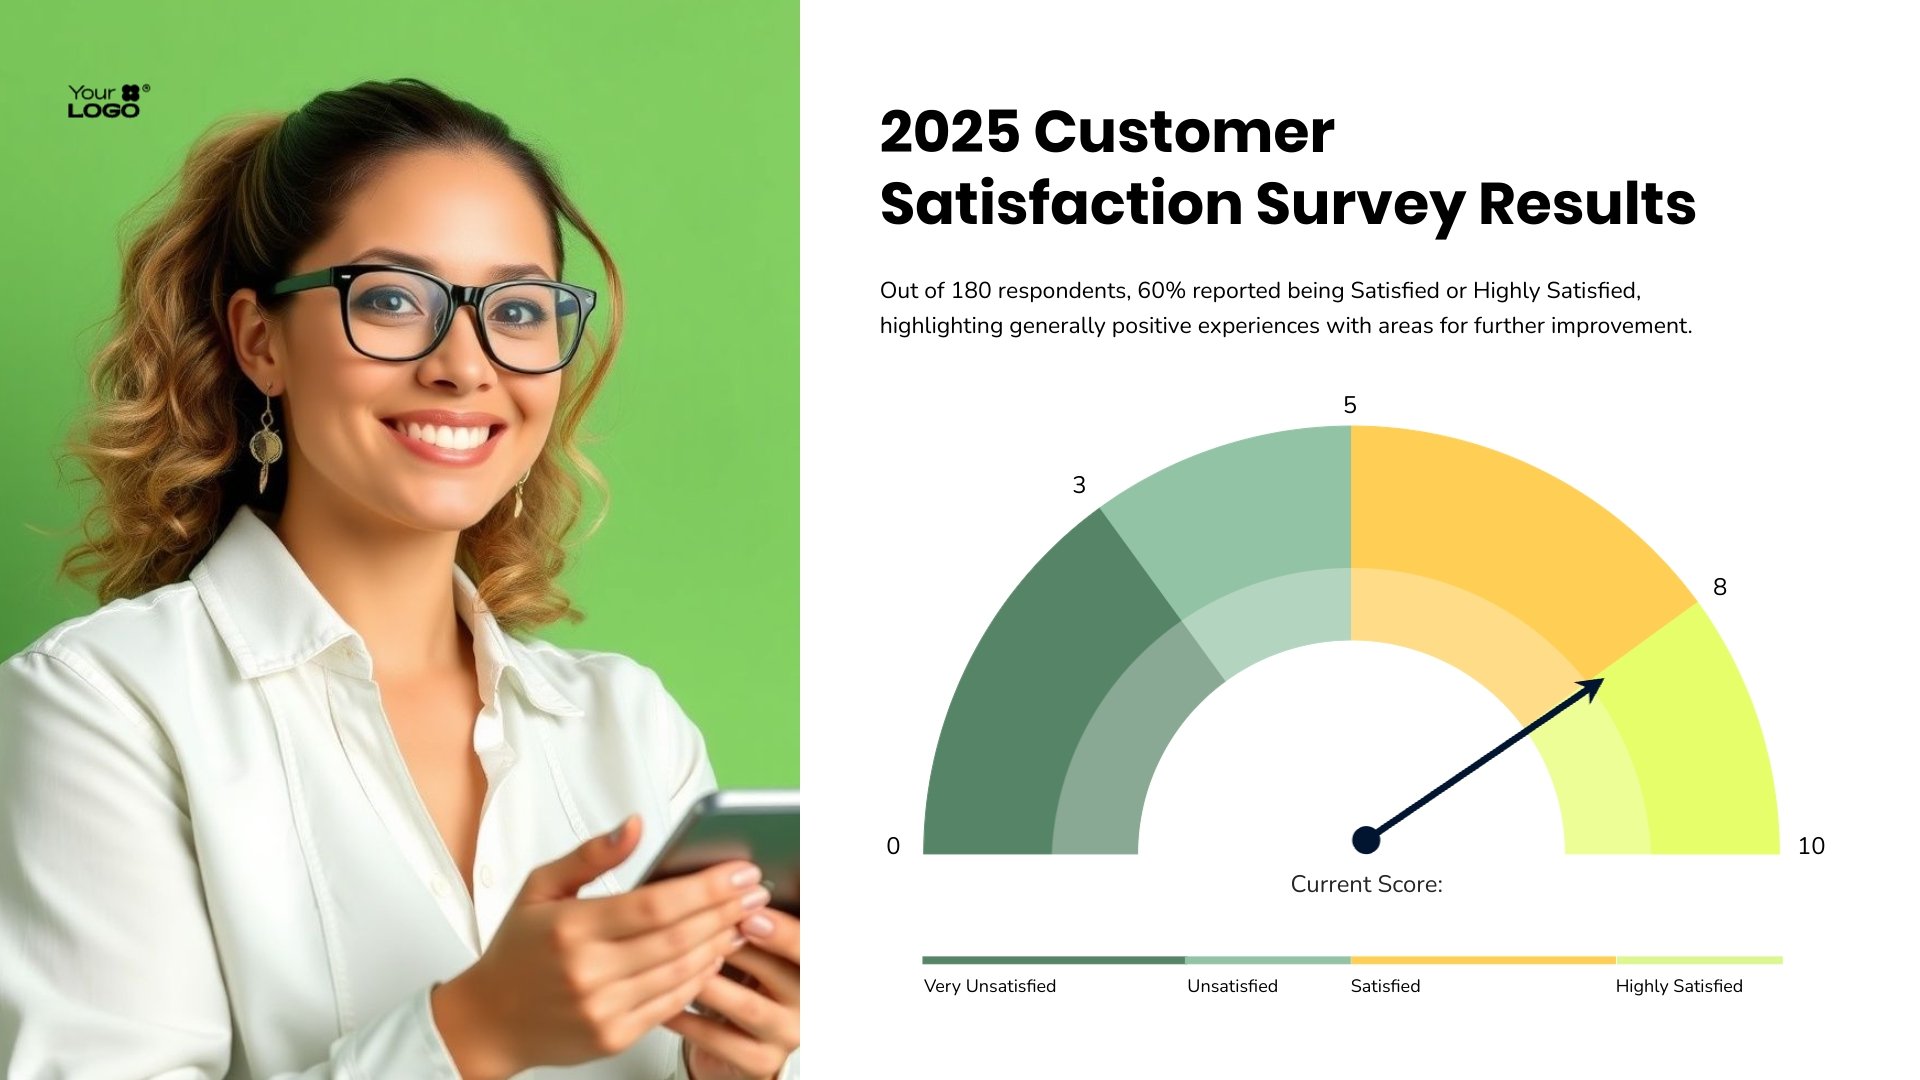
- Smart Charts & Dashboards: Build visual summaries for claims cycles, loss ratios, and performance KPIs.
- On-Brand Design Controls: Apply your firm’s brand colors, typography, and required disclaimers to every chart.
- Interactive Layers: Use popups, hover states, and animated views to simplify detailed datasets.
- Secure Export Options: Share password-protected links or export encrypted visuals to meet compliance standards.
What You Can Create


Engage your team easily
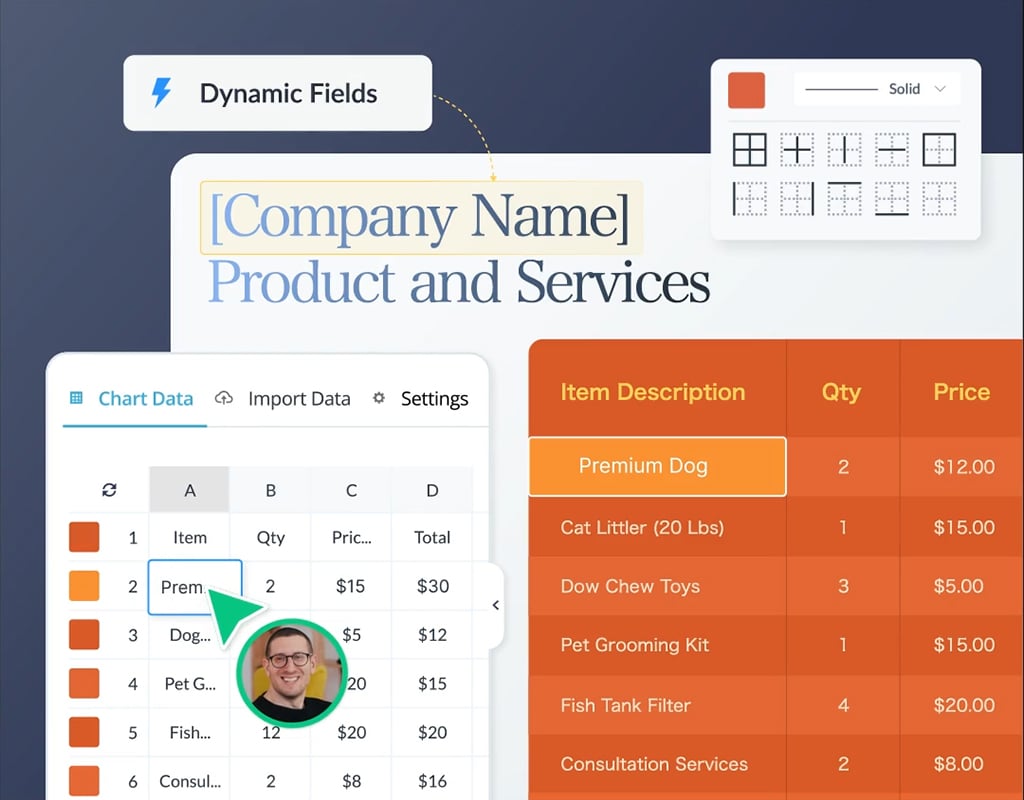
- Access over 30 easily customizable data widgets to present key information beautifully.
- Use templates for charts, tables, and graphs to save time when presenting large data sets.
- Create drag-and-drop diagrams in seconds to make complex connections simple.
- Add unique, customizable 3D characters to boost engagement and information retention.
Integrate key data seamlessly
- Integrate with Tableau and PowerBI to keep your data in one place.
- Edit assets (including diagrams) without rebuilding them from scratch.
- Upload your data as an Excel or CSV file to populate charts or pull live data from Google Sheets or Excel Online.
- Access a flexible platform that offers new updates every month.

Collaborate in a single platform
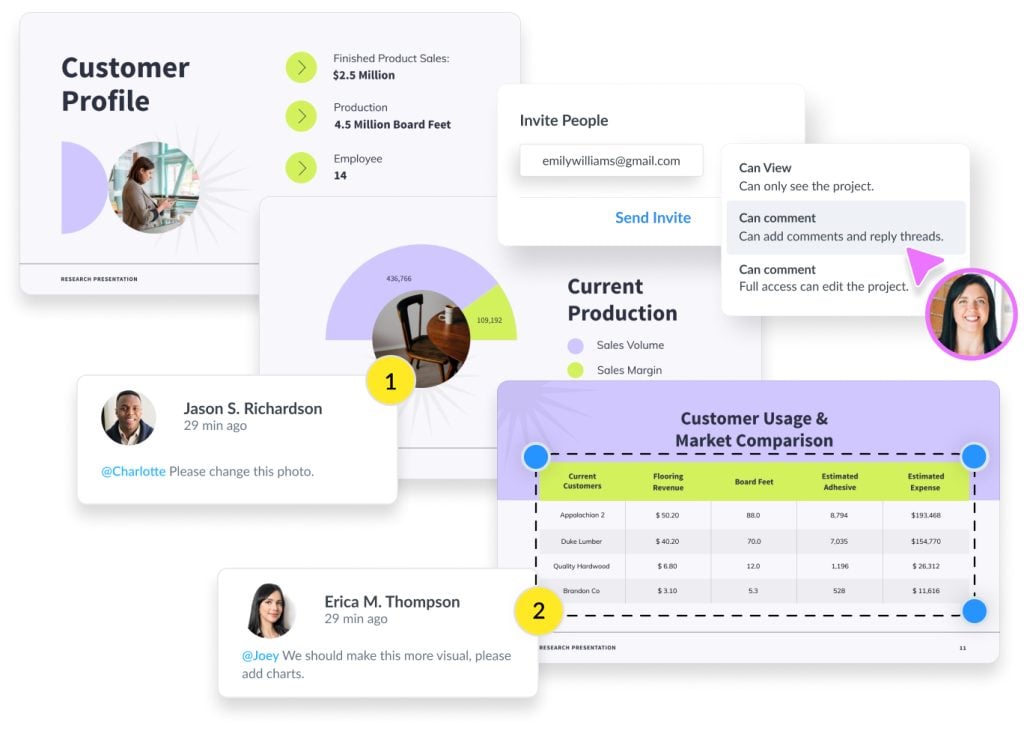
- Help stakeholders understand what the data is saying with an all-in-one content platform.
- Update key details in several places at once with scaled updating.
- Get real-time feedback with commenting, markup editing, and automatic notifications on replies.
- Retain control over who can edit/view designs & share them with your audience when they’re perfect!
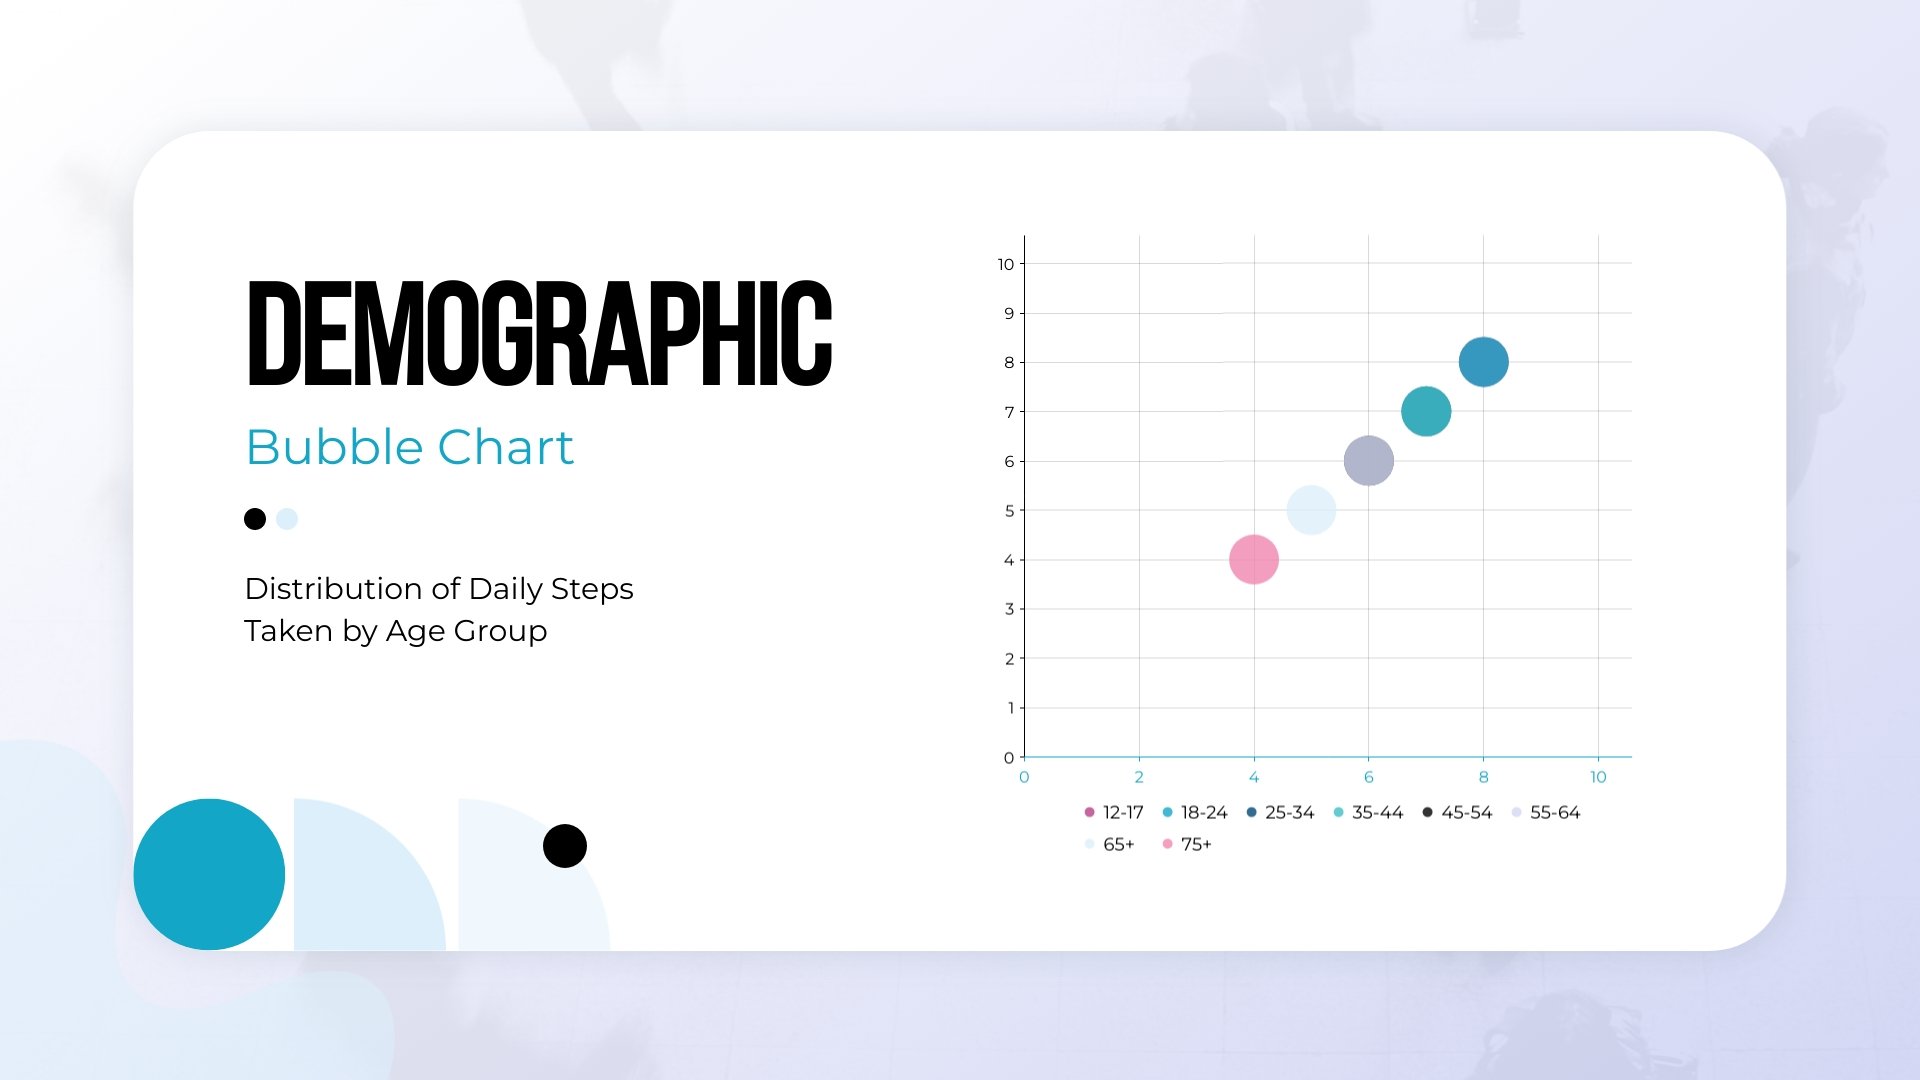
Visualize Your Data With Customizable 3D Charts
- Edit your 3D charts by rotating their position, adjusting the size or changing colors and fonts.
- Five options to choose from: line and multi-line graphs, or bubble, pie and ring charts.
- Add them to your presentations, documents, infographics or any of our 100+ content types.

Transform Raw Data into Beautiful Visual Content
Ready to Transform Data into Insights That Win Clients?
Frequently Asked Questions (FAQs)
Insurance teams use Visme to create compliant presentations, client reports, policy summaries, training materials, dashboards, and sales enablement content, all with consistent branding and faster turnaround.
Yes. Visme uses enterprise-grade security with encrypted data at rest and in transit, SSO/SAML support, role-based access, and strict permission controls suitable for regulated teams. However SSO is only available for Enterprise plans with 15 or more users.
Yes. You can lock templates, restrict edits, enforce brand elements, require approvals, and centralize content so every advisor, broker, or regional team stays compliant.
Absolutely. Visme’s Brand Kit and locked templates ensure all presentations and reports follow approved fonts, colors, logos, and layouts, no off-brand decks.
Yes. Visme lets you import data from Excel, CSV and Google Sheets, to build charts, dashboards, and data visualizations that update instantly when your data changes.
Yes. Brokers, agents, and partners can use controlled access links or restricted templates to create compliant, on-brand materials without exposing internal data or design files.
Yes. Visme supports real-time collaboration, commenting, version history, slide assignments, and shared workspaces so training, sales, marketing and compliance can work together seamlessly.
Not at all. Visme is built for non-designers. Drag-and-drop tools, brand kits, AI assistance, and ready-made templates make it easy to create polished insurance content without design training.
Visme supports exports to PDF, PPTX, image files, video, HTML5, and shareable web links. You can also embed content directly into portals, LMS systems, or internal tools.
Yes. Visme offers enterprise workspaces, SSO/SAML, advanced permissions, analytics, centralized branding, and governance features built to support large, distributed insurance teams.