Turn Client Data & Reports into Stories That Build Trust

Why Your Report Matters More Than Ever
- Make every review seamless: clear visuals prove transparency and expertise.
- Simplify complex data and results: turn spreadsheets into story-driven dashboards.
- Stay consistent and compliant: protect brand and regulatory standards.
- Save hours each quarter: create a report template once, update, and present instantly.
The Core Elements of a Professional Client Report
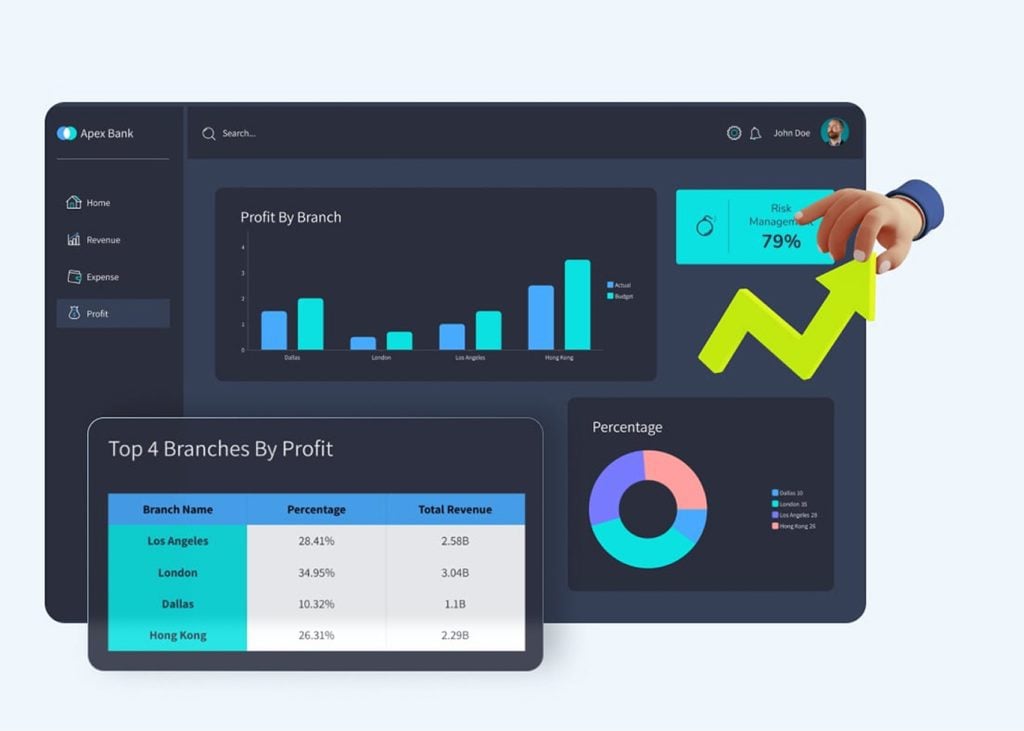
- Clear Overview: Present portfolio goals, risk, and performance at a glance.
- Branded Design: Keep every page aligned with firm colors and standards.
- Data Storytelling: Turn metrics into visuals that clients understand instantly.
- Trusted Disclosures: Automate legal notes and compliance footers with ease.
- Actionable Insight: Add commentary that reinforces your firm’s expertise.
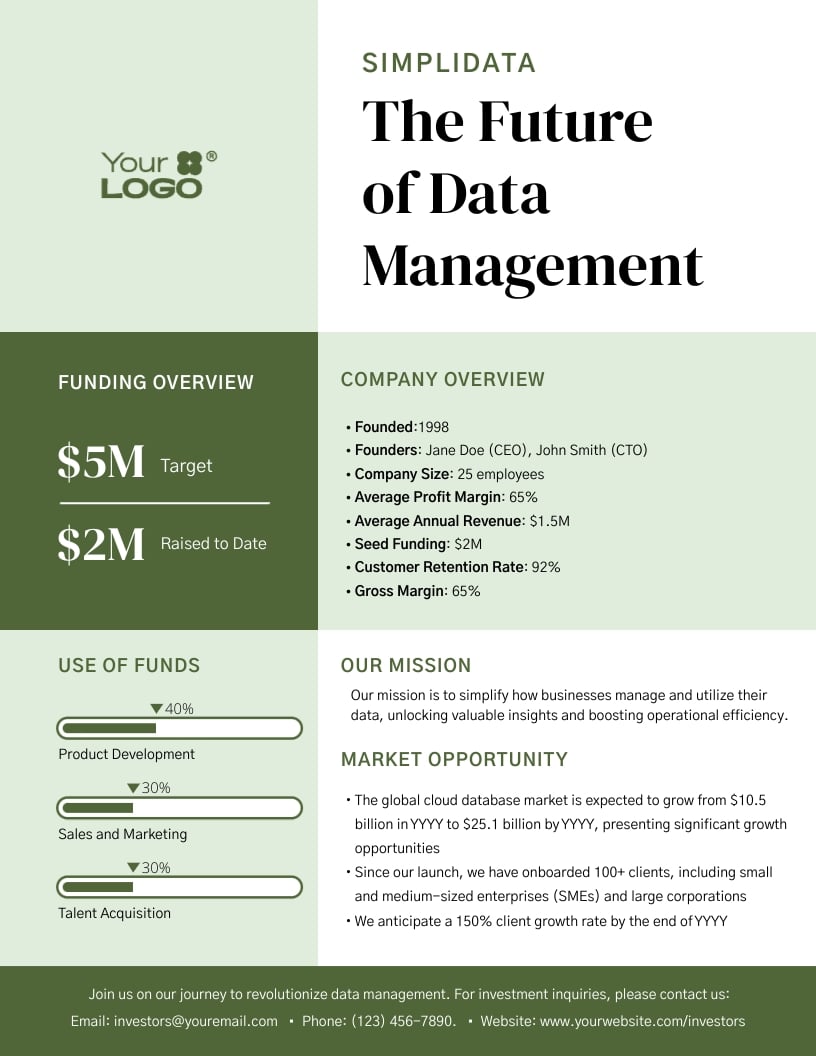
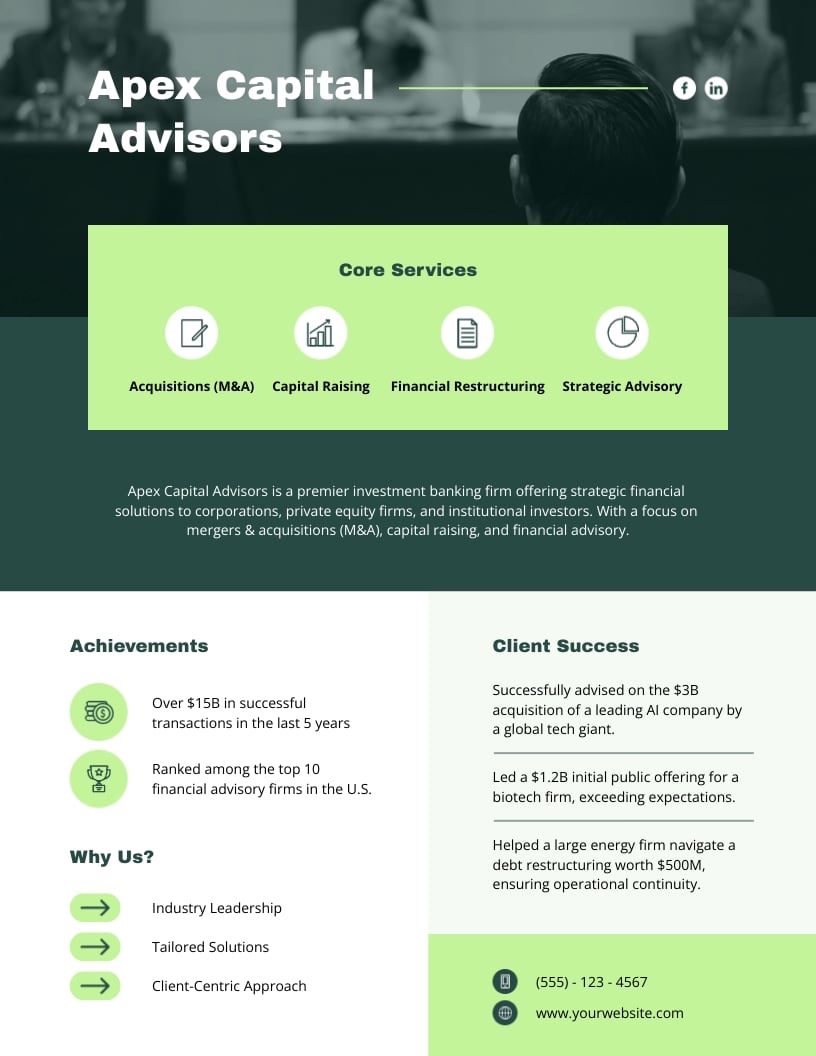
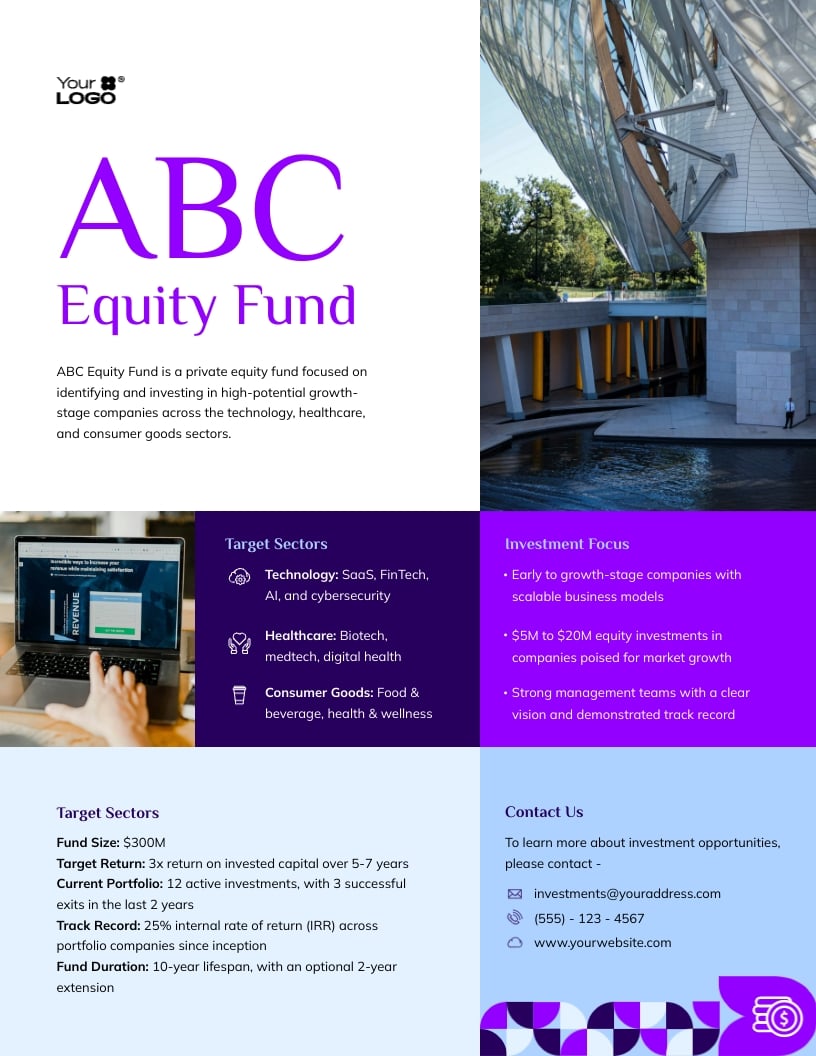
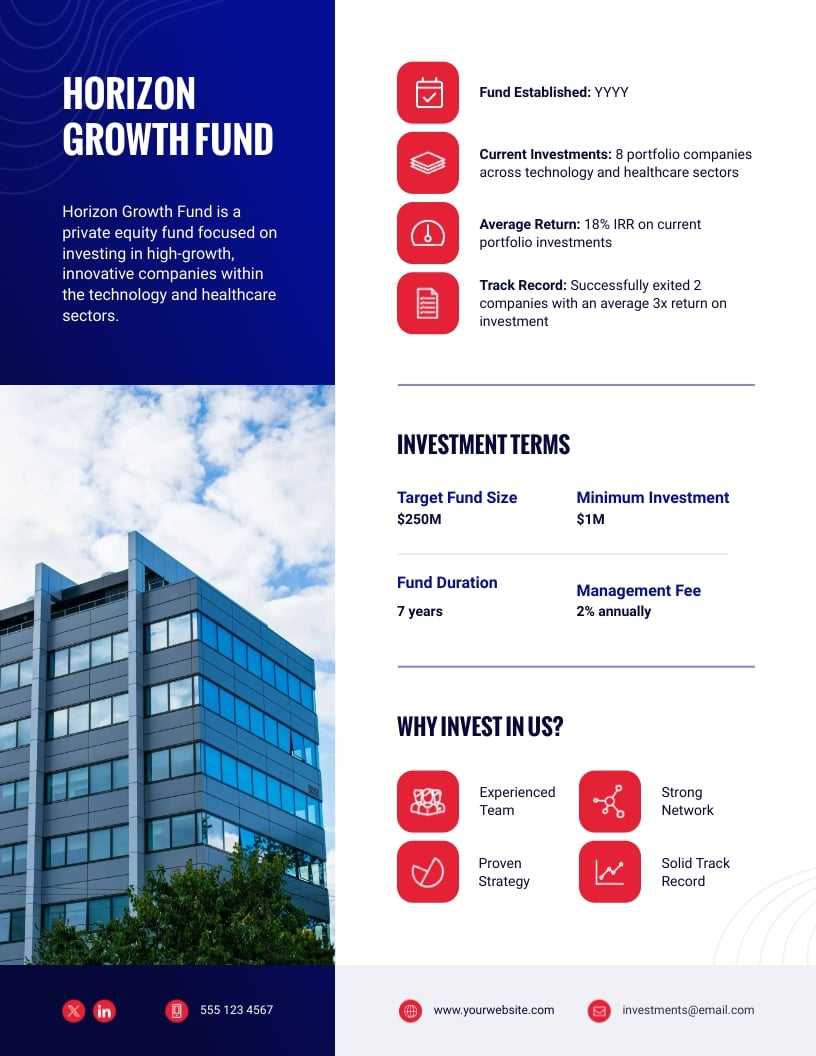
Top Client Reporting Templates


Build captivating charts and graphs
- Engage viewers more quickly with thousands of amazing templates.
- Customize easily to amplify your brand or design.
- Upload data or connect live to Excel Online, Google Sheets, and more.
Create design-driven tables
- Access hundreds of table templates.
- Use font styles and themes to customize more easily.
- Integrate with Google Sheets and Microsoft to populate tables in an instant.
Showcase your ROI with 3D Charts
- You can customize your chart’s visual appearance like editing font, color and size of elements like the heading, axis points and legend.
- Import your data from Google Sheets, Excel, Google Analytics, Survey Monkey, SmartSheet or Airtable. Show live data updates with a simple refresh by connecting to a Google Sheet published to the web, Excel Online account or your Google Analytics dashboard.
- Make your 3D Charts interactive by rotating 360 degrees, or use Visme’s animation features to add entry and exit movement.
Achieve all of this and
more with Visme
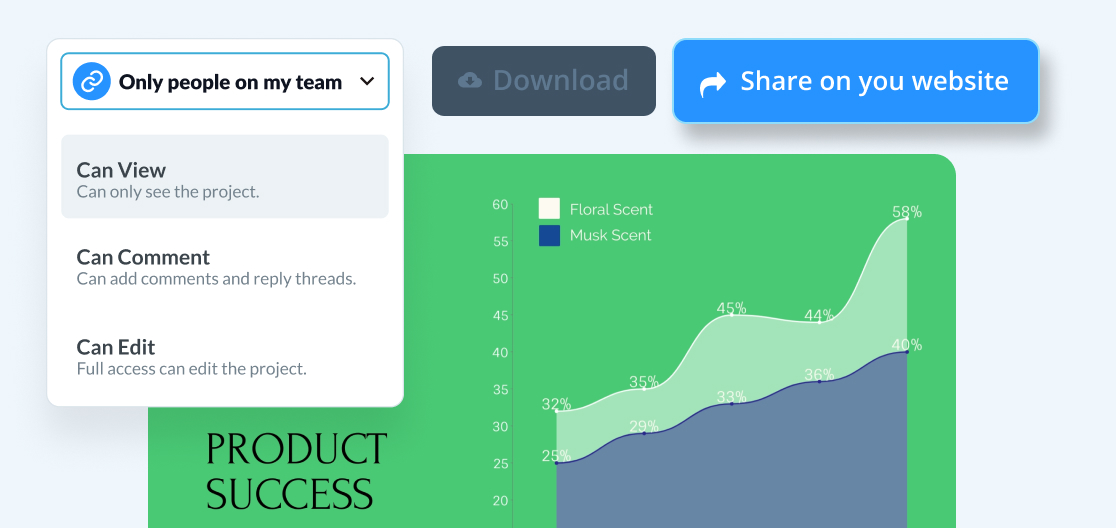
Create interactive data
visualizations
Pull through live data and allow your audience to engage with it in a new way.

Embed data visualizations
onto your site
Build trust with every visitor or password-protect for exclusive access.
Make a dashboard
in seconds
Pull through data visualizations in other projects to create a captivating dashboard.

Create internal reports that are
more digestible
Make your whitepapers, e-books, and reports more data-rich and visually appealing.

Make more memorable
explainer videos
Use high-quality data visualizations to explain complex concepts and keep viewers engaged.


Create a Winning Client Report Guide in Minutes, Not Days
Frequently Asked Questions (FAQs)
Visme is a secure, all-in-one design platform that helps wealth management teams create branded, compliant client materials. Firms use it to design reports, proposals, and presentations that visualize data clearly, maintain brand consistency, and meet compliance standards without relying on designers.
Teams can build compliant-ready content in minutes using pre-built templates, drag-and-drop design tools, and AI features that accelerate layout, copy, and data visualization.
Yes. Advisors, legal and marketing and sales can all work in the same deck, leave comments, assign tasks, and finalize content together, no version chaos, endless email chains or Slack chasing.
Absolutely. Your brand kit and templates are locked down, ensuring every client pitch, financial report, or document represents the brand correctly for every partner.
Export in the format that fits your workflow: interactive share links with analytics, downloadable PDFs, PPTX, MP4, JPG, or embeddable content that fits digital screens and partner portals.
Yes. With permissions, password protection, and encrypted data, your sponsorship information and partner agreements stay confidential and protected.
You get onboarding, templates tailored to your needs, and ongoing success support, so your team quickly builds assets that help sell more, promote the team and retain partners.
With interactive elements like clickable tables of content, video, hotspots, and live stats, teams can bring complex data and reports to live while keeping readers engaged.
Yes. Visme is made for designers and non-designers alike so that anyone from advisors, marketing, partnerships, sales, and operations can design polished visuals without advanced skills.
Client proposals, financial strategy recaps, training materials, media kits, webinar and conference slides, digital signage, and social content.
By cutting design wait-times. Templates, AI, and centralized branding let teams produce compliant-ready materials instantly, so you never miss a renewal moment.